Báo cáo khoa học: A kinetic study of a ternary cycle between adenine nucleotides pptx
Bạn đang xem bản rút gọn của tài liệu. Xem và tải ngay bản đầy đủ của tài liệu tại đây (685.21 KB, 16 trang )
A kinetic study of a ternary cycle between adenine
nucleotides
Edelmira Valero
1
, Ramo
´
n Varo
´
n
1
and Francisco Garcı
´a-Carmona
2
1 Departamento de Quı
´
mica-Fı
´
sica, Escuela Polite
´
cnica Superior de Albacete, Universidad de Castilla-La Mancha, Albacete, Spain
2 Departamento de Bioquı
´
mica y Biologı
´
a Molecular A, Facultad de Biologı
´
a, Universidad de Murcia, Spain
An important feature of intermediary metabolism is
the existence of moiety-conserved cycles interconvert-
ing different forms of a chemical moiety, while the
sum of these forms remains constant [1,2]. The two
best known groups of metabolites participating in such
cycles are ATP–ADP–AMP (the moiety being the
adenylate group) and NAD(P)–NAD(P)H (the oxidized
and reduced forms of nicotinamide adenine dinucleo-
tide). As in the case of substrate cycles [3,4], the occur-
rence of cycling in closed (moiety-conserved) cycles [5]
generally leads to an expenditure of energy, whereas
there can be no changes in the total concentration of
the converted substrates. The physiological role of this
wasteful cycling has been proposed to be mainly a way
of amplifying a metabolic response against a signal,
such as a change in a metabolic concentration. This
phenomenon, called amplification or ultrasensitivity,
has been experimentally proven to occur in binary
closed cycles [6–9].
The great sensitivity shown by cycles in metabolism
has been applied in the laboratory to the quantitative
determination of low levels of a metabolite or to the
amplification of an enzymatic activity by coupling two
bisubstrate enzyme-catalyzed reactions acting in oppos-
ite directions [10,11] and in enzyme-linked immuno-
assays [12–14]. Numerous kinetic studies about this
reaction scheme have been performed [15–19] and even
equations have been obtained for calculating enzyme
Keywords
enzymatic cycling; enzyme kinetics; moiety-
conserved cycle; pyruvate kinase; S-acetyl
coenzyme A synthetase ⁄ adenylate kinase
Correspondence
E. Valero, Departamento de Quı
´
mica-Fı
´
sica,
Escuela Polite
´
cnica Superior de Albacete,
Universidad de Castilla-La Mancha, Campus
Universitario, E-02071-Albacete, Spain
Fax: +34 967 599224
Tel: +34 967 599200
E-mail:
The mathematical model described here has
been submitted to the Online Cellular
Systems Modelling Database and can be
accessed at />database/valero/index.html free of charge
(Received 19 April 2006, revised 22 May
2006, accepted 8 June 2006)
doi:10.1111/j.1742-4658.2006.05366.x
In the present paper, a kinetic study is made of the behavior of a moiety-
conserved ternary cycle between the adenine nucleotides. The system con-
tains the enzymes S-acetyl coenzyme A synthetase, adenylate kinase and
pyruvate kinase, and converts ATP into AMP, then into ADP and finally
back to ATP. l-Lactate dehydrogenase is added to the system to enable
continuous monitoring of the progress of the reaction. The cycle cannot
work when the only recycling substrate in the reaction medium is AMP. A
mathematical model is proposed whose kinetic behavior has been analyzed
both numerically by integration of the nonlinear differential equations
describing the kinetics of the reactions involved, and analytically under
steady-state conditions, with good agreement with the experimental results
being obtained. The data obtained showed that there is a threshold value
of the S-acetyl coenzyme A synthetase ⁄ adenylate kinase ratio, above which
the cycle stops because all the recycling substrate has been accumulated as
AMP, never reaching the steady state. In addition, the concept of adenylate
energy charge has been applied to the system, obtaining the enabled values
of the rate constants for a fixed adenylate energy charge value and vice
versa.
Abbreviations
ACS, S-acetyl coenzyme A synthetase; AEC, adenylate energy charge; AK, adenylate kinase; LDH,
L-lactate dehydrogenase; PEP,
phosphoenolpyruvate; PK, pyruvate kinase; Pyr, pyruvate; S
T
, total adenylate substrate concentration.
3598 FEBS Journal 273 (2006) 3598–3613 ª 2006 The Authors Journal compilation ª 2006 FEBS
quantities that minimize the cost of assays [20]. Sensi-
tivity of the system can be further increased in several
ways, such as using a 2 : 1 stoichiometry for the recyc-
ling substrates [21] and double-cycling [11,22].
The present paper addresses our investigation of the
kinetic study of the behavior of a larger cycle involving
three enzymes (a ternary cycle). Numerous metabolic
loops involve at least three enzymes, including the tri-
glyceride ⁄ fatty acids ⁄ fatty acyl-CoA cycle, the pyru-
vate (Pyr) ⁄ oxaloacetate ⁄ phosphoenolpyruvate (PEP; or
malate) cycle, the AMP ⁄ IMP ⁄ adenyl succinate cycle
[23,24], the acetoacetyl-CoA ⁄ HMG-CoA ⁄ acetoacetate
cycle [25] and the UTP ⁄ UDP ⁄ UDP glucose cycle con-
nected to the glycogen
n
⁄ glycogen
n+1
cycle through gly-
cogen synthase [3,26]. However, there are few reports
in the literature dealing with the kinetic behavior of
ternary cyclic systems [3,26–29] and, except one for
one that includes an experimental illustration of the
UTP ⁄ UDP glucose ⁄ UDP cycle [26], they are mainly
devoted to theoretical considerations.
The experimental system chosen for the present
study was a closed (moiety-conserved) ternary cycle in
which ATP, ADP and AMP are the interconverted
substrates. The converting enzymes involved in the sys-
tem are adenylate kinase (AK; EC 2.7.4.3), pyruvate
kinase (PK; EC 2.7.1.40) and S-acetyl coenzyme A
synthetase (ACS; EC 6.2.1.1). The indicator reaction
that enables the progress of the cyclic process to be
followed is the coupling of l-lactate dehydrogenase
(LDH; EC 1.1.1.27), where NADH consumption is
measured with time (Scheme 1). This reaction scheme
has previously been used by other authors to measure
ACS activity in a continuous way [30–32], although
the kinetic behavior shown by this multienzymatic sys-
tem has not been studied.
The mathematical model described here has been sub-
mitted to the Online Cellular Systems Modelling Data-
base and can be accessed at />database/valero/index.html free of charge.
Kinetic analysis
The experimental system being studied here is depicted
in Scheme 1. In this system, ATP is transformed into
AMP in the presence of sufficiently high concentrations
of acetate ions and coenzyme A by the catalytic action
of the enzyme ACS. In the next step, two molecules of
ADP are generated at each turn of the cycle from one
AMP and one ATP catalyzed by AK. The cycle is closed
by the conversion of one molecule of ADP to one mole-
cule of ATP in the presence of a sufficient amount of
PEP in a reaction catalyzed by the enzyme PK. LDH
and NADH are added to the reaction medium to con-
tinuously monitor the reaction. The reaction turns
clockwise in the presence of a sufficient amount of acet-
ate ions, coenzyme A, PEP and NADH. Note that the
system cannot work when the only recycling substrate
present in the reaction medium is AMP, as was experi-
mentally and theoretically checked. Note also that this
is a moiety-conserved ternary cycle [5], as the sum of
[ATP], [ADP] and [AMP] remains constant during the
whole course of the reaction (provided that adenylate
levels bound to the enzymes involved in the cycle may
be considered negligible against free adenine nucleotides
concentration), i.e.
S
T
¼½ATPþ½ADPþ½AMPð1Þ
To study the kinetics of the proposed reaction scheme,
the following two assumptions, which can be easily
implemented in the experimental conditions, were made:
(a) Non-recycling substrates concentrations (acetate
ions, coenzyme A and PEP) are sufficiently high to be
saturating or remain constant during the reaction
time. The same holds for NADH concentration. This
assumption is common practice in enzyme kinetics,
where to derive approximate analytical solutions corres-
ponding either to the transient phase or to the steady
state of an enzyme reaction, it is usually assumed that
the substrate concentration remains approximately con-
stant [21,33–35] and therefore the results obtained are
only valid under these conditions. Taking into account
that nonrecycling substrates and also NADH (the
chromogenic substrate) are continuously consumed in
the reaction medium from the outset of the reaction,
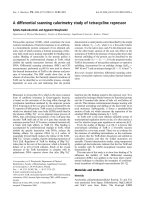
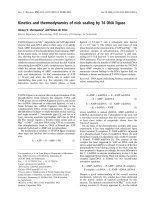
Scheme 1. Schematic representation of the ternary cycle under
investigation interconverting the moiety ATP ⁄ ADP ⁄ AMP catalyzed
by the enzymes ACS, AK and PK. Pyruvate is converted into
L-lac-
tate by the enzyme LDH, thus preventing the reversibility of the AK
reaction and allowing the progress of the reaction to be continu-
ously monitored. Ac
Æ
, acetate ion; CoA, coenzyme A; AcCoA, acetyl
coenzyme A; PP
i
, pyrophosphate; PEP, phosphoenolpyruvate; Pyr,
pyruvate; Lac,
L-lactate.
E. Valero et al. Kinetics of a ternary cycle
FEBS Journal 273 (2006) 3598–3613 ª 2006 The Authors Journal compilation ª 2006 FEBS 3599
the equations obtained here will be less accurate as the
reaction time progresses.
(b) During cycling, the concentration of Pyr is
clearly lower than its Michaelis–Menten constants
towards the enzyme LDH, so that the reaction rate of
the chromogenic step remains of the first order with
respect to its concentration. This assumption is com-
monly used in coupled enzyme assays when the rate of
the chromogenic step is sufficiently high [36,37].
Under these conditions, the evolution of ATP, ADP
and AMP concentrations with time is described by the
following set of three differential equations:
d[ATP]/dt ¼Àm
1
À m
2
þ m
3
ð2Þ
d[AMP]/dt ¼ m
1
À m
2
ð3Þ
d[ADP]/dt ¼ 2m
2
À m
3
ð4Þ
where v
1
, v
2
and v
3
are the velocities of the reactions
catalyzed by ACS, AK and PK, respectively, being:
m
1
¼ V
mapp;1
½ATP=K
mapp;1
þ½ATPð5Þ
and
m
3
¼ V
mapp;3
½ADP=K
mapp;3
þ½ADPð6Þ
where V
mapp,i
and K
mapp,i
(i ¼ 1,3) are apparent con-
stants for a fixed nonrecycling substrates concentra-
tion, i.e. for a fixed concentration of acetate ions and
coenzyme A in the case of ACS, and for a fixed con-
centration of PEP in the case of PK. V
mapp,1
¼ V
m,1
(the maximal velocity of the reaction catalyzed by
ACS at the concentration used) and K
mapp;1
¼ K
ATP
m;1
towards ACS if acetate ions and coenzyme A concen-
trations are saturating, and V
mapp,3
¼ V
m,3
(the max-
imal velocity of the reaction catalyzed by PK at the
concentration used) and K
mapp;3
¼ K
ADP
m;3
towards PK if
PEP concentration is saturating.
The basic kinetic pattern for AK has been reported
to be random Bi Bi [38,39] so, assuming rapid equilib-
rium for all binding and dissociation steps, the equa-
tion corresponding to v
2
will be:
m
2
¼
V
m;2
½ATP½AMP
K þ K
ATP
m;2
½AMPþK
AMP
m;2
½ATPþ½ATP½AMP
ð7Þ
where V
m,2
is the maximal velocity of the reaction cat-
alyzed by AK at the concentration used and K is a
constant value.
The set of differential Eqns (2)–(4) is nonlinear
owing to the expression corresponding to v
2
(Eqn 7),
thus it cannot be analytically solved. This means that
the kinetic behavior of the system must be studied by
means of particular solutions obtained numerically.
However, under certain experimental conditions, the
system will reach a steady state. In this situation, the
concentration of recycling substrates, [ATP]
ss
, [ADP]
ss
and [AMP]
ss
will be a constant value. So, making Eqns
(2)–(4) equal to zero and taking into account condition
(1), the following expressions are obtained for the
concentration of adenine nucleotides attained in the
steady state:
½AMP
ss
¼
V
mapp;1
ðKþK
AMP
m;2
½ATP
ss
Þ
½ATP
ss
ðV
m;2
ÀV
mapp;1
ÞÀV
mapp;1
K
ATP
m;2
þV
m;2
K
mapp;1
ð8Þ
½ADP
ss
¼
2m
1;ss
K
mapp;3
V
mapp;3
À 2m
1;ss
ð9Þ
½ATP
SS
¼ S
T
À½ADP
SS
À½AMP
SS
ð10Þ
being
m
1;ss
¼
V
mapp;1
½ATP
ss
K
mapp;1
þ½ATP
ss
ð11Þ
Note that it is not possible to find AXP (X ¼ T,D,M)
levels attained in the steady state as a function of the
kinetic parameters of the system and initial conditions.
Nevertheless, AMP concentration must be a finite pos-
itive value so that the system can reach a steady state.
From Eqn (8), it is easy to obtain the following condi-
tion to attain a stationary situation:
V
m;2
V
mapp;1
>
½ATP
ss
þ K
ATP
m;2
½ATP
ss
þ K
mapp;1
ð12Þ
This equation indicates that the system only will reach
a steady state when the relationship between the
enzymes AK and ACS is such that condition (12) is
fulfilled. In all other cases, the system will operate until
all the recycling substrate is accumulated as AMP, at
which point the reaction will stop, never reaching the
steady state, as was experimentally and theoretically
checked. In addition, taking into account that [ADP]
ss
cannot take infinite ( S
T
) or negative values by the own
dynamics of the cycle, Eqn (9) indicates that V
mapp,3
must always be greater than 2v
1,ss
, as was checked by
numerical integration.
As the catalytic activity of the cycle has been deter-
mined using LDH as indicator enzyme, the differential
equation which gives the time-dependence of Pyr
concentration will be:
d[Pyr]/dt ¼ m
3
À m
4
ð13Þ
where v
4
is the velocity of the reaction catalyzed by
LDH and, taking into account assumptions (a) and
(b), it is given by:
Kinetics of a ternary cycle E. Valero et al.
3600 FEBS Journal 273 (2006) 3598–3613 ª 2006 The Authors Journal compilation ª 2006 FEBS
m
4
¼ k
4
½Pyrð14Þ
where k
4
is an apparent first-order rate constant, with
k
4
¼ V
mapp,4
⁄ K
mapp,4
, and the same explanation given
above for V
mapp,i
and K
mapp,i
is valid. Making Eqn (13)
equal to zero, the following expression is obtained for
the steady-state rate of the cycle:
V
ss
¼
V
mapp;3
½ADP
ss
K
mapp;3
þ½ADP
ss
ð15Þ
Taking into account that the reaction is followed by
measuring the amount of NADH present in the reac-
tion medium, the differential equation which gives the
NADH consumption is:
d[NADH]=dt ¼Àm
4
ð16Þ
Integrating Eqn (16) with the initial condition
[NADH] ¼ NADH
0,s
(the NADH concentration value
when the steady state is reached) at t ¼ 0 (the start of
the steady state) gives:
½NADH
ss
¼ NADH
0;s
À
V
mapp;3
½ADP
ss
K
mapp;3
þ½ADP
ss
t ð17Þ
If the difference between NADH
0
(the initial concentra-
tion of NADH at the start of the reaction) and NADH
0,s
can be considered negligible, Eqn (17) becomes:
½NADH
ss
¼ NADH
0
À
V
mapp;3
½ADP
ss
K
mapp;3
þ½ADP
ss
t ð18Þ
The error committed by Eqn (18) will be greater as the
rate of the cycle increases. Table 1 shows the relative
errors of NADH values predicted from Eqn (18)
([NADH]) with regard to those obtained from the
numerical integration ([NADH]
NI
) at the times
corresponding to a given depletion of NADH (44%,
approximately the same that has been measured
experimentally) at different S
T
concentrations. It can be
seen that relative error increases as the S
T
-value increa-
ses, and that the errors obtained for the steady-state
rates were very small. It must be noted that final steady-
state concentration values of adenine nucleotides were
independent of their initial concentration values used at
the same S
T
-value (except in the case when [AMP] ¼
S
T
at t ¼ 0, as has been mentioned above). However, at
high initial concentrations of ADP it was necessary to
increase the NADH
0
value to reach the steady state
owing to the coupling of LDH with the enzyme PK. As
these conditions do not allow the experimental monitor-
ing of the reaction progress in the spectrophotometer,
we have preferred the input of S
T
-values as ATP
0
.It
was also checked that Pyr levels attained in the steady
state (data not shown) were clearly below its corres-
ponding Michaelis–Menten constant towards LDH
(30 lm with 100 lm NADH [11]), indicating that the
assumptions made can be considered valid during the
reaction time used in each case.
Particular cases of the model
Case (a): [ATP]
ss
$S
T
In those cases in which ATP levels attained in the
steady state are near to adenylate total concentration
(S
T
-value), it is possible to know in an approximate
Table 1. Relative error of NADH concentration values and steady-state rates predicted from Eqns (18) and (15), respectively, with regard to
the values predicted by numerical integration (Eqns A1–A5).
S
T
(lM)
Time for 44%
depletion of
NADH (s)
[NADH]
NI
(lM)
[NADH]
(lM)
Relative
error (%)
V
ss
a
(lMÆs
)1
)
Relative
error (%)
6.5 3480.5 143.36 141.17 1.53 3.29 · 10
)2
4.67 · 10
)4
15 1327.5 143.37 140.56 1.96 8.69 · 10
)2
1.34 · 10
)3
25 777.5 143.40 140.23 2.21 1.49 · 10
)1
6.10 · 10
)5
35 554.8 143.38 139.91 2.42 2.09 · 10
)1
3.48 · 10
)4
50 392.4 143.37 139.51 2.69 2.97 · 10
)1
3.06 · 10
)3
60 330.3 143.37 139.26 2.86 3.53 · 10
)1
1.87 · 10
)3
100 207.8 143.38 138.36 3.50 5.66 · 10
)1
2.04 · 10
)3
250 99.6 143.36 135.59 5.42 1.21 1.06 · 10
)3
500 64.0 143.42 132.49 7.62 1.93 1.56 · 10
)3
750 52.2 143.43 130.37 9.10 2.40 5.36 · 10
)3
1000 46.4 143.38 128.79 10.17 2.74 5.30 · 10
)3
1500 40.6 143.38 126.75 11.59 3.18 1.94 · 10
)2
a
V
ss
values obtained from Eqn (15) and from numerical integration are the same as the significant numbers shown. The values of the rate
constants used and initial concentration of NADH were as indicated in Fig. 1(A). [ADP]
ss
values for Eqns (15) and (18) were calculated using
Eqn (9), inserting [ATP]
ss
values obtained from numerical integration. S
T
¼ [ATP]
0
.
E. Valero et al. Kinetics of a ternary cycle
FEBS Journal 273 (2006) 3598–3613 ª 2006 The Authors Journal compilation ª 2006 FEBS 3601
way the adenine nucleotides concentrations attained in
the steady state, since Eqns (8) and (11) can be rewrit-
ten as follows:
½AMP
ss
¼
V
mapp;1
ðK þ K
AMP
m;2
S
T
Þ
S
T
ðV
m;2
À V
mapp;1
ÞÀV
mapp;1
K
ATP
m;2
þ V
m;2
K
mapp;1
ð19Þ
In addition,
m
1;ss
¼
V
mapp;1
S
T
K
mapp;1
þ S
T
ð20Þ
Eqn (12) becomes:
V
m;2
V
mapp;1
>
S
T
þ K
ATP
m;2
S
T
þ K
mapp;1
ð21Þ
Eqn (21) allows the experimental determination of lev-
els of the enzymes AK and ACS necessary to reach the
steady state in these cases. It is a very important equa-
tion to be taken into account when measuring ACS
activity in the presence of a sufficient initial amount of
ATP using this cycle as the coupled system [30–32].
Table 2 shows the relative errors of [ATP]
ss
, [ADP]
ss
,
[AMP]
ss
,V
ss
and [NADH]
ss
values predicted from equa-
tions corresponding to this particular case with regard
to those obtained from the numerical integration at dif-
ferent relatively high initial ATP concentrations. It can
be seen that relative errors for [ATP]
ss
, [ADP]
ss
,
[AMP]
ss
and V
ss
decrease as [ATP]
0
increases, indicating
that this approach can be used at relatively high initial
concentrations of ATP, under these conditions.
Case (b): First-order kinetics with respect to adenine
nucleotides concentration
In those cases in which the concentration of the recyc-
ling substrates, [ATP], [ADP] and [AMP], is clearly
lower than their respective Michaelis–Menten con-
stants towards the corresponding enzyme, so that the
reaction rates of the three steps of the cycle remain of
the first order with respect to their respective concen-
trations, Eqns (5) and (6) can be simplified to a rate
law for first-order kinetics:
m
1
¼ k
1
½ATPð22Þ
m
3
¼ k
3
½ADPð23Þ
where k
i
(i ¼ 1,3) are apparent first-order rate con-
stants, with k
i
¼ V
mapp,i
⁄ K
mapp,i
.
Eqn (7) can also be simplified to the following
expression:
m
2
¼ k
2
½ATP½AMPð24Þ
where k
2
is an apparent second-order rate constant,
being:
k
2
¼
V
m;2
K
ð25Þ
if the following condition is fulfilled:
K >> K
ATP
m;2
½AMPþK
AMP
m;2
½ATPþ½ATP½AMPð26Þ
If Eqns (2)–(4) are now made equal to zero, and taking
into account condition (1), the following expressions
are obtained for the concentration of adenine nucleo-
tides attained in the steady state when the cycle oper-
ates under first-order kinetics:
½ATP
ss
¼
k
3
ðk
2
S
T
À k
1
Þ
k
2
ð2k
1
þ k
3
Þ
ð27Þ
½ADP
ss
¼
2k
1
ðk
2
S
T
À k
1
Þ
k
2
ð2k
1
þ k
3
Þ
ð28Þ
½AMP
SS
¼ k
2
=k
1
ð29Þ
These equations clearly indicate that, under these con-
ditions, the cycle will only reach a steady state when
k
1
⁄ k
2
<S
T
. In all other cases, the system will operate
until all the recycling substrate is accumulated as
AMP, at which point the reaction will stop, never
reaching the steady state, as was experimentally and
theoretically checked. Eqn (18) now becomes:
½NADH
SS
¼ NADH
0
À k
3
½ADP
SS
Á t ð30Þ
and
V
SS
¼ k
3
½ADP
SS
ð31Þ
Table 3 shows the relative errors of [ATP]
ss
, [ADP]
ss
,
[AMP]
ss
,V
ss
and [NADH]
ss
values predicted from
equations corresponding to this particular case with
regard to those obtained from the numerical integra-
tion at different relatively low initial ATP concentra-
Table 2. Relative errors of [ATP]
ss
, [ADP]
ss
, [AMP]
ss
,V
ss
and
[NADH]
ss
values predicted from equations corresponding to case
(a) with regard to those obtained from the numerical integration
(Eqns A1–A5) at different relatively high initial ATP concentrations.
Conditions are as indicated in Fig. 1A. [ATP]
0
¼ S
T
.
[ATP]
0
(lM)
Relative error (%)
[ATP]
ss
[ADP]
ss
[AMP]
ss
V
ss
[NADH]
ss
100 8.41 · 10
)2
3.44 4.02 · 10
)2
3.41 6.30
250 4.16 · 10
)2
1.99 4.89 · 10
)2
1.96 7.06
500 1.96 · 10
)2
1.17 4.50 · 10
)2
1.14 8.60
750 1.11 · 10
)2
0.79 3.73 · 10
)2
0.77 9.77
1000 6.88 · 10
)3
0.57 3.04 · 10
)2
0.55 10.66
1500 3.28 · 10
)3
0.35 2.08 · 10
)2
0.34 11.89
Kinetics of a ternary cycle E. Valero et al.
3602 FEBS Journal 273 (2006) 3598–3613 ª 2006 The Authors Journal compilation ª 2006 FEBS
tions. There is good concordance between the analyt-
ical and numerical solutions at relatively low S
T
-val-
ues, because relative errors calculated at the times
corresponding to a consumption of NADH as high
as 44% are relatively small, decreasing at lower
S
T
-values.
Results and Discussion
Time course of the cycle
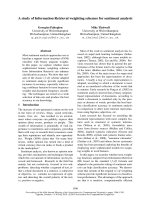
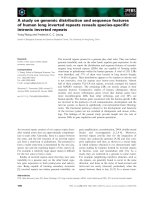
Figure 1A,B shows the time progress curves obtained
by numerical integration of the nonlinear set of differ-
ential equations shown in the Appendix (which takes
into account the depletion of NADH, but not the
depletion of the nonrecycling substrates since their ini-
tial concentrations were higher), using the rate con-
stants set experimentally evaluated (see Experimental
procedures) (Fig. 1A), and a set of rate constants pre-
dicting that all recycling substrate will be accumulated
as AMP in the steady state (Fig. 1B), under initial con-
ditions similar to those used experimentally. It can be
seen that in the first case, nucleotide concentration rea-
ches a specific steady-state value after a small transient
phase, with the disappearance rate of NADH varying
in parallel. In contrast, the system cannot reach a
steady state in the second case (Fig. 1B), as the reac-
tion is stopped after all the recycling adenylate sub-
strate has been accumulated as AMP.
Figure 1C shows a selection of experimental pro-
gress curves obtained at several different initial concen-
trations of ATP under the conditions described in the
Experimental procedures. It can be appreciated that
the system reaches a steady state in which the NADH
consumption rate is constant after a small transient
phase, whose duration diminishes when increasing
ATP initial concentration. Taking into account
assumption (a) in the Kinetic analysis, curves were
registered in all cases up to an absorbance value of 0.9
(143.5 lm NADH), a concentration much higher than
the apparent K
NADH
m
towards LDH ($1 lm with 3 lm
Pyr [11]). An experimental progress curve in which the
system cannot reach the steady state is shown in
Fig. 1D, with an excess of ACS. The inset plots show
the results obtained by HPLC analysis of the reaction
medium before the start of the reaction, in the absence
of ACS (chromatogram a) and at the end of the reac-
tion (chromatogram b). The first chromatogram
reveals the presence of the chemicals added to the reac-
tion medium, PEP, ATP and NADH (retention time
of coenzyme A was longer, so it was eluted in the
cleaning of the column), and the presence of an small
amount of ADP and AMP due to a contamination of
ATP and NADH standard solutions (data not shown).
It can be seen that at the end of the reaction, peaks
corresponding to ATP and ADP have disappeared and
the adenylate substrate has been accumulated as AMP.
All of these results are in agreement with theo-
retically predicted data, supporting the validity of the
proposed model for the multienzymatic system under
study.
Steady-state behavior of the system
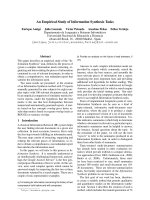
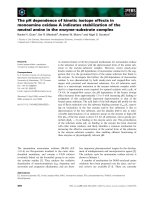
Figure 2A shows the experimental dependence of
steady-state rates of the cycle obtained at different ini-
tial concentrations of ATP. A hyperbolic dependence
can be seen, in agreement with theoretically obtained
data (Fig. 2C). Adenine nucleotides concentrations
attained in the steady state under these experimental
conditions are shown in Fig. 2B. It can be seen that
ATP levels attained in the steady state increased line-
arly when increasing ATP initial concentrations in the
reaction medium (the inset plot). It can also be seen in
this plot that under the experimental conditions used,
at higher initial ATP levels, ATP concentrations
attained in the steady state were near to ATP initial
concentrations, with much lower ADP and AMP lev-
els being attained in the steady state [particular case
(a)]. Dependence of ADP levels attained in the steady
state fit well to an hyperbolic equation, and AMP lev-
els attained in the steady state lightly increased with
ATP initial concentrations, in agreement with data
obtained by computer simulation (Fig. 2D). We also
checked by experiment at low initial concentrations of
ADP as S
T
(in this case the reaction was started by
the addition of ADP; data not shown), that final
steady-state adenine nucleotides concentrations were
the same than values obtained at the same S
T
-value
when S
T
¼ [ATP]
0
.
Table 3. Relative errors of [ATP]
ss
, [ADP]
ss
, [AMP]
ss
,V
ss
and
[NADH]
ss
values predicted from Eqns (27)–(31) with regard to those
obtained from the numerical integration (Eqns A1–A5) at different
relatively low initial ATP concentrations. Conditions as indicated in
Fig. 1A. [ATP]
0
¼ S
T
.
[ATP]
0
(lM)
Relative error (%)
[ATP]
ss
[ADP]
ss
[AMP]
ss
V
ss
[NADH]
ss
6.5 1.49 · 10
)2
0.67 0.11 0.72 2.11
15 2.21 · 10
)2
1.73 0.23 1.86 3.46
25 5.72 · 10
)2
2.98 0.36 3.22 4.81
35 9.03 · 10
)2
4.24 0.48 4.58 6.13
50 1.38 · 10
)1
6.13 0.67 6.62 8.07
60 1.68 · 10
)1
7.38 0.78 7.97 9.36
100 2.83 · 10
)1
12.43 1.22 13.41 14.51
E. Valero et al. Kinetics of a ternary cycle
FEBS Journal 273 (2006) 3598–3613 ª 2006 The Authors Journal compilation ª 2006 FEBS 3603
Figure 3A shows the experimental variation of the
steady-state rate obtained when the cycle is run at dif-
ferent ACS concentrations. We chose a low S
T
-value
for the performance of the next set of experiments, due
to less consumption of the nonrecycling substrates
[assumption (a)] and greater simplicity at the theoret-
ical level [particular case (b)], although the results
obtained at higher S
T
-values would be similar when-
ever the assumptions performed were fulfilled, in
agreement with the equations obtained. It could be
observed that the cycling rate in the steady state
increases as the ACS concentration increases at relat-
ively low levels of this enzyme. However, if we contin-
ued to increase the ACS activity in the reaction
AB
D
C
Fig. 1. (A) Simulated progress curves corresponding to the species involved in the reaction scheme shown in Scheme 1. The values of the
rate constants used were: K
m app,1
¼ 7.0 · 10
2
lM, K
m app,3
¼ 2.6 · 10
2
lM, K ¼ 7.1 · 10
4
lM
2
, K
ATP
m;2
¼ 2.5 · 10
1
lM, K
AMP
m;2
¼ 1.1 · 10
2
lM, V
mapp,1
¼ 2.3 lMÆs
)1
, V
m,2
¼ 1.7 · 10
2
lMÆs
)1
, V
mapp,3
¼ 6.5 · 10
1
lMÆs
)1
and k
0
4
¼ 5 lM
)1
Æs
)1
. The initial concentrations values used
were: [NADH]
0
¼ 256 lM and [ATP]
0
¼ 16.3 lM. (B) Simulated progress curves obtained using V
mapp,1
¼ 3.3 · 10
1
lMÆs
)1
. The remaining
conditions are as described in Fig. 1A. (C) Experimental progress curves of b-NADH consumption obtained for the ternary cycle under study.
Conditions are as indicated in the Experimental procedures. The following initial concentrations of ATP were used for curves 1–8, respect-
ively: 16.3, 26.1, 32.6, 39.1, 65.3, 200, 500 l
M and 1 mM. (D) Experimental progress curve of NADH consumption obtained using a final con-
centration of ACS ¼ 0.34 units and [ATP]
0
¼ 16.3 lM. The rest of conditions are as described in Fig. 1C. Insets: Chromatogram a, the
reaction mixture was injected before the start of the reaction, in the absence of ACS; chromatogram b, the reaction mixture was injected at
the end of the reaction.
Kinetics of a ternary cycle E. Valero et al.
3604 FEBS Journal 273 (2006) 3598–3613 ª 2006 The Authors Journal compilation ª 2006 FEBS
medium, the steady-state rate of the cyclic reaction
would reach a maximum, after which it would decrease
until it reached the point at which NADH consump-
tion (and therefore the cyclic reaction) was abolished
at relatively high ACS concentrations, in agreement
with condition (12). This result was due to an excessive
consumption of ATP at high ACS concentrations,
which cannot be recovered by PK because there is not
enough ATP for the enzyme AK.
Adenine nucleotide concentrations attained in the
steady state as a function of ACS concentration levels
in the reaction medium are shown in Fig. 3(B). It can
be seen that as ACS activity was increased in the reac-
tion medium, the levels of ATP attained in the steady
A
B
CD
Fig. 2. (A) Experimental steady-state rates obtained at different ATP initial concentrations in the reaction medium. Conditions as indicated in
Experimental procedures. (B) Steady-state ATP (d), ADP (s) and AMP (.) concentrations as a function of ATP initial concentration in the
reaction medium. Experimental conditions are as described in Fig. 2A. The points represent experimental data (they are the mean of three
assays), the error bars represent SD and the lines correspond to regression analysis plot. (C) Theoretical steady-state rates obtained by
numerical integration of differential Eqns (A1)–(A5) in the Appendix at different ATP initial concentration values. Conditions as indicated in
Fig. 1A. (D) Steady-state ATP (d), ADP (s) and AMP (.) concentrations as a function of ATP initial concentration values. Conditions are as
described in Fig. 2C.
E. Valero et al. Kinetics of a ternary cycle
FEBS Journal 273 (2006) 3598–3613 ª 2006 The Authors Journal compilation ª 2006 FEBS 3605
state decreased to reach a near zero-value at relatively
high ACS levels, when the system is unable to reach
the steady state. ADP levels attained at the steady
state show an evolution parallel to the steady-state
rates, with a maximum reached when the steady-state
rate was maximum, and decreasing thereafter. This
result is in agreement with Eqn (15), which predicts
that steady-state rates are governed by the ADP con-
centrations attained in the steady state. On the other
hand, AMP concentrations in the steady state increase
linearly with ACS activity until they approach the S
T
-
value, i.e. all of the recycling substrate has been accu-
mulated as AMP, at which point the cycle stops as
there is no more ATP available for the enzyme AK.
AB
D
C
Fig. 3. (A) Experimental steady-state rates obtained at different ACS concentrations in the reaction medium. Conditions as indicated in
Experimental procedures, with [ATP]
0
¼ 16.3 lM. (B) Steady-state ATP (d), ADP (s) and AMP (.) concentrations as a function of ACS con-
centration in the reaction medium. Experimental conditions are as described in Fig. 3A. The points represent experimental data (they are the
mean of three assays) and the error bars represent SD. The straight line through [AMP]
ss
points corresponds to data obtained by linear
regression analysis. (C) Theoretical steady-state rates obtained from Eqn (31) at different k
1
-values. Conditions are as indicated in Fig. 1A.
(D) Steady-state ATP (d), ADP (s) and AMP (.) concentrations as a function o f k
1
-values, obtained from Eqns (27)–(29). Conditions are as
described in Fig. 3C.
Kinetics of a ternary cycle E. Valero et al.
3606 FEBS Journal 273 (2006) 3598–3613 ª 2006 The Authors Journal compilation ª 2006 FEBS
This result is in agreement with Eqn (29), which indi-
cates that AMP concentrations attained in the steady
state are directly proportional to the concentration of
ACS in the reaction medium.
Figure 3C shows the theoretical steady-state rates
obtained when varying the k
1
-value. As can be seen,
the steady-state rates were correctly predicted by the
model, indicating that this is not an effect lying out-
side the cycle. It is also possible to observe that when
the ratio k
1
⁄ k
2
¼ S
T
-value (the last point in the plot),
the system cannot reach the steady state and the reac-
tion stops, which is in agreement with Eqn (29). This
means that there is a threshold value of k
1
(or
V
mapp,1
), above which the cycle cannot attain a steady
state, this value being k
1
¼ k
2
S
T
(when the cycle
operates under first-order kinetics). Figure 3D shows
the theoretical values of the steady-state concentra-
tions of the three interconverted substrates (Eqns
(27)–(29)). The dependences obtained were parallel to
those obtained experimentally.
Figure 4A shows the steady-state rates obtained
experimentally when varying the AK concentration
in the reaction medium. In this case, there was a
threshold level of AK activity under which the sys-
tem could not reach the steady state; this value was
k
2
¼ k
1
⁄ S
T
, in agreement with Eqns (27)–(29). At
higher AK concentrations the steady-state rates
increased to reach a constant value. ATP, ADP and
AMP concentrations attained in the steady state are
shown in Fig. 4B. It can be observed that when AK
activity is not sufficient to reach a steady state, the
recycling substrates accumulate as AMP, and when
this occurs, the cyclic reaction is stopped (mathemat-
ically this would be [AMP] ¼ S
T
when t ޴). At
higher levels of AK activity, the AMP concentrations
attained in the steady state decreased with increasing
k
2
(or V
m,2
), while ATP and ADP final concentra-
tions increased until they reached a near constant
value, varying parallel to the steady-state rate, in
agreement with Eqn (31). It was also experimentally
(data not shown) and theoretically checked (Fig. 4C)
that an increase in ACS activity in the reaction
medium leads to a higher level of AK activity
(k
2
-value) being necessary for the system to reach a
steady state. Figure 4D shows the theoretical values
of the steady-state concentrations of the three inter-
converted substrates. It can be seen that dependences
predicted by the model were very similar to those
obtained experimentally.
Figure 5A shows the steady-state rates obtained
experimentally when varying the PK concentration in
the reaction medium. It can be seen that the response
of the system was different, since in this case the
reaction reached a steady state even at low levels of
PK activity. At very low levels of PK activity, this step
becomes the limiting factor of the cycle, and ADP is
accumulated in the reaction medium, although the
cycle does not stop in this case, in agreement with Eqn
(9). Steady-state rates increased as PK activity was
increased until they reached a constant level, both
experimentally (Fig. 5A) and theoretically (Fig. 5C).
Figure 5B,D shows the steady-state concentrations of
the three recycling substrates obtained both experi-
mentally (Fig. 5B) and theoretically (Fig. 5D) as a
function of PK activity in the reaction medium and
k
3
-value, respectively. As can be observed, AMP final
concentration was independent of k
3
, which agrees
with Eqn (29), whereas ATP and ADP final concentra-
tions increased and decreased, respectively, until they
reached constant values.
Adenylate energy charge
Adenine nucleotides constitute a well known group of
metabolites participating in a moiety-conserved cycle
in the intermediary metabolism. The role of these com-
pounds in regulating metabolism has long been recog-
nized and referred to as the adenylate energy charge
(AEC) in the cell [40], which was defined through the
following dimensionless parameter, varying between 0
and 1:
AEC ¼
½ATPþ0:5½ADP
½ATPþ½ADPþ½AMP
ð32Þ
The AEC could be visualized in our model, as the
three adenine nucleotides are involved in it. Thus,
inserting Eqns (27)–(29) [we have used equations cor-
responding to case (b) for greater simplicity; the AEC
value for case (a) is $1] into Eqn (32), the following
expression is obtained for the AEC when the cyclic
system being studied operates under steady-state condi-
tions and under first-order kinetics:
AEC ¼
ðk
1
þ k
3
Þðk
2
S
T
À k
1
Þ
k
2
S
T
ð2k
1
þ k
3
Þ
ð33Þ
This equation also predicts that k
2
S
T
> k
1
so that the
system can attain a steady state. It is not possible to
draw a plot of Eqn (33) as a function of k
1
, k
2
and k
3
to illustrate the dependence of AEC upon them. How-
ever, for a fixed AEC value and total recycling sub-
strate concentration, S
T
, the following expression is
obtained, for example, for k
2
:
k
2
¼
k
2
1
þ k
1
k
3
S
T
½k
1
þ k
3
À AECð2k
1
þ k
3
Þ
ð34Þ
E. Valero et al. Kinetics of a ternary cycle
FEBS Journal 273 (2006) 3598–3613 ª 2006 The Authors Journal compilation ª 2006 FEBS 3607
This function leads to negative, infinite or positive
(the only situation with biological meaning) k
2
-values
when the AEC value is higher, equal or smaller,
respectively, than the relationship k
1
+k
3
⁄ (2k
1
+k
3
).
This indicates that the AEC values allowed with given
k
1
- and k
3
-values are those that fulfill the following
condition:
AEC <
k
1
þ k
3
2k
1
þ k
3
ð35Þ
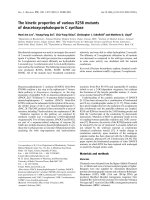
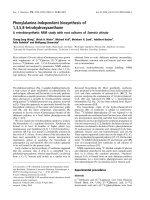
Figure 6 shows a three-dimensional plot of Eqn (34)
for a fixed S
T
-value and two different values of AEC,
0.8 (a) and 0.9 (b), which are normal values in a num-
ber of tissues and organisms [41]. It can be seen that
A
B
D
C
a
b
c
Fig. 4. (A) Experimental steady-state rates obtained at different AK concentrations in the reaction medium. Conditions are as indicated in the
Experimental procedures, with [ATP]
0
¼ 16.3 lM. (B) Steady-state ATP (d), ADP (s) and AMP (.) concentrations as a function of AK con-
centration in the reaction medium. Experimental conditions are as described in Fig. 4A. The points represent experimental data (they are the
mean of three assays) and the error bars represent SD. (C) Theoretical steady-state rates obtained from Eqn (31) at different k
2
-values. The
values used for V
mapp,1
were as follows: curve a, 2.3, curve b, 4.7 and curve c, 10.5 lMÆs
)1
. The rest of the conditions are as indicated in
Fig. 1A. (D) Steady-state ATP (d), ADP (s) and AMP (.) concentrations as a function of k
2
-values, obtained from Eqns (27)–(29). Conditions
are as described in Fig. 4C, with V
mapp,1
¼ 2.3 lMÆs
)1
.
Kinetics of a ternary cycle E. Valero et al.
3608 FEBS Journal 273 (2006) 3598–3613 ª 2006 The Authors Journal compilation ª 2006 FEBS
there are pairs of k
1
and k
3
values (relatively small val-
ues of k
3
) that are not allowed by fixed AEC values,
leading to negative or infinite k
2
-values.The k
3
⁄ k
1
rela-
tionship enabled for a fixed AEC value can easily be
derived from Eqn (35), with the following result:
k
3
k
1
>
2AEC À 1
1 À AEC
ð36Þ
According to Eqn (36), when AEC 6 0.5, the relation-
ship between the rates of formation and destruction of
ATP (k
3
and k
1
) can take any value; however, for
AEC > 0.5, not all values of k
1
and k
3
are allowed, as
can be deduced from Eqn (35). It is obvious that
a minimum level of ATP regeneration with respect
to ATP consumption is necessary to keep a high
AEC value, i.e. the coupling between ATP-yielding and
BA
D
C
Fig. 5. (A) Experimental steady-state rates obtained at different PK concentrations in the reaction medium. Conditions are as indicated in the
Experimental procedures, with [ATP]
0
¼ 16.3 lM. (B) Steady-state ATP (d), ADP (s ) and AMP (.) concentrations as a function of PK con-
centration in the reaction medium. Experimental conditions are as described in Fig. 5A. The points represent experimental data (they are the
mean of three assays) and the error bars represent SD. The straight line through [AMP]
ss
points corresponds to data obtained by linear
regression analysis. (C) Theoretical steady-state rates obtained from Eqn (31) at different k
3
-values. Conditions as indicated in Fig. 1A. (D)
Steady-state ATP (d), ADP (s) and AMP (.) concentrations as a function of k
3
-values, obtained from Eqns (27)–(29). Conditions are as des-
cribed in Fig. 5C.
E. Valero et al. Kinetics of a ternary cycle
FEBS Journal 273 (2006) 3598–3613 ª 2006 The Authors Journal compilation ª 2006 FEBS 3609
ATP-demanding processes is controlled by the AEC
value.
Interconverting cycles are increasingly referred to as
regulating structures of the metabolism. In the present
paper, we have illustrated the particular kinetic behav-
ior of a closed (moiety-conserved ) ternary cycle
between ATP, ADP and AMP. It has been shown that
the ratio between the enzymatic activities involved in
the cycle cannot take any value, but some conditions
must be fulfilled to prevent accumulation of adenosine
in the form of AMP. The results obtained herein may
contribute to our knowledge of the behavior of cycles
in metabolic regulation.
Experimental procedures
Reagents
b-NADH, coenzyme A, AMP, ADP, ATP, sodium PEP,
imidazole, PK (448 UÆmg
)1
) from rabbit muscle, AK
(2020 UÆmg
)1
) from rabbit muscle, LDH (1120 UÆmg
)1
)
from rabbit muscle, ACS (8.5 UÆmg
)1
) from baker’s yeast
(Saccharomyces cerevisiae) and BSA were obtained from
Sigma (Madrid, Spain). Stock solutions of enzymes (207.0,
210.1, 526.4 and 1.15 UÆmL
)1
, respectively) were prepared
daily in 50 mm imidazole ⁄ HCl acid buffer (pH 7.6) contain-
ing 2 mgÆmL
)1
bovine serum albumin. All other reagents
were of analytical grade and were used without further
purification. All solutions were prepared in ultrapure deion-
ized nonpyrogenic water (Milli Q; Millipore, Madrid,
Spain).
Methods
Spectrophotometric readings were obtained on a Uvikon
940 spectrophotometer from Kontron Instruments (Zu
¨
rich,
Switzerland). The time course of the reaction was followed
by measuring the disappearance of b-NADH at 340 nm
(e
340
¼ 6270 m
)1
Æcm
)1
)at37°C. The temperature was
maintained using a Hetofrig Selecta (Barcelona, Spain) cir-
culating bath with a heater ⁄ cooler and checked using a
Cole-Parmer (Vernon Hill, IL, USA) digital thermometer
with a precision of ± 0.1 °C.
Individual enzyme activity measurements
The initial activity dependence of PK as a function of
ADP was studied by using the Pyr assay coupled with
the enzyme LDH. Measurements were performed in the
presence of 256 lm NADH, 1.6 mm PEP, 75 mm KCl,
2mm MgCl
2
,10mm sodium acetate, 0.05–1.1 mm ADP
and 5.3 U of LDH, in 50 mm imidazole ⁄ HCl buffer
(pH 7.6). The reaction was started by the addition of
0.03 U of PK, the final volume being 0.5 mL. Rate data
versus initial ADP concentration thus obtained were fitted
by nonlinear regression to the Michaelis–Menten equa-
tion, providing the corresponding values of K
mapp,3
(0.26 m m) and V
mapp,3
.
The initial activity dependence of AK as a function of
ATP and AMP was studied by using the PK- and LDH-
coupled assay. Measurements were performed in the pres-
ence of 256 lm NADH, 1.6 mm PEP, 75 mm KCl, 2 mm
MgCl
2
,10mm sodium acetate, 0.09–1.53 mm ATP, 0.11–
1.28 mm AMP and 5.3 U of LDH, in 50 mm imidaz-
ole ⁄ HCl buffer (pH 7.6). The reaction was started by the
addition of 4.1 U of PK and 0.04 U of AK (premixed), the
final volume being 0.5 mL. The rate data versus initial sub-
strate concentrations thus obtained were fitted by nonlinear
regression to the Michaelis–Menten equation, obtaining
from the secondary replots of these data the corresponding
values of K
ATP
m;2
(0.025 mm), K
AMP
m;2
(0.11 m m) and V
m,2
. The
fulfillment of condition (26) was also checked at low ATP
and AMP levels, giving a value for K of 0.071 mm
2
.
The initial activity dependence of ACS as a function of
ATP was studied by using the AK-, PK- and LDH-coupled
assay [30–32]. Measurements were performed in the pres-
ence of 256 lm NADH, 1.6 mm PEP, 75 mm KCl, 2 mm
MgCl
2
,10mm sodium acetate, 0.6 mm coenzyme A, 0.2–
1.65 mm ATP, 3.1 U of PK, 3.1 U of AK, 5.3 U of LDH
and 3.8 · 10
)3
U of ACS, in 50 mm imidazole ⁄ HCl buffer
(pH 7.6). The reaction was started by the addition of ATP,
the final volume being 0.5 mL. Rate data versus initial
ATP concentration thus obtained were fitted by nonlinear
regression to the Michaelis–Menten equation, obtaining the
corresponding values of K
mapp,1
(0.75 mm) and V
mapp,1
, tak-
ing into account that two moles of NADH are oxidized per
mole of substrate.
Fig. 6. Three-dimensional plot of k
2
against k
1
and k
3
values (Eqn
34) for a fixed S
T
-value (16.3 lM) and the following AEC values: (a)
0.8 and (b) 0.9.
Kinetics of a ternary cycle E. Valero et al.
3610 FEBS Journal 273 (2006) 3598–3613 ª 2006 The Authors Journal compilation ª 2006 FEBS
To obtain rate data, the experimental progress curves
obtained in each case were fitted by linear regression to a
first-order polynomial equation of the reaction time using
the sigmaplot scientific graphing system version 8.02
(2002, SPSS Inc., Chicago, IL, USA).
Operation of the complete cycle
The kinetic studies dealing with the complete ternary cycle
were carried out in a reaction medium containing 256 lm
NADH, 1.6 mm PEP, 75 mm KCl, 2 mm MgCl
2
,10mm
sodium acetate, 0.6 mm coenzyme A, ATP and ⁄ or ADP at
the indicated concentrations, 3.1 U of PK, 3.1 U of AK,
5.3 U of LDH and 0.023 U of ACS in 50 mm imidaz-
ole ⁄ HCl buffer (pH 7.6). The reaction was started by the
addition of ACS; the final volume was 0.5 mL. Steady-state
rate data were obtained by linear regression fitting to a
first-order polynomial equation of the reaction time of the
linear portion of experimental progress curves, using the
software mentioned above.
HPLC nucleotides determination
The nucleotides concentrations attained in the steady state
when operating the complete cycle were analyzed by
reversed-phase HPLC analysis. The samples were heated
for 10 min in a near-boiling water bath at 95 °C to denatu-
ralize the proteins and then centrifuged for 5 min at 6600 g
(Biofuge fresco, Heraeus). The supernatant was then filtered
through a 0.45-lm filter prior to injection. The HPLC
apparatus was from Agilent Technologies (Waldbronn,
Germany) and included a series 1100 quaternary pump and
vacuum degasser and was equipped with an Agilent series
1100 variable-wavelength detector. The HPLC column was
a reversed-phase 5 lm Discovery C
18
(15 · 4.6 mm) from
Supelco (Madrid, Spain). The nucleotides were eluted using
isocratic conditions; the mobile phase was potassium phos-
phate buffer 25 mm (pH 6.8). This solution was filtered
through a 0.22-lm filter. Elution conditions were as fol-
lows: injection volume, 20 lL; flow rate, 1.0 mLÆmin
)1
;
oven temperature, 30 °C. The elution was monitored at
259 nm. Once adenine nucleotides were detected in each
run, the column was washed with methanol for 10 min to
elute the rest of the metabolites in the reaction medium,
and then re-equilibrated with the mobile phase under use.
Calibration straight lines were performed for ATP, ADP
and AMP (2–50 l m and 50–1500 lm) by duplicate injection
of the individual nucleotides and mixtures of all three. Nuc-
leotide concentrations in the solutions were checked by spec-
trophotometer at 259 nm, using e ¼ 15.4 · 10
3
m
)1
Æcm
)1
.
Standard mixtures of the components of the reaction
medium (in the absence of ACS) were also injected to check
both the resolution and the retention times. An Agilent
ChemStation A.08.04 revision was used to integrate peak
areas.
Computer simulation
Simulated progress curves were obtained by numerical solu-
tion of the nonlinear set of differential Eqns (A1)–(A5) des-
cribed in the Appendix, which takes into account the
depletion of NADH, using the experimentally obtained val-
ues of the rate constants and the same initial concentration
values. Numerical integration was performed by means of
the fourth- and fifth-order Runge–Kutta–Fehlberg formula
[42], using the ode45 function from matlab software
version 6.5 (). The data thus
obtained were plotted using the sigmaplot scientific graph-
ing system for windows version 8.02 ().
Acknowledgements
The work described in this paper was supported by a
grant from the Direccio
´
n General de Investigacio
´
ndel
Ministerio de Ciencia y Tecnologı
´
a (Spain), Project num-
ber BQU2002-01960, and by a grant from the Consejerı
´
a
de Educacio
´
n y Ciencia de la Junta de Comunidades de
Castilla-La Mancha, Project number PAI-05–036.
References
1 Atkinson DE (1977) Cellular Energy Metabolism and its
Regulation. Academic Press, New York, NY.
2 Reich J & Sel’kov EE (1981) Energy Metabolism of the
Cell: a Theoretical Treatise. Academic Press, New York,
NY.
3 Newsholme EA & Crabtree B (1976) Substrate cycles in
metabolic regulation and in heat generation. Biochem
Soc Symp 41, 61–109.
4 Katz J & Rognstad R (1978) Futile cycling in glucose
metabolism. Trends Biochem Sci 8, 171–174.
5 Hofmeyr JS, Kacser H & Merwe KJ (1986) Metabolic
control analysis of moiety-conserved cycles. Eur J Bio-
chem 155, 631–641.
6 Rhee SG, Park R, Chock PB & Stadtman ER (1978)
Allosteric regulation of monocyclic interconvertible
enzyme cascade systems: use of Escherichia coli gluta-
mine synthetase as an experimental model. Proc Natl
Acad Sci USA 75, 3138–3142.
7 LaPorte DC & Koshland DE Jr (1983) Phosphorylation
of isocitrate dehydrogenase as a demonstration of
enhanced sensitivity in covalent regulation. Nature 305,
286–290.
8 Meinke MH, Bishop JS & Edstrom RD (1986) Zero-
order ultrasensitivity in the regulation of glycogen phos-
phorylase. Proc Natl Acad Sci USA 83, 2865–2868.
9 Cimino A & Hervagault JF (1987) Experimental evidence
for a zero-order ultrasensitivity in a simple substrate
cycle. Biochem Biophys Res Commun 149, 615–620.
10 Passonneau JV & Lowry OH (1978) Determination of
the substrate concentration of metabolites. In Principles
E. Valero et al. Kinetics of a ternary cycle
FEBS Journal 273 (2006) 3598–3613 ª 2006 The Authors Journal compilation ª 2006 FEBS 3611
of Enzymatic Analysis (Bergmeyer HU, ed.), pp. 83–87.
Verlag Chemie, Weinheim.
11 Passonneau JV & Lowry OH (1993) Enzymatic Analysis.
A Practical Guide (Passonneau & Lowry, OH, eds).
Humana Press, Totowa, NJ.
12 Harper JR & Orengo A (1981) The preparation of an
immunoglobulin-amyloglucosidase conjugate and its
quantitation by an enzyme-cycling assay. Anal Biochem
113, 51–57.
13 Johannsson A, Ellis DH, Bates DL, Plumb AM & Stan-
ley CJ (1986) Enzyme amplification for immunoassays:
detection limit of one hundredth of an attomole.
J Immunol Methods 87 , 7–11.
14 Inouye K, Ueno I, Yokoyama S & Sakaki T (2002) Deve-
lopment of a synchronous enzyme-reaction for a highly
sensitive enzyme immunoassay. J Biochem 131, 97–105.
15 Valero E, Varo
´
n R & Garcı
´
a-Carmona F (1995) Kinetic
study of an enzymic cycling system coupled to an enzy-
mic step: determination of alkaline phosphatase activity.
Biochem J 309, 181–185.
16 Valero E, Varo
´
n R & Garcı
´
a-Carmona F (1997) Mathe-
matical model for the determination of an enzyme activ-
ity based on enzymatic amplification by substrate
cycling. Anal Chim Acta 346 , 215–221.
17 Valero E & Garcı
´
a-Carmona F (1998) A continuous
spectrophotometric method based on enzymatic cycling
for determining 1-glutamate. Anal Biochem 259, 265–271.
18 Kucera I & Kunak M (2003) Steady-state kinetic analysis
of substrate pair cycling between two enzymes: applica-
tion to a mediated electron transport between the cyto-
plasmic membrane and the periplasmic nitrite reductase
of Paracoccus denitrificans. Biophys Chem 104, 617–622.
19 Ueda S, Oda M, Imamura S & Ohnishi M (2004)
Kinetic study of the enzymatic cycling reaction con-
ducted with 3a-hydroxyesteroid dehydrogenase in the
presence of excessive thio-NAD
+
and NADH. Anal
Biochem 332, 84–89.
20 Valero E & Garcı
´
a-Carmona F (1996) Optimizing enzy-
matic cycling assays: spectrophotometric determination
of low levels of pyruvate and 1-lactate. Anal Biochem
239, 47–52.
21 Valero E, Varo
´
n R & Garcı
´
a-Carmona F (2000)
Kinetics of a self-amplifying substrate cycle: ADP-ATP
cycling assay. Biochem J 350, 237–243.
22 Valero E, Varo
´
n R & Garcı
´
a-Carmona F (2004) Kinetic
analysis of a model for double substrate cycling: highly
amplified ADP (and ⁄ or ATP) quantification. Biophys J
86, 3598–3606.
23 Lowenstein J & Tornheim K (1971) Ammonia produc-
tion in muscle: the purine nucleotide cycle. Science 171,
397–400.
24 Lowenstein J (1990) The purine nucleotide cycle revis-
ited. Int J Sports Med 11, S37–S46.
25 Zammit VA (1981) Intra-hepatic regulation of ketogene-
sis. Trends Biochem Sci 6, 46–49.
26 Fassy F & Hervagault JF (1994) An approach to the
in vitro study of the UTP ⁄ UDPglucose ⁄ UDP
moiety-conserved cycle. Biochim Biophys Acta 1200,
297–306.
27 Stein RB & Blum JJ (1978) On the analysis of futile
cycles in metabolism. J Theor Biol 72, 487–522.
28 Canela EI, Franco R & Cascante M (1989) Interdepen-
dence between cooperativity and control coefficients.
Biosystems 23, 7–14.
29 Fassy F, Renard C & Hervagault JF (1992) Steady-state
properties of a model ternary substrate cycle: theoretical
predictions. Biosystems 26, 159–169.
30 Frenkel EP & Kitchens RL (1977) Purification and
properties of acetyl coenzyme A synthetase from
Baker’s yeast. J Biol Chem 252, 504–507.
31 Patel SS & Walt DR (1987) Substrate specificity of
acetyl coenzyme A synthetase. J Biol Chem 262, 7132–
7134.
32 Jetten MSM, Stams AJM & Zehnder AJB (1989) Isola-
tion and characterization of acetyl-coenzyme A synthe-
tase from Methanothrix soehngenii. J Bacteriol 171,
5430–5435.
33 Darvey IG (1977) Transient phase kinetics of enzyme
reactions where more than one species of enzyme is pre-
sent at the start of the reaction. J Theor Biol 65, 465–
478.
34 Fersht A (2000) Structure and Mechanism in Protein Sci-
ence: a Guide to Enzyme Catalysis and Protein Folding,
3rd edn. W.H. Freeman, New York, NY.
35 Fuentes ME, Varo
´
n R, Garcı
´
a-Moreno M & Valero E
(2005) Kinetics of autocatalytic zymogen activation
measured by a coupled reaction: pepsinogen autoactiva-
tion. Biol Chem 386, 689–698.
36 Easterby JS (1973) Coupled enzyme assays: a general
expression for the transient. Biochim Biophys Acta 293,
552–558.
37 Garcı
´
a-Carmona F, Garcı
´
a-Ca
´
novas F & Lozano JA
(1981) Optimizing enzyme assays with one or two cou-
pling enzymes. Anal Biochem 113, 286–291.
38 Rhoads DG & Lowenstein JM (1968) Initial velocity
and equilibrium kinetics of myokinase. J Biol Chem
243, 3963–3972.
39 Sheng XR, Li X & Pan XM (1999) An iso-random Bi
Bi mechanism for adenylate kinase. J Biol Chem 274,
22238–22242.
40 Atkinson DE (1968) The energy charge of the adenylate
pool as a regulatory parameter: interaction with feed-
back modifiers. Biochemistry 7, 4030–4034.
41 Goldbeter A (1974) Modulation of the adenylate energy
charge by sustained metabolic oscillations. FEBS Lett
43, 327–330.
42 Fehlberg E (1970) Klassische Runge-Kutta Formeln
vierter und niedrigerer Ordnung mit Schrittweiten-Kont-
rolle und ihre Anwendung auf Wa
¨
rmeleitungs-probleme.
Computing 6, 61–71.
Kinetics of a ternary cycle E. Valero et al.
3612 FEBS Journal 273 (2006) 3598–3613 ª 2006 The Authors Journal compilation ª 2006 FEBS
Appendix
The system of differential equations corresponding to
the cyclic mechanism shown in Scheme 1, taking into
account the depletion of NADH, is as follows:
d½ATP
dt
¼À
V
mapp;1
½ATP
K
mapp;1
þ½ATP
À
V
m;2
½ATP½AMP
K þ K
ATP
m2
½AMPþK
AMP
m2
½ATPþ½ATP½AMP
þ
V
mapp;3
½ADP
K
mapp;3
þ½ADP
ðA1Þ
d½ADP
dt
¼
2V
m;2
½ATP½AMP
K þ K
ATP
m2
½AMPþK
AMP
m2
½ATPþ½ATP½AMP
À
V
mapp;3
½ADP
K
mapp;3
þ½ADP
ðA2Þ
d½AMP
dt
¼
V
mapp;1
½ATP
K
mapp;1
þ½ATP
À
V
m;2
½ATP½AMP
K þ K
ATP
m2
½AMPþK
AMP
m2
½ATPþ½ATP½AMP
ðA3Þ
d½ Pyr
dt
¼
V
mapp;3
½ADP
K
mapp;3
þ½ADP
À k
0
4
½Pyr½NADHðA4Þ
d½NADH
dt
¼Àk
0
4
½Pyr½NADHðA5Þ
where k
0
4
½NADH corresponds to k
4
in the text.
E. Valero et al. Kinetics of a ternary cycle
FEBS Journal 273 (2006) 3598–3613 ª 2006 The Authors Journal compilation ª 2006 FEBS 3613