Numerical and physical modelling of the wave effect on the port and coastal protection structures
Bạn đang xem bản rút gọn của tài liệu. Xem và tải ngay bản đầy đủ của tài liệu tại đây (537.23 KB, 7 trang )
Tuyển tập Hội nghị Khoa học thường niên năm 2018. ISBN: 978-604-82-2548-3
NUMERICAL AND PHYSICAL MODELLING OF THE WAVE
EFFECT ON THE PORT AND COASTAL PROTECTION
STRUCTURES
IzmailKantarzhi,
Dr.Sc.(Eng.), Prof.
Moscow State National Research University of Civil Engineering (MSUCE),
Moscow, Russia
Tel. +7 903 533 7830
Email:
ABSTRACT
Waves parameters in water area of a projected port are normally obtained by the phys ical and
numerical modeling.The phys ical modeling allows to define the structural details of the port’s
facilities and provides with the information for an appropriate numerical model s election.The
nearshore hydrodynamic fields are produced by the nonlinear interactions of the shoaling waves of
different time scales and currents . To simulate the wind wave propagated to the coasts , wave
generated nearshore currents , nonlinear-dispersive wave transformation and wave diffraction in
interaction with coastal and port structure, sediment transport and coastal erosion, the chains of the
models should be used. The open source models WaveWatch III and SWAN has been used to
simulate wave statistics of the dedicated areas of the studied coastal areas in high resolution to
calculate the statistical parameters of the extreme wave approaching coastal zone construction in
accordance with coastal engineering standards .
The problems this approach creates are shown in the cas e study of the projected port in Vos tok
(East) Bay, Sea of Japan. Experimental study of waves propagation in the port water area were
carried out in the wave basin. The port area was reproduced at the scale of 1:50, and the modeling
was conducted under the Froude number similarity. Experimental results are provided for the study of
the wave propagation in the port model from the effects of the waves of 5% of exceedance.To
confirm the results of the laboratory experiments four relevant mathematical models were us ed, one
of them is the ARTEMIS model which is based on gentle slopes equations. Heights of numerically
modeled waves in the control points were compared with the waves meas ured by the sensors-wave
gauges. Calculated values at the control point and minimum and maximum values in a circular
neighborhood with the radius of 30 m (1/4 of the average wavelength of 120 m) were compared with
the results of the experiments .The propos ed approach allows to compare the results of physical
modeling with the results of numerical modeling and select the appropriate numerical model based on
the results of the comparison.
KEWORDS: numerical modelling, coastal engineering, chain of models, portarea waves,
experiments and numerical modelling, method of comparison, standing waves
The technology of modeling and
verification of models of waves and currents
Verification of the developed mathematical is presented. Brief descriptions of SWAN,
model with the help of the available data, as ARTEMIS and COASTOX models are given.
well as the data obtained by special
Further detailed description of the
measurements, allows to determine the structure of the interactive model of wind
adequacy of the developed model of waves waves and currents, information flows
and currents.
between its three calculation modules based
1. INTRODUCTION
xvii
Tuyển tập Hội nghị Khoa học thường niên năm 2018. ISBN: 978-604-82-2548-3
on models SWAN, ARTEMIS and
COASTOX, types of input information,
specified interactive mode.
Projected marine terminal is to be
designed for shipping of finished/refined
product and for receiving of crude oil.
Mooring facilities are located in the Vostok
Bay, Sea of Japan. The Vostok Bay is a part
of the southeast side of the Peter the Great
Bay and intrudes to the land for 7.3 km
approximately. The distance between capes is
about 5.8 km and the area of the water table
is 38 sq. km with the length of the shoreline
of about 29 km. The open part of the Vostok
Bay faces the south-southwest direction.
The moorings disposition inside of the bay
allows for designing the protection structures
from the waves approaching only from the
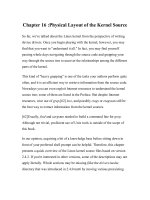
south and west. The layout of the breakwater
and the moorings is shown in Figure 1.
The projected marine terminal is designed
for procuring of a new refinery with the
capacity of 30 million tons per year. The
refinery is not built yet and the time of the
construction is not yet set up.
Laboratory and numerical studies of the
waves at the port water area were conducted
to verify the effectiveness of the breakwater
in providing of acceptable waves parameters
at the moorings
Figure 1. Marine Terminal Layout. Dimensions are in meters
2.
SIMULATION TECHNOLOGIES
WAVES AND CURRENTS
OF equations of gentle slopes, 2-D model
COASTOX_UN of currents calculation based
on numerical solution of non-linear equations
The developed interactive model includes of shallow water on unstructured triangular
as the main modules: the freely distributed grid. Statistical processing of calculation
model of calculation of wind waves of results is carried out in accordance with
SWAN, refractive-diffraction model with modern approaches to the statistics of extreme
open source code ARTEMIS, based on the hydrometeorological phenomena.
xviii
Tuyển tập Hội nghị Khoa học thường niên năm 2018. ISBN: 978-604-82-2548-3
2.1. SWAN Spectral Model
SWAN model of the Technical University
of Delft (Denmark) [1, 2], distributed in open
codes, in the last decade has become
generally accepted in the world practice in
coastal engineering the tool for calculation of
transformation of wind waves from zones
deep to the coastal zone.
The model is based on the equation of the
balance of the density of wave action (or the
balance of wave energy in the absence of
currents) with sources and drains [1, 2]. The
model describes the following wave
processes:
wind
wave
generation;
propagation of waves in variable depth;
change of amplitude of a wave, as a result of
changes of depth and current; refraction, due
to changes in depth and current; diffraction;
blocking and reflection of waves in opposite
directional currents; passing waves through
flooded obstacles.
The model also considers the processes of
wave generation by the wind and their
dissipations: dissipation, caused by the
collapse on deep water; dissipation caused by
the collapse due to the change in depth;
dissipation because of bottom friction; wave
interaction on deep and shallow water.
At the initial stage of the work, the
calculations were performed by SWAN,
version 40.85, then the calculation was made
on the basis of a later version of SWAN 41.
10AB. The results of calculations were
practically not different for both these
versions, for calculation points of the
analyzed region.
SWAN model since the beginning of the
century is increasingly used as a tool for
calculating the wave fields of the coastal
zone, in the systems of forecasting the wave
mode and calculating the characteristics of
waves in the engineering objects of the
coastal zone (for example, [2-6]). An
important step in the application of SWAN
model in the Russia was the work, showed
good
results
in comparison with
measurements in calculating the regime
characteristics of waves in the coastal zones
of the Russian seas. SWAN model is used in
the Arctic and Antarctic Research Institute as
a calculation module for the coastal zone of
the Arctic seas, integrated with the model
AARI-PD2, as well as, in recent years, in
Russian federal service for hydrometeorology
and environmental monitoring it was
introduced for the prediction of wind
disturbance in the Black Sea with detailing in
the offshore zones using SWAN.
The model was successfully applied by the
MSUCE in many engineering projects of
wave hydrodynamics of the coastal zone and
tested according to the corresponding data of
measurements. As an example of such
projects, it is possible to specify: Port Taman,
Port Gelendzhik, Port Belokamenka, etc.
The wide use of the SWAN model for the
calculation of wave field formation of the
coastal zone of the sea caused the choice of
this model in comparison with other spectral
regional models of wind waves as a tool of
calculation wave mode in the Ob lip in the
free-of-ice period.
2.2. ARTEMIS Refractive Diffraction
Model
An open-source ARTEMIS model is
included in the structure of the developed
interactive mathematical model of wind
waves and currents in the proposed
construction for the calculation of wave
fields at hydraulic facilities. Model
ARTEMIS [7], based on an extended version
of the gentle slopes equations [8], in which,
along with the original features of the GSE
calculation of the wave transformation in the
coastal zone, considering the refractivediffraction processes. It’s also added the
ability to calculate the impact of dissipation
due to friction on the bottom and the
destruction of waves in the coastal zone on
the wave characteristics. In ARTEMIS code,
the equations of gentle slopes are solved
numerically by finite element method using
parallel computation algorithm. The model is
xix
Tuyển tập Hội nghị Khoa học thường niên năm 2018. ISBN: 978-604-82-2548-3
a part of the program complex of calculating
the tasks of wave hydrodynamics TELEMAC
[9], the version in open codes of which is
called TELEMAC-MASCARET [10].
Models based on different versions of the
GSE are widely used in engineering tasks of
calculating wave characteristics in ports and
near offshore hydraulic structures. From
many such models we note here only the
most frequently used in engineering projects,
along with ARTEMIS, the model EMS:
Elliptic Mild Slope Wave Module Popular
commercial complex of settlement programs
of marine hydraulics MIKE-21 [11, 12].
The choice of ARTEMIS as one of the
three components of the computational
interactive model developed in this project,
along with its status as a freely distributed
model, is also due to: the successful
ARTEMIS testing for a large number of
projects for seaports, for example [13-15], and
also a set of test calculations, which in
comparison with measurement data is
presented in
model documentation;
availability of both the version for regular
waves and the spectral version of the model;
modern numerical implementation of the
model on the unstructured calculation grid,
which provides the necessary detail of the
wave fields in the calculation areas; effective
paralleling algorithm, allowing to significantly
reduce the time of calculations when using
both multiprocessor and multi-core computer
systems; user-friendly interface.
The ARTEMIS model was successfully
applied by the MSUCE in many engineering
projects of the wave hydrodynamics of the
coastal zone of the sea and tested according
to the corresponding data of measurements
[15]. In the interactive model being
developed, the wave characteristics are
calculated on the approach by the SWAN
model and, then, the mode characteristics of
the waves at the entrance to the port are
transferred to the more detailed in the coastal
zone of the ARTEMIS model grid.
xx
2.3. 2-D Model of Currents Calculation
COASTOX
COASTOX [16, 17] using the
approximation of shallow water describes the
fields of coastal currents generated by the
joint influence of wind, gradient currents of
the deep sea, tides and wind waves. Numerical
solution of the model equations is constructed
by the method of finite volumes on
unstructured triangular grids. The form of the
two-dimensional equations of shallow water
includes members describing the effects of
bottom friction, wave radiation stresses,
horizontal turbulent mixing. Due to the
universal structure of equations, they can,
except coastal currents, under corresponding
boundary conditions and the disconnected
module of wave radiation stresses, to describe
various wave processes: currents in rivers,
transformation of tidal waves, storm surges,
tsunami waves. Algorithms of parallelization
calculations, on multiprocessor and/or multicore systems are realized.
The model was used in many engineering
tasks to calculate the coastal fields of currents.
The conducted comparisons showed its good
accuracy and stability of the used
computational algorithm, for complex
bathymetry and coastal outlines, in
comparison with widely used in the world
practice programs of numerical solution of
shallow water equation on unstructured grids
such as Mike-11 of the Danish Institute "DHI"
[18], ADCIRC USA [19, 20], CMS-Flow
Corps of Engineers of the U.S. Army [21].
The choice of the COASTOX model in
the version implemented on unstructured
grids is due to the ability of the authors of
the model to adapt it effectively to the
interactive model being developed, while the
model of the modules describing the
physical processes and the level of
numerical realization (the use of algorithms
of parallel calculations on unstructured
grids) is not inferior to the most known
software complexes of two-dimensional
modelling of sea currents noted above.
Tuyển tập Hội nghị Khoa học thường niên năm 2018. ISBN: 978-604-82-2548-3
The results of calculations, obtained, with
the help of models SWAN and COASTOX,
adapted for the calculation of waves and
currents in Ob lip, in comparison with the
data of measurements in the region are
presented. and results of prediction of wave
fields of different repeatability on the
structures water area with the help of
ARTEMIS model.
3.
NUMERICAL
STUDY
The description of the study and the results
of the physical and numerical experiments
related to South waves with the diffraction on
the western side of the breakwater is
provided below.
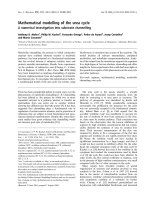
The locations of wave sensors and the
wave generator in the wave basin is shown in
Figure 2.
AND EXPERIMENTAL
To study the waves propagation the
physical model of the water area of the port
was built in the wave basin of the Moscow
State National Research University of Civil
Engineering (MSCEU). The study program
was developed to investigate the distribution
of 5% exceedance South and Southwest waves
at the port water area and their impact on the
eastern and western sides of the breakwater.
The scale of the model of 1:50 was
determined based on the water basin size of
2727 m, actual size of the port water area,
distance from the wave generator to the
entrance to the port, depth of the basin,
prevailing wave direction, and the
correspondence of wave processes in nature and
in the model as per Froude’s similarity criteria.
Four series of experiments were
conducted to study South and Southwest
waves impact on the eastern and western
sides of the breakwater.
At the eastern side of the breakwater, the
experiments were conducted for South waves
with parameters of T =12.3 s and h5% = 5 m
and for Southwest waves with the parameters
of Т = 10.4 s and h5% = 5 m. The modeling
parameters were estimated as Т = 1.74
s, h5% = 10 cm, and Т = 1.5 s, h5% = 10.0 cm,
correspondingly.
At the western side of the breakwater, the
experiments were conducted for South waves
with parameters of Т = 12.3 s, h 5% = 8.5 m,
and for Southwest waves with the parameters
of Т = 10.4 s, h5% = 7.2 m. The modeling
parameters were estimated as Т = 1.74 s,
h5% = 17 cm and Т = 1.47 s, h 5% = 14.4 cm,
correspondingly.
Figure 2. Marine Terminal Model Layout
with the Wave Sensors and Wave Generator
Locations. South Waves Impact on the
Western Side of the Breakwater Study
Different numerical model are used for the
calculation of shallow waves and waves at
the water area of water ports. The spectral
model SWAN [1] is worldwide used, and it is
an open code.
The model is based on the wave action
density balance equation (or conservation of
energy under no ambient currents condition)
with the source and sink terms. The model
can be used in Cartesian or spherical
coordinates depending on the scale of
applications. Diffraction processes are
described approximately and can’t provide
detailed wave field solution for wave
interactions with hydrotechnical structures.
xxi
Tuyển tập Hội nghị Khoa học thường niên năm 2018. ISBN: 978-604-82-2548-3
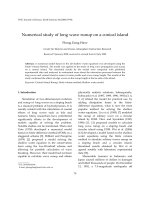
Figure 3. Cross section of the protected breakwater, slope type. The horizontal sizes are in
millimeters, the vertical levels shown in meters, Baltic System
The results of the physical modeling were
compared with the results of the numerical
modeling conducted by the using of the
ARTEMIS software. Software ARTEMIS is
based on the gentle slope hydrodynamic
equations [8]. The software solves the waves
transformation in coastal zones including the
processes of refraction-diffraction, bottom
friction energy dissipation and breaking of
waves. The finite element numerical method
is utilized to solve the elliptic equations.
ARTEMIS is successfully used for similar
studies [15, 16, 22]. It is an open source
software and can be found on the website
/>The bathymetric map of the Sea of Japan,
Peter the Great Bay and Vostok Bay, with the
scale of 1:25000 obtained by the echosounder survey was digitized and used for the
numerical modeling. The port’s structures
were included into the digitized map.
Waves interaction with the different types
of structures were considered by introduction
of the reflection coefficients along the
structure’s boundaries. The reflection
coefficient of kr=0.9 was used for the vertical
structures and for the side slopes of the wave
canal. The reflection coefficient of 0.5 was
used for the slopes of the structures protected
by armor berm.
Two types of the breakwater were
considered. Main type was a wave
impermeable structure with a revetment slope.
An alternative type was a structure with wave
permeable central part that allows some waves
to get to the water area of the port.
The revetment slope was designed with
three layers of protection: the bottom layer
made of stones with weights from 50 to 150
kg was overlayed by the layer made of stones
from 500 to 1500 kg, and the top layer was
made of shaped concrete units (hexabits)
with weight of 10 tones.
To obtain the reflection coefficients the
laboratory experiments of incoming and
passing waves were conducted in a wave
flume and wave’s parameters were recorded.
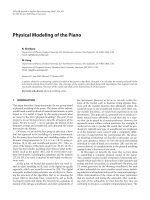
The example the setup of a pier with piles
and a surge plate (wave deflector to reduce
wave overtopping) in the wave flume is
presented in Figure 4.
The bathymetry of the calculation domain
for the study of the western side of the
breakwater and South waves is shown in
Figure 4.
Figure 4. Experiment Setup f or Complex
Structures Reflection Coefficients Estimation
xxii
Tuyển tập Hội nghị Khoa học thường niên năm 2018. ISBN: 978-604-82-2548-3
ARTEMIS numerical grids were built in
accordance with the numerical modeling
requirements. It means that there should be no
less than grid’s 7 nodes for the wave length.
The grids were built for the monochromatic
wave with the period of 7 sec and for the
number of nodes of 10. The mesh sizes
changed from 2 m for shallow water to 8 m for
deep water. The size of grids were as
following: for the study of the eastern side of
the breakwater and South waves the number of
nodes were 87959 and the number of elements
were 174018; for study of the eastern side of
the breakwater and Southwest waves the
number of nodes were 88969 and the number
of elements were 175945; for the study of the
western side of the breakwater and South
waves the number of nodes were 81581 and
elements were 161487; for study of the
western side of the breakwater and Southwest
waves the number of nodes were 51317 and
the number of elements were 101413.
The bathymetry of the calculation domain
for the study of the western side of the
breakwater and South waves is shown in
Figure 5.
Figure 5. Modeling Domain of the Study of
South Waves Impact on the Western Side of
the Breakwater. The wave-generating
boundary is drawn blue. The free boundaries
are drawn green. The other boundaries are
reflecting boundaries with kr = 0.9 (brown),
kr = 0.5 (yellow). The control locations 1, 2,
3, 3’, 4 and 5 correspond to the locations of
the wave sensors in the physical modeling
The waves parameters generated by the wave
generator in physical modeling for the South
waves were T = 1.74 s and h5% = 17.0 cm at the
sensor’s location 1 (entrance to the port). The
corresponding parameters in the numerical
modeling were Т = 12,3 s, h5% = 8,5 м, and
the values were assigned to the wave
generating boundary (Figure 5). The location
of the wave-generating boundary in the
numerical model corresponds to the location
of the wave generator in the physical model.
The results of the numerical modeling of
the wave fields are presented on Figures 6
and 7.
4. COMPARISON
General pictures of the wave fields
recorded in physical modeling are similar to
the obtained in numerical modeling. The
numerical modeling exhibits the same
diffraction and turn of the wave front at the
breakwater head and propagation of the wave
further to the diffraction area of the port
(Figure 6). The general view of the wave
field of the physical model is shown on
Figure 8.
Figure 6. Calculated Waves Phases for the
Physical Model of the Port Water Area f or
the Study of South Waves Impact on the
Western Side of the Breakwater
xxiii