instrumentation for process measurement and control, third editon
Bạn đang xem bản rút gọn của tài liệu. Xem và tải ngay bản đầy đủ của tài liệu tại đây (40.56 MB, 509 trang )
THIRD EDITION
for
NORMAN A. ANDERSON
CHILTON COMPANY
RAONaR,
PENNSYLVANIA
CONTENTS
Preface
SECTION I FEEDBACK PROCESS CONTROL 1
1 Introduction to Process Control 1
Types of Processes 5 Processes with More Than One Capacity and Resis-
tance 6 Dead Time 6 Measurement 7 Symbols 1.0 The Feedback
Loop 1.0 Feedback Control 1.4 ControIling the Process 1.4 Selecting
ControIler Action 1.6 Up sets 1.7 Process Characteristics and ControIl-
ability 1.7 Controller Responses 1.8 On/Off Control 1.9 Proportional
Action 20 Integral Action (Reset) 23 Derivative Action 25 Selecting
the ControIler 27 Conclusion 29 Questions 30
2 Process/Pressure Measuring Instruments 33
What Is Pressure? 33 Units of Measurement 35 Pressure Measure-
ment 35 The Pascal 36 Bar Versus Pascal 37 Gauge, Absolute, and
Differential Pressure 37 Understanding the Effects of Gravity 38 Gravity-
Dependent Units 38 Gravity-Independent Units 39 Pressure Stan-
dards 39 Plant Instruments That Measure Pressure Directly 44 Bell
vi CONTENTS
Instrument 44 Slack .or Limp-Diaphragm 44 Pressure Gauges 46
Liquid or Steam Pressure Measurement 48 Seals and Purges 48 Pulsa-
tion Dampener 48 Metallic Bellows 49 Pressure Transmitters 52 Sig-
nal Transmissions 52 Pneumatic Recorders and Indicators 53 Mechanical
Pressure Seals 55 Calibration Techniques 59 Field Standard 59 Port-
able Pneumatic Calibrator 59 Force-Balance Pneumatic Pressure Trans-
mitter 60 Pneumatic Relay 62 Principle of Operation 63 Absolute
Pressure Transmitter 64 Questions 65
3 Level and Density Measurements 69
Level Measurement Methods 69 Float-and-Cable 70' Displacement
(Buoyancy) 71 Head or Pressure 73 Capacitance 78 Conductance 79
Radiation 79 Weight 79 Ultrasonic 80 Thermal 81 Density Mea-
surement Methods for Liquids and Liquid glumes 81 Hydrostatic Head 82
Radiation 84 Vibration 84 Temperature Eft'ects and Considerations 84
Dift'erential Pressure Transmitter 85 Questions 87
4 Flow Measurement 90
Constriction or Differential Head Type 91 Primary Devices 94 Secondai-y
Devices 99 Relating Flow Rate to Differential 100 Effect of Temperature
on Flow Rate 103 Variable Area Meters (Rotameter) 109 Open-Channel
Flow Rate Measurements 109 Primary Devices 110 Installation and
Selection Considerations 116 Velocity Flowmeters 117 Magnetic Flow-
meter 117 Vortex Flowmeter 121 Turbine Flowmeter 122 Other Flow-
meters 123 Conclusion 124 Questions 124
5 Temperature and Humidity Measurements 126
Temperature 126 Filled Thermal Systems 128 Electrical Systems 130
Thermocouples 130 Resistance Thermal Detectors 139 Thermistors 144
Humidity Measurements 144 Questions 148
6 Analytical Measurements 151
Electrical Conductivity 151 Types of Calibration 154 Calibration in
Conductivity 154 Calibration in Terms of Concentration of
Electrolyte 155 Polarization 156 Cell Construction 156 Electrodeless
Conductivity Measurements 157 Hydrogen Ion Activity (pH) 159 Ioniza-
tion or Dissociation 159 The pH Scale 161 Measurement of pH-The
Glass Electrode 164 Reference Electrode 165 Temperature Compensa-
tion 168 Reading the Output of the pH Electrodes 169 pH Control 170
Summary 172 Oxidation-Reduction Potential 172 Ion-Selective Measure-
ment 173 Chromatography 174 Capacitance 175 References 176
Questions 176
PROCESS
EDc
REACTION CURVE
EC
(a)
TIME
h
(b)
TIME
PRESSURE
IN TANK
(cI
SUPPLY
TIME
TEMP.
(dI
TIME
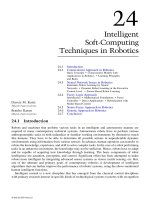
Fig. 1-2. Four types or systems: (a) electric, (b) hydraulic, (c) pneumatic, and (d)
thermal. Each has a single capacity and a single resistance and all bave identical
response characteristics.
regulate a process and certain aspects of process behavior will be dis-
cussed in this text. Examples of some completely instrumented process
systems will be given to demonstrate the practical application of the
instrument components.
The physical system to be controlled mar be electrical, thermal,
hydraulic, pneumatic, gaseous, mechanical, or any other physical type.
Figure 1-2 and Table 1-1 compare severa! common systems. All followthe
same basic laws of physics and dynamics.
INTRoDucnON TO PROCESS CONTROL 5
The behavior of a process with respect to time defines its dynamic
characteristics. Behavior Dot involving time defines its static charac-
teristics. Both static (steady) and dynamic (changing with time) re-
sponses must be considered in the operation and understanding of a
process control system.
Types ot Processes
The simplest process contains a single capacity and a single resistance.
Figure 1-2 illustrates a single-capacity, single-resistance process in (a)
electrical, (b) hydraulic, (c) pneumatic, and (d) thermal forms. To show
how these behave with respect to time, we can impose a step upset
(sudden change) in the input to the process and examine the output.
The resulting change in process:: variable with respect to time is plotted
in Figure 1-3. The reaction curve of all four types of systems will be
identical.
This type of curve (exponential) is basic to automatic control. It
can be obtained easily with an electrical capacitor and resistor arranged
as in Figure l-2a.
Fig. 1-3. Universal tirne-constant chart, showing exponential rise and decay.
6 FEEDBACK PROCESS CONTROL
Figure l-2a shows a simple RC circuit-a resistor, capacitor, and
battery source in series. The instant the circuit is closed, the capacitor
starts to charge to the voltage of the battery. The rate at which the
capacitor charges gradually decreases as the capacitor voltage ap-
proaches the battery voltage (voltage curve A in Figure 1-3). Although
the rate varies, the time it takes the capacitor to charge to 63 percent of
the battery voltage is a constant for any one value of Rand C. Thus, no
matter what the voltage of the battery, the capacitor charges to 63
percent of the battery voltage in a time interval called the time con-
stant, or characteristic time (T) ofthe circuit. The value orT in seconds
is the product of the resistance (in ohms) and the capacitance (in
farads).
Note thai the charging time increases with an increase in either R
orC. ~
This simple RC circuit is often used to produce the transient
waveform shown, which is called an exponential-rise transient.
On discharge, the circuit reacts similarly. For example, if the bat-
tery in Figure l-2a is replaced by a solid conductor, the charged
capacitar discharges 63 percent of its charge in RC seconds.
The simple RC circuit shown in Figure l-2a symbolizes many real
physical situations. It is important to examine the circuit in detail.
InRC seconds, the capacitar charges to 63.2 percent ofthe applied
voltage. In the nextRC seconds, the capacitar charges to 63.2 percent
ofthe remaining voltage, or to 87 percent ofthe applied voltage. In the
third interval of RC seconds, the capacitar charges to 95 percent of the
applied voltage. Although the capacitar never charges to exactly 100
percent of the applied voltage, it does charge to 99 percent in 4.6 RC
seconds as shown in Figure 1-3, which is a curve of capacitar voltage
(or current) versus time. Note that time is plotted inRC (time-constant)
units.
Processes with More Than One Capacity and Resistance
In practice, a process will contain many capacitance and resistance
elements. Figure 1-4 illustrates a process containing two resistance
elements and two capacitance elements. Figure 1-5 shows the resulting
process reaction curve. Note that the additional capacitance and resis-
tance essentially affect the initial curve shape, adding a delay to the
processo
Dead Time
Dead time is a delay between two related actions. For example, assume
that the temperature sensor shown in Figure 1-1 was located 10 feet
I~RODUCTION TO PROCESS CONTROL 7
Fig. 1-4. Multicapacity system.
(3.048 m) away from the beat exchanger. lf the liquid travels at a
velocity of 10 feet (3.048 m) per second, a dead time of one second will
occur. ln some process control situations, dead tim e becomes the most
difficult factor in the equation'. Dead time mar also be called pure delay,
transport lag, or distance/velocity lag. Dead time is rarely found in its
pure form, but occurs frequently in combination with resistance-
capacitance and other types of lags. Dead time is a difficult factor to
equate when applying control to the processo
Measurement
To employ feedback control, we musi first measure the condition we
wish to maintain at the desired standard. The condition (variable) mar
be temperature, pressure, ftow, level, conductivity, pH, moisture con-
tent, or the like.
Fig. l-S. Characteristic curve oC multicapacity system.
8 FEEDBACK PROCESS CONTROL
The measuring element is connected to the control element. ln
many installations, the measurement is located far from the controller.
This problem is solved by using a measuring transmitter (Figure 1-6).
The measuring transmitter usually develops an electrical signal for an
electronic controller or a pneumatic signal for a pneumatic controller.
Measuring transmitters bave attained great popularity in the pro-
cess industries. They perform the measurement and develop a pneuma-
tic or electric signal proportional to the variable in one unit. This signal
can be transmitted long distances. Pneumatic transmitters generally
produce an air pressure change of 3 to 15 psi or 20 to 100 kPa (see p. 36
for definition of pascal unit) for measurement change of O to 100 per-
Fig. 1.6. Measuring transmitters convert the variable to be measured into a
proportional pneumatic or electrical signal.
INTRODUCTION TO PROCESS CONTROL 9
Table 1.2. Standard ISA and SAMA Functional Diagram Elements
~ FLOW ~ SQUARE ROOT r:-ï PROPORTIONAL
\: :I TRANSMITTER L!-J EXTRACTOR ~ CONTROL ACTION
1:"';\ LEVEL r:ï
rJ1 INTEGRAL (RESEn
\!:!I TRANSMITTER ~ MUL TIPlIER L.LJ CONTROL ACTION
~ PRESSURE ~ r'd:"":':1 DERIVATIVE
~ TRANSMITTER L.::: J DIVIDER ~ CONTROL ACTION
l1:r" TEMPERATURE r:¡:-, BIAS, ADDITION r::;-, TIME FUNCTION
~ TRANSMITTER L = J OR SUBTRACTION ~ CHARACTERIZER
1::\ POSITION rA""l COMPARA TOR ~ UNSPECIFIED OR
~ TRANSMITTER ~ DIFFERENCE' ~ NON LINEAR FUNCTION
CHARACTERIZER
, /
O PANEL ~ ADDER r:-::l QUOTATION
/ ,LIGHT L!.J SUMMÉR ~ ITEM NUMBER
1';"\ ~
* MOUNTED ON THE
\.!oI INDICA TOR ~ A VERAGER FRONT OF PANEL
t:'\ ~ rl REGULATED
~ RECORDER ~ INTEGRATOR \J PROCESS AIR
t:;:'\ RELAY
-11- NORMALLYOPEN "* NORMALLYCLOSED
~ COlL RELAYCONTACT RELAYCONTACT
~ AUTO/MANUAL A\. MANUAL SIGNAL /::'- ANALOG SIGNAL
V TRANSFERSWITCH 'W GENERATOR ~ GENERATOR
m TRANSFER OR m SOLEN OID ~ ELECTRIC
L-:-J TRIP RELA Y ~ ACTUA TOR ~ MOTOR
r;ï HIGH SIGNAL m HIGH SIGNAL ~ HIGH SIGNAL
~ SELECTOR ~ lIMITER ~ MONITOR
m LOW SIGNAL m LOW SIGNAL r:-: l LOW SIGNAL
L.:::: J SELECTOR ~ lIMITER L!:!-J MONITOR
~ VELOCITY OR ~ HIGH AND LOW ~ HIGH AND LOW
~ RATE lIMITER ~ lIMITER ~ SIGNAL MONITOR
~ ANALOG TO r::-1 RESIST ANCE TO r::';::"1 RESIST ANCE TO
~DIGITALCONV. ~CURRENTCONV. ~VOLTAGECONV.
I;ViVITHERMOCOUPLETO ~VOLTAGE TO ~CURRENTTO
~VOLTAGECONV. L.::: JCURRENTCONV. ~VOLTAGECONV.
r-viV1 VOLT AGE TO rp;j1 PNEUMATIC TO ~ PNEUMA TIC TO
~VOLTAGECONV. ~CURRENTCONV. ~VOLTAGECONV.
r;;;::\ MOTORIZED r:;:-, CURRENT TO ~ VOL TAGE TO
~OPERATOR ~PNEUMATICCONV. ~ PNEUMAnCCONV.
f";¡O\ HYDRAUlIC ~ PNEUMATIC h L STEM ACTION
~OPERATOR , OPERATOR ~ (GLOBE) VALVE
r:::::\ UNSPECIFIED JA THREE-WAY ROTARYACnON
~OPERATOR "'D'" SELECTOR VAL VE ~ (BALLI VALVE
10 FEEDBACK PROCESS CONTROL
cent; that is, O percent of measurement yields an output pressure of 3
psi or 20 kPa, 50 percent of measurement yields 9 psi or 60 kPa and 100
percent yields 15 psi or 100 kPa output. Electronic transmitters pro-
duce either voltage or current signat outputs. For instance, the output
of analog transmitters is commonly 4 to 20 mA dc.
Symbols
A set of symbols has been adopted to show instrumentation layouts and
to make these layouts more uniformo Once rou become familiar with
these symbols, it will become easy to visualize the system.
At present, two sets of symbols are in use. One set is provided by
the Scientific Apparatus Makers Association (SAMA) and the other by
Instrument Society of America (ISA). In ibis book the ISA symbols
will be used where applicable. Figure 1-7 and Tables 1-2 and 1-3 de-
scribe the symbols and identification letters often used. If rou are in-
volved in the preparation or use of instrument loop diagrams, it is
suggested thai rou obtain the publication thai defines the standards
employed. A loop diagram musi contain the information needed for
both engineering and construction. This includes identification, de-
scription, connections and location, as well as energy sources.
The Feedback Loop
The objective of a control system is to maintain a balance between
supply and demand over a period of time. As noted previously, supply
and demand are defined in terms of energy or material into (the manipu-
INSTRUMENT FOR SINGLE MEASURED VARIABLE
INSTRUMENT
LOCALLY
MOUNTED
INSTRUMENT
MOUNTED ON
BOARD
INSTRUMENT
MOUNTED
BEHIND
BOARD
NSTRUMENT FOR TWO MEASURED VARIABLES
Fig. 1-7. Instrument for measured variables.
INTRODUCTION TO PROCESS CONTROL II
Table 1-3. Meanings of Identification Letters
FIRST LE1TER
Measured or
Inilialing
Variable Modijier
SUCCEEDING LE1TERS
Readoul o,
Passive
Funclion
Output
Function
Modi]ier
Alarrn
User's cooice
A
User', choice
Control
User', cboic.
D
Differential
E
F
G
Primary element
Ratio (fraction)
Glas.
Analysis
Burner flame
Conductivity
(electrical)
Density (mass)
or specitX:
gravity
Voltage (EMF)
F1ow rate
Gaging
(dimensiooal)
Hand (manually
initiated)
Current
(electrical)
Power
Time or time
scheduIe
Level
Moisture or
humidity
User's cboice
User's cboic.
High
1
Indicat.
J
K
Control station
Light (pilot)
Low
Middle or inter-
mediate
User's cboice
L
M
User's cboice
Oritice
(restriction)
Paint (test
connection)
User's choice
N
o
p
Pressure or
vacuum
Quantity or
event
Radioactivi¡y
Speed or
frequency
Temperature
MuItivariable
Viscosity
Q
Integrate or
totalize
R
S
Record or pnn!
Switch
SafelY
T
U
V
Transmit
Multifunction
Valve, damper,
or louver
Multifunction
Multifunction
Well
Unclassified
w
x
y
z
Weight or force
Unclassified
User's cboice
Position
Unclassified
Relay or compute
Drive, actuate
or unclassified
final control
element
Unclassified
FEEDBACK PROCESS CONTROL
Fig. }-8. Heat exchanger.
lated variable) and out of (the controlled variable) the processo The
closed-loop control system achieves this balance by measuring the de-
mand and regulating the supply to maintain the desired balance over
time.
The basic idea of a feedback controlloop is most easily understood
by imagining what an operator would bave to do if automatic control
did Dot exist. Figure 1-8 shows a common application of automatic
control found in many industrial plants: a beat exchanger that uses
steam to beat cold water. In manual operation, the amo unt of steam
entering the beat exchanger depends on the air pressure to the valve,
which is set on the manual regulator. To control the temperature manu-
ally, the operator would watch the indicated temperature, and by com-
paring it with thedesired temperature, would open or close the valve to
admit more or less steam. When the temperature had reached the de-
sired value, the operator would simply hold that output to the valve to
keep the temperature constant. Under automatic control, the tempera-
tufe controller performs the same function. The measurement signat to
the controller from the temperature transmitter is continuously com-
pared to the set-point signat entered into the controller. Based on a
comparlson of the signats, the automatic controller can tell whether
the measurement signat is above or below the set point and move the
valve accordingly until the measurement (temperature) comes to its
final value.
The simple feedback controlloop shown in Figure 1-9 illustrates
the four major elements of any feedback controlloop.
INTRODUCTION TO PROCESS CONTROL
13
+
~;~OL~:¡'-=- or
I MEASUREMENT I
SUPPLV-*
FINAL ACTUATOR
CONTROLLED
VARIABLE
Fig. 1-9. Feedback controlloop.
I. Measurement must be made to indicate the current value of the
variable controlled by the loop. Common measurements used in
industry include ftow rate, pressure, level, temperature, analytical
measurements such as pH, ORP and conductivity; and many oth-
erg particular to specific industries.
2. For every process there must be afina! actuator that regulates the
supply of energy or material to the process and changes the mea-
surement signal. Most often this is some kind of valve, but it might
also be a belt or motor speed, louver position, and so on.3.
The kinds of processes found in industrial plant s are as varied as
the materials they produce. They range from the commonplace,
such as loops to control ftow rate, to the large and complex, such
as distillation columns in the petrochemical industry. Whether
simple or complex, they all consist of some combination of capac-
ity resistance and dead time.4.
The last element of the loop is the automatic controller. Its job is to
control the measurement. To "control" means to keep the mea-
surement at a constant, acceptable value. In this chapter, the
mechanisms inside the automatic controller will Dot be considered.
Therefore, the principIes to be discussed mar be applied equally
well to both pneumatic and electronic controllers and to the con-
trollers from any manufacturer. All automatic controllers use the
same general responses, although the internal mechanisms and the
definitions given for these responses mar differ slightly from one
another.
14 FEEDBACK PROCESS CONTROL
One basic concept is thai for automatic feedback control to exist,
the automatic controlloop musi be closed. This means thai information
musi be continuously passed around the loop. The controller musi be
able to move the val ve, the valve musi be able to atrect the measure-
ment, and the measurement signal musi be reported to the controller. If
ibis path is broken at any point, the loop is said to be open. As soon as
the loop is opened-for example, when the automatic controller is
placed on manual-the automatic unit in the controller is no longer able
to move the val ve. Thus, signats from the controller in response to
changing measurement conditions do noi atrect the valve and automatic
control does noi exist.
Feedback Control
Several principIes associated with feedback control can be observed by
considering a familiar control situation-adjusting the temperature of
water in a bathtub. This is obviously a manually controlled system.
One hand feels the water in the tub while the other manipulates the
inftow to reach the desired temperature. If a thermometer were used to
measure the temperature, greater accuracy would resulto Improved
measurement generally results in improved control.
The bathtub also illustrates the important effect of process capac-
ity. Capacity (Figure 1-2) is a measure ofthe amount ofenergy it takes
to change a system a unit amount; thermal capacity is Btu/°F, or the
amount of beat required to increase the temperature 1°F. Since the
bathtub has a large capacity, it can be controlled in any of several
ways-by partially filling the tub with cold water, for example, and
then adding enough bot water to reach the desired temperature; or by
mixing the bot and cold to get the same resulto
Controlling the Process
In performing the control function, the automatic controller uses the
difference between the set-point and the measurement signats to de-
velop the output signat to the valve. The accuracy and responsiveness
of these signats is a basic limitation on the ability of the controller to
control the measurement correctly. If the transmitter does Dot send an
accurate signat, or ifthere is a lag in the measurement signat, the ability
of the controller to manipulate the process will be degraded. At the
same time, the controller must receive an accurate set-point signat. In
INTRODUCTION TO PROCESS CONTROL 15
controllers using pneumatic or electronic set-point signals generated
within the controller, miscalibration of the set-point transmitter will
develop the wrong value. The ability of the controller to position the
valve accurately is ret another limitation. If there is friction in the
valve, the controller mar Dot be able to move the valve to a specific
stem position to produce a specific flow, and this will appear as a
difference between measurement and set point. Repeated attempts to
position the valve exactly mar lead to hunting in the valve and in the
measurement. Or, if the controller is able only to move the valve very
slowly, the ability of the controller to control the process will be de-
graded. One way to improve the response of control valves is to use a
valve positioner, which acts as a feedback controller to position the
valve at the exact position corresponding to the controller output sig-
nal. However, positioners should be avoided in favor of volume boo-
sters on fast-responding loops such as flow and liquid pressure.
For proper process control, the change in output Crom the control-
ler must be in such a direction as to oppose any change in the mea-
surement value. Figure 1-10 shows a direct-connected valve to control
SPAN OF
MEASUREMENT
Lr
CONTROLLER
ç r-
,-', [[], I
" =
,
,
INLET FLOW
~
I
". ,'~~~""'-1
, ,-
,: =('i
-" ,¿"~ 2 =~.;:
-~-=-~_.=~.~}f~
~ =~
_E/
I I I I
100 50 O
PERCENT OPENING OF VALVE
~I
~
f
OUTLET
FLOW
Fig. 1-10. In proportional control, the controlling valve's position is proportional to the
controlled variable (level).
16 FEEDBACK PROCESS CONTROL
level in a tank at midscale. As the level in the tank rises, the fioat acts to
reduce the fiow rate coming in. Thus, the higher the líquid level, the
more the fiow will be reduced. In the same way, as the level falls, the
fioat will open the valve to add more líquid to the tank. The response of
this system is shown graphically. As the level moves from O to 100
percent, the valve moves from fully open to fully closed. The function
of an automatic controller is to produce this kind of opposing response
over varying ranges. In addition, other responses are available to con-
trol the process more efficiently.
Selecting Controller Action
Depending on the action of the val ve, increases in measurement mar
require either increasing or decreasing outputs for control. All control-
lers can be switched between direct and reverse action. Direct action
means that, when the controller sees an increasing signal from the
transmitter, its output will increase. For reverse action, increasing
measurement signals cause the controller output to decrease. To de-
termine which of these responses is correct, an analysis of the loop is
required. The first step is to determine the action of the val ve.
In Figure 1-1, for safety reasons the valve must shut if there is a
failure in the plant air supply. Therefore, this valve must be air-to-
open, or fail-closed. Second, consider the effect of a change in mea-
sure ment. For increasing temperature, the steam ftow to the beat ex-
changer should be reduced; therefore, the valve must close. To close
this valve, the signal from the automatic controller to the valve must
decrease. Therefore, this controller requires reverse, or increase/
decrease, action. Ifdirect action is selected, increasing signals from the
transmitter will result in a larger steam ftow, causing the temperature to
increase further. The result would be a runaway temperature. The
same thing will occur on any decrease in temperature, causing a falling
temperature. Incorrect selection of the action of the controller always
results in an unstable controlloop as soon as the controller is put into
automatic.
Assuming that the proper action is selected on the controller, how
does the controller know when the proper output has been reached? In
Figure 1-10, for example, to keep the level constant, a controller must
manipulate the ftow in to equal the ftow out. Any difference will cause
the level to change. In other words, the ftow in, or supply, must balance
the ftow out, or demando The controller performs its job by maintaining
this balance at a steady rate, and acting to restore this balance between
supply and demand whenever it is upset.