finance - financial analysis using excel
Bạn đang xem bản rút gọn của tài liệu. Xem và tải ngay bản đầy đủ của tài liệu tại đây (1.65 MB, 254 trang )
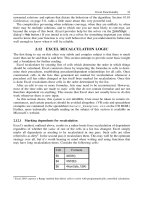
Information requirements for function
Issue
First coupon
Settlement
Maturity
Price
Par/coupon
Any amount paid
at maturity?
Investment
amount
Redemption
amount
Frequency of
payments pa
# of periods
Basis
Yield
Discount
Interest
COUPDAYBS
X
X
X
X
COUPDAYS
X
X
X
X
COUPDAYSNC
X
X
X
X
COUPNCD
X
X
X
X
COUPPCD
X
X
X
X
COUPNUM
X
X
X
X
DURATION
X
X
X
X
X
MDURATION
X
X
X
X
X
PRICE
X
X
X
X
X
X
PRICEDISC
X
X
X
X
X
X
PRICEMAT
X
X
X
X
X
X
RECEIVED
X
X
X
X
X
YIELD
X
X
X
X
X
X
X
X
YIELDDISC
X
X
X
X
X
X
YIELDMAT
X
X
X
X
X
X
ACCRINT
X
X
X
X
X
X
X
ACCRINTM
X
X
X
X
X
INTRATE
X
X
X
X
X
X
DISC
X
X
X
X
X
X
Excel for Professionals
2002 VJ Books. All rights reside with the author.
Financial Analysis using Excel
2
F
F
F
i
i
i
n
n
n
a
a
a
n
n
n
c
c
c
i
i
i
a
a
a
l
l
l
A
A
A
n
n
n
a
a
a
l
l
l
y
y
y
s
s
s
i
i
i
s
s
s
u
u
u
s
s
s
i
i
i
n
n
n
g
g
g
E
E
E
x
x
x
c
c
c
e
e
e
l
l
l
Volume 6 in the series
E
E
E
x
x
x
c
c
c
e
e
e
l
l
l
f
f
f
o
o
o
r
r
r
P
P
P
r
r
r
o
o
o
f
f
f
e
e
e
s
s
s
s
s
s
i
i
i
o
o
o
n
n
n
a
a
a
l
l
l
s
s
s
Volume 1: Excel For Beginners
Volume 2: Charting in Excel
Volume 3: Excel Beyond The Basics
Volume 4: Managing & Tabulating Data in Excel
Volume 5: Statistical Analysis with Excel
Volume 6: Financial Analysis using Excel
Published by VJ
Books Inc
All rights reserved. No part of this book may be used or reproduced in any form or by
any means, or stored in a database or retrieval system, without prior written
permission of the publisher except in the case of brief quotations embodied in
reviews, articles, and research papers. Making copies of any part of this book for any
purpose other than personal use is a violation of United States and international
copyright laws.
First year of printing: 2002
Date of this copy: Saturday, December 14, 2002
This book is sold as is, without warranty of any kind, either express or implied,
respecting the contents of this book, including but not limited to implied warranties
for the book's quality, performance, merchantability, or fitness for any particular
purpose. Neither the author, the publisher and its dealers, nor distributors shall be
liable to the purchaser or any other person or entity with respect to any liability, loss,
or damage caused or alleged to be caused directly or indirectly by the book.
This book is based on Excel versions 97 to XP. Excel, Microsoft Office, Microsoft
Word, and Microsoft Access are registered trademarks of Microsoft Corporation.
Publisher: VJ
Books Inc, Canada
Author: Vijay Gupta
3
To Dr “Chini” at the Business School Georgetown Universitry
and SEC.
Thanks for the timely support and advice.
Financial Analysis using Excel
4
A
A
A
B
B
B
O
O
O
U
U
U
T
T
T
T
T
T
H
H
H
E
E
E
A
A
A
U
U
U
T
T
T
H
H
H
O
O
O
R
R
R
Vijay Gupta has taught statistic, econometrics, and finance to institutions in
the US and abroad, specializing in teaching technical material to
professionals.
He has organized and held training workshops in the Middle East, Africa,
India, and the US. The clients include government agencies, financial
regulatory bodies, non-profit and private sector companies.
A Georgetown University graduate with a Masters degree in economics, he
has a vision of making the tools of econometrics and statistics easily
accessible to professionals and graduate students. His books on SPSS and
Regression Analysis have received rave reviews for making statistics and
SPSS so easy and “non-mathematical.” The books are in use by over 150,000
users in more than 140 nations.
He is a member of the American Statistics Association and the Society for
Risk Analysis.
In addition, he has assisted the World Bank and other organizations with
econometric analysis, survey design, design of international investments,
cost-benefit, and sensitivity analysis, development of risk management
strategies, database development, information system design and
implementation, and training and troubleshooting in several areas.
Vijay has worked on capital markets, labor policy design, oil research, trade,
currency markets, and other topics.
5
V
V
V
I
I
I
S
S
S
I
I
I
O
O
O
N
N
N
Vijay has a vision for software tools for Office Productivity and
Statistics. The current book is one of the first tools in stage one of his
vision. We now list the stages in his vision.
Stage one:
Books to
Teach
Existing Software
He is currently working on books on word-processing, and report
production using Microsoft Word, and a booklet on Professional
Presentations.
The writing of the books is the first stage envisaged by Vijay for
improving efficiency and productivity across the world. This directly
leads to the second stage of his vision for productivity improvement
in offices worldwide.
Stage two:
Improving
on Existing Software
The next stage is the construction of software that will radically
improve the usability of current Office software.
Vijay’s first software is undergoing testing prior to its release in Jan
2003. The software — titled “Word Usability Enhancer” — will
revolutionize the way users interact with Microsoft Word, providing
users with a more intuitive interface, readily accessible tutorials, and
numerous timesaving and annoyance-removing macros and utilities.
He plans to create a similar tool for Microsoft Excel, and, depending
on resource constraints and demand, for PowerPoint, Star Office, etc.
Financial Analysis using Excel
6
Stage 3:
Construction
of the first “feedback-designed” Office and Statistics
software
Vijay’s eventual goal is the construction of productivity software
that will provide stiff competition to Microsoft Office. His hope is
that the success of the software tools and the books will convince
financiers to provide enough capital so that a successful software
development and marketing endeavor can take a chunk of the multi-
billion dollar Office Suite market.
Prior to the construction of the Office software, Vijay plans to
construct the “Definitive” statistics software. Years of working on
and teaching the current statistical software has made Vijay a
master at picking out the weaknesses, limitations, annoyances, and,
sometimes, pure inaccessibility of existing software. This 1.5 billion
dollar market needs a new visionary tool, one that is appealing and
inviting to users, and not forbidding, as are several of the current
software. Mr. Gupta wants to create integrated software that will
encompass the features of SPSS, STATA, LIMDEP, EViews,
STATISTICA, MINITAB, etc.
Other
He has plans for writing books on the “learning process.” The books
will teach how to understand one’s approach to problem solving and
learning and provide methods for learning new techniques for self-
learning.
C
C
C
O
O
O
N
N
N
T
T
T
E
E
E
N
N
N
T
T
T
S
S
S
CHAPTER 1 WRITING FORMULAS 25
1.1
The Basics Of Writing Formulae 26
1.2
Tool for using this chapter effectively: Viewing the formula instead of the end
result 26
1.2.a The “A1” vs. the “R1C1“ style of cell references 28
1.2.b Writing a simple formula that references cells 29
1.3
Types Of References Allowed In A Formula 30
1.3.a Referencing cells from another worksheet 30
1.3.b Referencing a block of cells 30
1.3.c Referencing non–adjacent cells 31
1.3.d Referencing entire rows 32
1.3.e Referencing entire columns 32
1.3.f Referencing corresponding blocks of cells/rows/columns from a set of
worksheets 33
1.4
Working Simultaneously On Cells In Different Worksheets 34
CHAPTER 2 COPYING/CUTTING AND PASTING FORMULAE 36
2.1
Copying And Pasting A Formula To Other Cells In The Same Column 37
2.2
Copying And Pasting A Formula To Other Cells In The Same Row 38
2.3
Copying And Pasting A Formula To Other Cells In A Different Row And Column
39
2.4
Controlling Cell Reference Behavior When Copying And Pasting Formulae (Use
Of The “$” Key) 40
2.4.a Using the “$” sign in different permutations and computations in a formula 42
2.5
Copying And Pasting Formulas From One Worksheet To Another 43
2.6
Pasting One Formula To Many Cells, Columns, Rows 44
2.7
Pasting Several Formulas To A Symmetric But Larger Range 44
2.8
Defining And Referencing A “Named Range” 44
Adding several named ranges in one step 47
Using a named range 48
2.9
Selecting All Cells With Formulas That Evaluate To A Similar Number Type 49
2.10
Special Paste Options 49
2.10.a Pasting only the formula (but not the formatting and comments) 49
2.10.b Pasting the result of a formula, but not the formula itself 49
2.11 Cutting And Pasting Formulae 50
Financial Analysis using Excel
8
2.11.a The difference between “copying and pasting” formulas and “cutting and
pasting” formulas 50
2.12
Creating A Table Of Formulas Using Data/Table 51
2.13
Saving Time By Writing, Copying And Pasting Formulas On Several Worksheets
Simultaneously 51
CHAPTER 3 PASTE SPECIAL 53
3.1
Pasting The Result Of A Formula, But Not The Formula 54
3.2
Other Selective Pasting Options 57
3.2.a Pasting only the formula (but not the formatting and comments) 57
3.2.b Pasting only formats 57
3.2.c Pasting data validation schemes 58
3.2.d Pasting all but the borders 58
3.2.e Pasting comments only 58
3.3
Performing An Algebraic “Operation” When Pasting One Column/Row/Range On
To Another 59
3.3.a Multiplying/dividing/subtracting/adding all cells in a range by a number 59
3.3.b Multiplying/dividing the cell values in cells in several “pasted on” columns
with the values of the copied range 60
3.4
Switching Rows To Columns 60
CHAPTER 4 INSERTING FUNCTIONS 62
4.1
Basics 62
4.2
A Simple Function 65
4.3
Functions That Need Multiple Range References 68
4.4
Writing A “Function Within A Function” 70
4.5
New Function-Related Features In The XP Version Of Excel 74
Searching for a function 74
4.5.a Enhanced Formula Bar 74
4.5.b Error Checking and Debugging 75
CHAPTER 5 TRACING CELL REFERENCES & DEBUGGING FORMULA ERRORS 77
5.1
Tracing the cell references used in a formula 77
5.2
Tracing the formulas in which a particular cell is referenced 79
5.3
The Auditing Toolbar 80
5.4
Watch window (only available in the XP version of Excel) 81
5.5
Error checking and Formula Evaluator (only available in the XP version of Excel)
82
5.6
Formula Auditing Mode (only available in the XP version of Excel) 85
5.7
Cell-specific Error Checking and Debugging 86
Contents
9
5.8
Error Checking Options 87
CHAPTER 6 LOAN REPAYMENTS 90
6.1
Single Period Payment On Principal And Interest 91
6.1.a Relation between NPER and RATE when the payment period is less than one
year 91
Payment on Principal only (not on interest) 92
6.1.b Payment on interest only (not on principal) 92
6.1.c Payment on interest and principal 93
6.2
Loan Repayments (Cumulative Payment Over Periods) 94
6.2.a Cumulative repayment of principal 94
6.2.b Cumulative interest paid on a loan 95
Cumulative interest and principal paid on a loan between user-chosen
periods 96
Summary of loan repayment formulae 97
6.3
Related Functions: RATE & NPER 98
RATE (“Interest Rate per period of an Annuity”) 98
NPER (“Number of periods in an Investment”) 99
6.4
Mapping Between Simple And Compound Rates For The Same Annual Interest
100
EFFECT (“Effective Interest Rate”) 100
NOMINAL (“Nominal Interest Rate”) 100
CHAPTER 7 DISCOUNT CASH FLOWS 103
7.1
Present Values 103
PV 104
NPV 105
XNPV 106
7.2
Discount Cash Flow Analysis: Rates Of Return For An Investment/Project 107
IRR 107
MIRR 108
XIRR 109
7.3
Future Values 110
FV function 110
Rate versus NPER 111
FVSCHEDULE function 111
Difference between FV and FVSCHEDULE 112
7.4
Annuities — Comparative Summary Of Functions 112
7.5
Depreciation 114
7.5.a Depreciation of an asset over a single period 114
Straight-line and Sum-of-year’s depreciation methods 114
SLN function: Straight line depreciation 114
SYD function: Sum-of-years' digit method 114
7.5.b Depreciation of an asset over specified period using declining balance
methods 115
Fixed declining balance method 115
Variable declining balance method 116
Financial Analysis using Excel
10
Allowing for a switch over between declining balances and straight line –
the VDB function 119
7.6
Risk Analysis— “If-Then” Scenarios 120
CHAPTER 8 SECURITIES FUNCTIONS 121
8.1
Information Requirements 121
8.2
Coupon-Related Functions 124
COUPDAYBS 124
COUPDAYS 125
COUPDAYSNC 126
COUPNCD 127
COUPPCD 128
COUPNUM 129
DURATION & MDURATION (Bond price’s response to changes in yield)
functions 130
8.3
Price versus Yield, & Interest Calculations 132
8.3.a Security that pays periodic interest (Coupon Paying Bond) 132
YIELD 132
PRICE 133
ACCRINT 133
Price and Yield for odd (long or short) first or last period Bonds 134
Odd First Period 134
Yield 135
Odd Last Period 136
Yield 136
8.3.b A discounted security which may pay redemption at maturity 138
DISC 138
PRICEDISC 139
YIELDDISC 140
8.3.c Security that pays interest at maturity 141
PRICEMAT 141
YIELDMAT 142
ACCRINTM 142
8.3.d Fully invested security 144
INTRATE 144
RECEIVED 144
8.4
Information Requirements For Loan Repayment And Securities Functions 145
8.5
T Bill Formulae 146
TBILLEQ function 146
TBILLPRICE function 147
TBILLYIELD function: Yield for a treasury bill (given market price or par
value) 149
CHAPTER 9 FUNCTIONS FOR BASIC STATISTICS 152
9.1
“Averaged” Measures Of Central Tendency 153
9.1.a AVERAGE 153
9.1.b TRIMMEAN (“Trimmed mean”) 154
9.1.c HARMEAN (“Harmonic mean”) 155
9.1.d GEOMEAN (“Geometric mean”) 156
Contents
11
9.2
Location Measures Of Central Tendency (Mode, Median) 157
9.2.a MEDIAN 158
9.2.b MODE 158
9.3
Other Location Parameters (Maximum, Percentiles, Quartiles, Other) 158
9.3.a QUARTILE 159
9.3.b PERCENTILE 159
9.3.c Maximum, Minimum and “Kth Largest” 160
MAX (“Maximum value”) 160
MIN (“Minimum value”) 161
LARGE 161
SMALL 162
9.3.d Rank or relative standing of each cell within the range of a series 162
PERCENTRANK 162
RANK 163
9.4
Measures Of Dispersion (Standard Deviation & Variance) 163
Sample dispersion: STDEV, VAR 164
Population dispersion: STDEVP, VARP 164
9.5
Shape Attributes Of The Density Function (Skewness, Kurtosis) 165
9.5.a Skewness 165
9.5.b Kurtosis 167
9.6
Functions Ending With An “A” Suffix 168
CHAPTER 10 OTHER MATHEMATICS & STATISTICS FUNCTIONS 172
10.1
Counting and summing 173
COUNT function 173
COUNTA function also counts cells with logical or text values 175
COUNTBLANK function counts the number of empty cells in the range
reference 176
SUM function 176
PRODUCT function 177
SUMPRODUCT function 177
10.2
The “If” counting and summing functions: Statistical functions with logical
conditions 178
SUMIF function 179
COUNTIF function 179
10.3
Transformations (log, exponential, absolute, sum, etc) 181
Standardizing a series that follows a Normal Density Function 184
10.4
Deviations from the Mean 184
DEVSQ 184
AVEDEV 185
10.5
Cross series relations 186
10.5.a Covariance and correlation functions 186
10.5.b Sum of Squares 186
SUMXMY2 function 187
SUMX2MY2 function 187
CHAPTER 11 LOGICAL & INFORMATION FUNCTIONS 190
Financial Analysis using Excel
12
11.1
Negative Nesting (The Not Function) 191
11.2
Functions That Output True/False After Evaluating If All/One/None Of The
Logical Expressions Are True (The Functions— And, Or) 192
11.2.a AND function 192
11.2.b OR function 193
11.2.c NOT(AND) function 194
11.2.d NOT(OR) function 195
11.3
Information Functions On Type Of Data In Cell (Is Functions) 197
11.3.a TYPE function provides information on the data type of the value in a cell 199
11.4
Testing If Odd Or Even Number 201
ISODD function 201
ISEVEN function 201
11.5
Information On Error Type In A Cell (#N/A, #Value!, #Ref!, #Div/0!, #Num!,
#Name?, #Null!) 202
11.5.a ERROR.TYPE function provides information on the Error type — if any - in a
cell 203
11.6
Lookup Or “Location” Functions 205
The functions: COLUMN/ROW 205
The functions: COLUMNS/ROWS 205
The functions: INDEX, MATCH, OFFSET, HYPERLINK, ADDRESS,
TRANSPOSE, AREAS, INDIRECT 206
CHAPTER 12 “SMART” NESTED FUNCTIONS THAT RESPOND TO FORMULA RESULT
208
12.1
If Function 208
12.2
Choose Function 209
12.3
Working with Nested functions 211
12.3.a Defining the Nested Function 211
Nesting by hand 211
12.3.b Nesting with the assistance of the “Insert Function” dialog 212
12.3.c Formula AutoCorrection 214
12.3.d Formula Bar identification of error 215
12.3.e Function identification in the Formula Bar Assistant 216
Identification of cells referenced by the function highlighted in the Formula
Bar 218
12.4
Multiple Nesting: Tips 218
CHAPTER 13 ADD-INS: ENHANCING EXCEL 220
13.1
Add-Ins: Introduction 220
13.1.a What can an Add-In do? 221
13.1.b Why use an Add-In? 221
13.2
Add–ins installed with Excel 221
13.3
Other Add-Ins 221
13.4
The Statistics Add-In 222
Contents
13
13.4.a Choosing the Add-Ins 222
CHAPTER 14 THE SOLVER TOOL FOR CONSTRAINED LINEAR OPTIMIZATION 227
14.1
Defining the objective function (Choosing the optimization criterion) 227
14.2
Adding constraints 231
14.3
Choosing Algorithm Options 232
Running the Solver 233
CHAPTER 15 “IF-THEN” ANALYSIS: SCENARIOS AND GOAL SEEK 236
15.1
Scenarios (for “If this assumption-then this result”) 236
15.1.a Defining the Scenarios 237
Using the Scenarios 240
Scenario summary 241
Using the “Group and Outline” tool 242
Scenario-based Pivot Tables 244
15.2
Goal Seek (“If I want this cell to have a certain result, what value should that cell
take) 246
15.2.a Setting the desired value for the “target” cell (the one with the formula that
references the “solution” cell) 247
15.2.b Choosing the “solution” cell 247
Running the utility 248
INDEX 242
Financial Analysis using Excel
14
Mapping of menu options with sections of the book
and in the series of books
You may be looking for a section that pertains to a particular menu option
in Excel. I now briefly lay out where to find (in the series) a discussion of
a specific menu option of Excel.
Table 1: Mapping of the options in the “FILE“ menu
Menu Option Section that discusses the option
OPEN
SAVE
SAVE AS
Volume 1: Excel For Beginners
SAVE AS WEB PAGE
Volume 3: Excel– Beyond The Basics
SAVE WORKSPACE
Volume 3: Excel– Beyond The Basics
SEARCH Volume 1: Excel For Beginners
PAGE SETUP Volume 1: Excel For Beginners
PRINT AREA Volume 1: Excel For Beginners
PRINT PREVIEW Volume 1: Excel For Beginners
Volume 1: Excel For Beginners
PROPERTIES Volume 1: Excel For Beginners
Table 2: Mapping of the options in the “EDIT“ menu
Menu Option Section that discusses the option
UNDO Volume 1: Excel For Beginners
REDO Volume 1: Excel For Beginners
CUT
COPY
Volume 1: Excel For Beginners
Contents
15
Menu Option Section that discusses the option
PASTE
OFFICE CLIPBOARD Volume 1: Excel For Beginners
PASTE SPECIAL
Volume 3: Excel– Beyond The Basics
FILL
Volume 4: Managing & Tabulating Data in Excel
CLEAR Volume 1: Excel For Beginners
DELETE SHEET Volume 1: Excel For Beginners
MOVE OR COPY SHEET Volume 1: Excel For Beginners
FIND Volume 1: Excel For Beginners
REPLACE Volume 1: Excel For Beginners
GO TO
Volume 3: Excel– Beyond The Basics
LINKS
Volume 3: Excel– Beyond The Basics
OBJECT
Volume 3: Excel– Beyond The Basics
Volume 2: Charting in Excel
Table 3: Mapping of the options in the “VIEW“ menu
Menu Option Section that discusses the option
NORMAL
Volume 1: Excel For Beginners
PAGE BREAK PREVIEW Volume 1: Excel For Beginners
TASK PANE
Volume 1: Excel For Beginners
TOOLBARS Volume 1: Excel For Beginners
Volume 3: Excel– Beyond The Basics
FORMULA BAR
Leave it on (checked)
STATUS BAR
Leave it on (checked)
HEADER AND FOOTER Volume 1: Excel For Beginners
COMMENTS
Volume 3: Excel– Beyond The Basics
FULL SCREEN
Volume 1: Excel For Beginners
Financial Analysis using Excel
16
Menu Option Section that discusses the option
ZOOM Volume 1: Excel For Beginners
Table 4: Mapping of the options in the “INSERT“ menu
Menu Option Section that discusses the option
CELLS
Volume 1: Excel For Beginners
ROWS
Volume 1: Excel For Beginners
COLUMNS
Volume 1: Excel For Beginners
WORKSHEETS
Volume 1: Excel For Beginners
CHARTS
Volume 2: Charting in Excel
PAGE BREAK
Volume 1: Excel For Beginners
FUNCTION
chapter 1-chapter 4
FUNCTION/FINANCIAL
chapter 6-chapter 8
FUNCTION/STATISTICAL
chapter 9-chapter 10
FUNCTION/LOGICAL
Volume 3: Excel– Beyond The Basics
FUNCTION/TEXT
Volume 3: Excel– Beyond The Basics
FUNCTION/INFORMATION
Volume 3: Excel– Beyond The Basics
FUNCTION/LOOKUP
Volume 3: Excel– Beyond The Basics
FUNCTION/MATH & TRIG
Volume 3: Excel– Beyond The Basics
FUNCTION/ENGINEERING
Volume 3: Excel– Beyond The Basics
FUNCTION/DATABASE
Volume 3: Excel– Beyond The Basics
FUNCTION/DATE & TIME
Volume 3: Excel– Beyond The Basics
NAME
2.8
COMMENT
Volume 3: Excel– Beyond The Basics
PICTURE
Volume 2: Charting in Excel
DIAGRAM
Volume 2: Charting in Excel
Contents
17
Menu Option Section that discusses the option
OBJECT
Volume 3: Excel– Beyond The Basics
HYPERLINK
Volume 3: Excel– Beyond The Basics
Table 5: Mapping of the options inside the “FORMAT“ menu
Menu Option Section that discusses the option
CELLS
Volume 1: Excel For Beginners
ROW
Volume 1: Excel For Beginners
COLUMN
Volume 1: Excel For Beginners
SHEET
Volume 1: Excel For Beginners
AUTOFORMAT
Volume 1: Excel For Beginners
CONDITIONAL FORMATTING
Volume 3: Excel– Beyond The Basics
STYLE
Volume 1: Excel For Beginners
Table 6: Mapping of the options inside the “TOOLS“ menu
Menu Option Section that discusses the option
SPELLING
Volume 1: Excel For Beginners
ERROR CHECKING
Volume 3: Excel– Beyond The Basics
SPEECH
Volume 4: Managing & Tabulating Data in Excel
SHARE WORKBOOK
Volume 3: Excel– Beyond The Basics
TRACK CHANGES
Volume 3: Excel– Beyond The Basics
PROTECTION
Volume 3: Excel– Beyond The Basics
ONLINE
COLLABORATION
Volume 3: Excel– Beyond The Basics
GOAL SEEK
15.2
SCENARIOS 15.1
AUDITING
Volume 3: Excel– Beyond The Basics
Financial Analysis using Excel
18
Menu Option Section that discusses the option
TOOLS ON THE WEB
The option will take you to a Microsoft site that
provides access to resources for Excel
MACROS
In upcoming book on “Macros for Microsoft Office”
ADD-INS chapter 13
AUTOCORRECT
Volume 1: Excel For Beginners
Volume 4: Managing & Tabulating Data in Excel
CUSTOMIZE
Volume 3: Excel– Beyond The Basics
OPTIONS
Volume 1: Excel For Beginners
Table 7: Mapping of the options inside the “DATA” menu
Menu Option Section that discusses the option
SORT
Volume 4: Managing & Tabulating Data in Excel
FILTER
Volume 4: Managing & Tabulating Data in Excel
FORM
Volume 4: Managing & Tabulating Data in Excel
SUBTOTALS
Volume 4: Managing & Tabulating Data in Excel
VALIDATION
Volume 4: Managing & Tabulating Data in Excel
TABLE 2.12
CONSOLIDATION
section 48.5
GROUP AND OUTLINE
Volume 1: Excel For Beginners
PIVOT REPORT
Volume 4: Managing & Tabulating Data in Excel
EXTERNAL DATA
Volume 4: Managing & Tabulating Data in Excel
Table 8: Mapping of the options inside the “WINDOW“ menu
Menu Option Section that discusses the option
HIDE
Volume 3: Excel– Beyond The Basics
SPLIT
Volume 1: Excel For Beginners
FREEZE PANES
Volume 1: Excel For Beginners
Contents
19
Table 9: Mapping of the options inside the “HELP“ menu
Menu Option Section that discusses the option
OFFICE ASSISTANT
Volume 1: Excel For Beginners
HELP
Volume 1: Excel For Beginners
WHAT’S THIS
Volume 1: Excel For Beginners
Financial Analysis using Excel
20
I
I
I
N
N
N
T
T
T
R
R
R
O
O
O
D
D
D
U
U
U
C
C
C
T
T
T
I
I
I
O
O
O
N
N
N
Are there not enough Excel books in the market? I have asked myself this
question and concluded that there are books “inside me,” based on what I
have realized from observation by friends, students, and colleagues that I
have a “vision and knack for explaining technical material in plain
English.”
Read the book practicing the lessons on the sample files provided in the
zipped file you downloaded. I hope the book is useful and assists you in
increasing your productivity in Excel usage. You may be pleasantly
surprised at some of the features shown here. They will enable you to
save time.
The “Make me a Guru” series teach technical material in simple English.
A lot of thinking went into the sequencing of chapters and sections. The
book is broken down into logical “functional” components. Chapters are
organized into sections and sub-sections. This creates a smooth flowing
structure, enabling “total immersion” learning. The current book is
broken down into a multi-level hierarchy:
—Chapters, each teaching a specific skill/tool.
— Several sections within each chapter. Each section shows aspect of
the skill/tool taught in the chapter. Each section is numbered—for
example, “Section 1.2” is the numbering for the second section in
chapter 1.
— A few sub-sections (and maybe one further segmentation) within
each section. Each sub-section lists a specific function, task, or
proviso related to the “master” section. The sub-sections are
numbered——for example, “1.2.a” for the first sub-section in the
second section of chapter 1.
Contents
21
Unlike other publishers, I do not consider you dummies or idiots. Each
and everyone had the God given potential to achieve mastery in any field.
All one needs is a guide to show you the way to master a field. I hope to
play this role. I am confident that you will consider your self an Excel
“Guru” (in terms of the typical use of Excel in your profession) and so will
others.
Once you learn the way to master a windows application, this new
approach will enable you to pick up new skills” on the fly.” Do not argue
for your limitations. You have none.
I hope you have a great experience in learning with this book. I would
love feedback. Please use the feedback form on our website vjbooks.net.
In addition, look for updates and sign up for an infrequent newsletter at
the site.
VJ Inc Corporate and Government Training
We provide productivity-enhancement and capacity building for corporate,
government, and other clients. The onsite training includes courses on:
•
Designing and Implementing Improved Information and
Knowledge Management Systems
•
Improving the Co-ordination Between Informational Technology
Departments and Data Analysts & other end-users of
Information
•
Office Productivity Software and Tools
•
Data Mining
•
Financial Analysis
•
Feasibility Studies
•
Risk Analysis, Monitoring and Management
Financial Analysis using Excel
22
•
Statistics, Forecasting, Econometrics
•
Building and using Credit Rating/Monitoring Models
•
Specific software applications, including Microsoft Excel, VBA,
Word, PowerPoint, Access, Project, SPSS, SAS, STATA, ands
many other
Contact our corporate training group at .
BASICS
The fundamental operations in Excel are taught in
Volume 1: Excel For
Beginners
,
Volume 2: Charting in Excel
, and
Volume 3: Excel– Beyond The
Basics
FUNCTIONS
I teach the writing of formulas and associated topics in
Volume 3: Excel–
Beyond The Basics
. I show, in a step-by-step exposition, the proper way
for writing cell references in a formula. The book describe tricks for
copying/cutting and pasting in several examples. In addition, I discuss
special pasting options.
Finally, different types of functions are classified under logical categories
and discussed within the optimal category. The categories include
financial, Statistical, Text, Information, Logical, and “Smart” Logical.
FINANCE
In three chapters on financial functions, I list the functions used for
estimating loan repayments (for example, like a car loan or house
mortgage), discount cash flow analysis (used often for estimating the
returns and present values of multi-period investment projects), and
parameters associated with securities market instruments like bonds and
Contents
23
T-bills.
If your interest is Investment Banking or Feasibility Studies (Project
Finance), you should learn Scenarios, the Solver utility, and Goal Seek.
With Scenarios, you can perform basic risk analysis.
STATISTICS PROCEDURES
Three chapters teach statistics functions including the use of Excel
functions for building Confidence Intervals and conducting Hypothesis
Testing for several types of distributions. The design of hypothesis tests
and the intermediate step of demarcating critical regions are taught
lucidly.
MANAGING & TABULATING DATA
Excel has extremely powerful data entry, data management, and
tabulation tools. The combination of tools provide almost database like
power to Excel. Unfortunately, the poor quality of the menu layout and
the help preclude the possibility of the user self-learning these features.
These features are taught in
Volume 4: Managing & Tabulating Data in
Excel
CHARTING
Please refer to book two in this series. The book title is
Charting in Excel.
Sample data
All the sample data files are included in the zipped file.
Page for Notes
Chapter 1: Writing Formulas
25
CHAPTER 1
WRITING FORMULAS
This chapter discusses the following topics:
— THE BASICS OF WRITING FORMULAE
— TOOL FOR USING THIS CHAPTER EFFECTIVELY: VIEWING
THE FORMULA INSTEAD OF THE END RESULT
— The A1 VS THE R1C1 STYLE OF CELL REFERENCES
— TYPES OF REFERENCES ALLOWED IN A FORMULA
— REFERENCING CELLS FROM ANOTHER WORKSHEET
— REFERENCING A BLOCK OF CELLS
— REFERENCING NON–ADJACENT CELLS
— REFERENCING ENTIRE ROWS
— REFERENCING ENTIRE COLUMNS
— REFERENCING CORRESPONDING BLOCKS OF
CELLS/ROWS/COLUMNS FROM A SET OF WORKSHEETS
The most important functionality offered by a spreadsheet application is
the ease and flexibility of writing formulae. In this chapter, I start by
showing how to write simple formula and then build up the level of
complexity of the formulae.
Within the sections of this chapter, you will find tips and notes on
commonly encountered problems or issues in formula writing.