basic protein and peptide protocols
Bạn đang xem bản rút gọn của tài liệu. Xem và tải ngay bản đầy đủ của tài liệu tại đây (27.26 MB, 482 trang )
CHAPTER 1
The Lowry Method
for Protein Quantitation
Jaap H. Waterborg and Harry R Matthews
1. Introduction
The most accurate method of determining protein concentration is
probably acid hydrolysis followed by amino acid analysis. Most other
methods are sensitive to the amino acid composition of the protein,
and absolute concentrations cannot be obtained. The procedure of
Lowry et al. (I) is no exception, but its sensitivity is moderately con-
stant from protein to protein, and it has been so widely used that
Lowry protein estimations are a completely acceptable alternative to
a rigorous absolute determination in almost all circumstances where
protein mixtures or crude extracts are involved.
The method is based on both the Biuret reaction, where the peptide
bonds of proteins react with copper under alkaline conditions pro-
ducing Cu+, which reacts with the Folin reagent, and the Folin-
Ciocalteau reaction, which is poorly understood but in essence
phosphomolybdotungstate is reduced to heteropolymolybdenum blue
by the copper-catalyzed oxidation of aromatic amino acids. The reac-
tions result in a strong blue color, which depends partly on the tyrosine
and tryptophan content. The method is sensitive down to about 0.01
mg of protein/ml, and is best used on solutions with concentrations
in the range 0.01-l .O mg/mL of protein.
From Methods in Molecular Biology, Vol 32. Basic Protein and Peptrde Protocols
Edited by: J M. Walker Copyright 01994 Humana Press Inc., Totowa, NJ
1
2 Waterborg and Matthews
2. Materials
1, Complex-forming reagent: Prepare immediately before use by mixing
the following three stock solutions A, B, and C in the proportion 100: 1: 1
(v:v:v), respectively.
Solution A: 2% (w/v) NaJOs in distilled water.
Solution B: 1% (w/v) CuS04.5Hz0 in distilled water.
Solution C: 2% (w/v) sodium potassium tartrate in distilled water.
2. 2N NaOH.
3. Folin reagent (commercially available): Use at 1N concentration.
4. Standards: Use a stock solution of standard protein (e.g., bovine serum
albumin fraction V) containing 4 mg/mL protein in distilled water stored
frozen at -2OOC. Prepare standards by diluting the stock solution with
distilled water as follows:
Stock
solution, pL 0 1.25 2.50 6.25 12.5 25.0 62.5 125 250
Water, pL 500 499 498 494 488 475 438 375 250
Protein
cont., j.@mL 0 10 20
50 100 200 500 1000 2000
3. Method
1. To 0.1 mL of sample or standard (see Notes l-3), add 0.1 mL of 2N
NaOH. Hydrolyze at 100°C for 10 min in a heating block or boiling
water bath.
2. Cool the hydrolyzate to room temperature and add 1 mL of freshly
mixed complex-forming reagent. Let the solution stand at room tem-
perature for 10 min (see Notes 4 and 5).
3. Add 0.1 mL of Folin reagent, using a vortex mixer, and let the mixture
stand at room temperature for 30-60 min (do not exceed 60 min) (see
Note 6).
4. Read the absorbance at 750 nm if the protein concentration was below
500 pg/mL or at 550 nm if the protein concentration was between 100
and 2000 pg/mL.
5. Plot a standard curve of absorbance as a function of initial protein con-
centration and use it to determine the unknown protein concentrations
(see Notes 7-10).
4. Notes
1. If the sample is available as a precipitate, then dissolve the precipitate
in 2N NaOH and hydrolyze as in step 1. Carry 0.2~mL aliquots of the
hydrolyzate forward to step 2.
The Lowry Method
3
2. Whole cells or other complex samples may need pretreatment, as
described for the Burton assay for DNA (2). For example, the PCA/
ethanol precipitate from extraction I may be used directly for the Lowry
assay, or the pellets remaining after the PCA hydrolysis step (step 3 of
the Burton assay) may be used for Lowry. In this latter case, both DNA
and protein concentration may be obtained from the same sample.
3. Peterson (3) has described a precipitation step that allows the separa-
tion of the protein sample from interfering substances and also conse-
quently concentrates the protein sample, allowing the determination of
proteins in dilute solution. Peterson’s precipitation step is as follows:
a. Add 0.1 mL of 0.15% deoxycholate to 1 .O mL of protein sample.
b. Vortex, and stand at room temperature for 10 min.
c. Add 0.1 mL of 72% TCA, vortex, and centrifuge at lOOO-3000g
for 30 min.
d. Decant the supematant and treat the pellet as described in Note 1.
4. The reaction is very pH-dependent, and it is therefore important to
maintain the pH between 10 and 10.5. Take care, therefore, when ana-
lyzing samples that are m strong buffer outside this range.
5. The incubation period is not critical and can vary from 10 min to sev-
eral hours without affecting the final absorbance.
6. The vortex step is critical for obtaining reproducible results. The Folin
reagent is only reactive for a short time under these alkaline condi-
tions, being unstable in alkali, and great care should therefore be taken
to ensure thorough mixing.
7. The assay is not linear at higher concentrations. Ensure, therefore, that
you are analyzing your sample on the linear portion of the calibration
curve.
8. A set of standards is needed with each group of assays, preferably in
duplicate. Duplicate or triplicate unknowns are recommended.
9. One disadvantage of the Lowry method is the fact that a range of sub-
stances interferes with this assay, including buffers, drugs, nucleic acids,
and sugars. The effect of some of these agents is shown in Table 1 in
Chapter 2. In many cases, the effects of these agents can be minimized
by diluting them out, assuming that the protein concentration is suffi-
ciently high to still be detected after dilution. When interfering com-
pounds are involved, it is, of course, important to run an appropriate
blank. Interference caused by detergents, sucrose, and EDTA can be
eliminated by the addition of SDS (4).
10. Modifications to this basic assay have been reported that increase the
sensitivity of the reaction. If the Folin reagent is added in two portions,
vortexing between each addition, a 20% increase in sensitivity is
4 Waterborg and Matthews
achieved (5). The addition of dithiothreitol3 min after the addition of
the Folin reagent increases the sensitivity by 50% (6).
References
1. Lowry, 0. H., Rosebrough, N. J., Farr, A. L., and Randall, R. J. (195 1) Protein
measurement with the Folin phenol reagent. J. Biol. Chem. 193,265-275.
2. Waterborg, J. H. and Matthews, H. R. (1984) The Burton Assay for DNA, m
Methods in Molecular Biology, vol. 2: Nucleic Acids (Walker, J. M., ed.),
Humana, Totowa, NJ, pp. 1-3.
3. Peterson, G L. (1983) Determination of total protein. Methods Enzymol. 91,
95-121.
4. Markwell, M. A. K., Haas, S. M., Tolbert, N. E., and Bieber, L. L. (1981)
Protein determination in membrane and lipoprotein samples. Methods Enzymol.
72,296-303.
5 Hess, H. H., Lees, M B., and Derr, J. E. (1978) A linear Lowry-Folin assay for
both water-soluble and sodium dodecyl sulfate-solubilized proteins. Anal.
Biochem. 85,295-300.
6. Larson, E., Howlett, B., and Jagendorf, A. (1986) Artificial reductant
enhancement of the Lowry method for protein determination. Anal. Biochem.
155,243-248.
CHAPTER 2
The Bicinchoninic Acid (BCA) Assay
for Protein Quantitation
John M. Walker
1. Introduction
The bicinchoninic acid (BCA) assay, first described by Smith et al.
(1) is similar to the Lowry assay, since it also depends on the conver-
sion of Cu2+ to Cu+ under alkaline conditions (see Chapter 1). The
Cu+ is then detected by reaction with BCA. The two assays are of
similar sensitivity, but since BCA is stable under alkali conditions,
this assay has the advantage that it can be carried out as a one-step
process compared to the two steps needed in the Lowry assay. The
reaction results in the development of an intense purple color with an
absorbance maximum at 562 nm. Since the production of Cu+ in this
assay is a function of protein concentration and incubation time, the
protein content of unknown samples may be determined spectropho-
tometrically by comparison with known protein standards. A further
advantage of the BCA assay is that it is generally more tolerant to the
presence of compounds that interfere with the Lowry assay. In par-
ticular it is not affected by a range of detergents and denaturing agents
such as urea and guanidinium chloride, although it is more sensitive
to the presence of reducing sugars. Both a standard assay (0.1-1.0
mg protein/ml) and a microassay (0.5-10 ~18 protein/ml) are described.
2, Materials
2.1. Standard Assay
1, Reagent A: sodium bicinchoninate (0.1 g), Na2C03. Hz0 (2.0 g), sodium
tartrate (dihydrate) (0.16 g), NaOH (0.4 g), NaHC03 (0.95 g), made up
From* Methods in Molecular B!ology, Vol, 32: Basrc Protein and Peptide Protocols
Edited by* J M. Walker Copyright 01994 Humana Press Inc., Totowa, NJ
5
Walker
to 100 mL. If necessary, adjust the pH to 11.25 with NaHCOs or NaOH
(see Note 1).
2. Reagent B: CuS04. 5Hz0 (0.4 g) in 10 mL of water (see Note 1).
3. Standard working reagent (SWR): Mix 100 vol of regent A with 2 vol
of reagent B. The solution is apple green in color and is stable at room
temperature for 1 wk.
2.2. Microassay
1. Reagent A: Na&!O, .
Hz0 (0.8 g), NaOH (1.6 g), sodium tartrate
(dihydrate) (1.6 g), made up to 100 mL with water, and adjusted to pH
11.25 with 10M NaOH.
2. Reagent B: BCA (4.0 g) in 100 mL of water.
3. Reagent C: CuS04. 5H20 (0.4 g) in 10 mL of water.
4. Standard working reagent (SWR): Mix 1 vol of reagent C with 25 vol
of reagent B, then add 26 vol of reagent A.
3. Methods
3.1. Standard Assay
1. To a lOO+L aqueous sample containing lo-100 lo protein, add 2 mL
of SWR. Incubate at 60°C for 30 min (see Note 2).
2. Cool the sample to room temperature, then measure the absorbance at
562 nm (see Note 3).
3. A calibration curve can be constructed using dilutions of a stock 1 mg/
mL solution of bovine serum albumin (BSA) (see Note 4).
3.2. Microassay
1. To 1 .O mL of aqueous protein solution containing 0.5-l .O pg of pro-
tein/ml, add 1 mL of SWR.
2. Incubate at 60°C for 1 h.
3. Cool, and read the absorbance at 562 nm.
4.
Notes
1. Reagents A and B are stable indefinitely at room temperature. They
may be purchased ready prepared from Pierce, Rockford, IL.
2. The sensitivity of the assay can be increased by incubating the samples
longer. Alternatively, if the color is becoming too dark, heating can be
stopped earlier. Take care to treat standard samples similarly.
3. Following the heating step, the color developed is stable for at least 1 h.
4. Note, that like the Lowry assay, response to the BCA assay is depen-
dent on the amino acid composition of the protein, and therefore an
absolute concentration of protein cannot be determined. The BSA stan-
Table 1
Effect of Selected Potential Interfering Compound@
Sample (50 1.18 BSA)
m the following
BCA assay Lowry assay
(pg BSA found) (clg BSA found)
Water Interference Water Interference
blank blank blank blank
corrected corrected corrected corrected
50 pg BSA in water (reference)
O.lN HCl
0.1 N NaOH
0.2% Sodium azide
0.02% Sodium azrde
l.OM Sodium chloride
100 mM EDTA (4 Na)
50 mM EDTA (4 Na)
10 mM EDTA (4 Na)
50 mM EDTA (4 Na), pH 11 25
4.OM Guanidine HCl
3.OM Urea
1 O%Triton X-100
1.0% SDS (lauryl)
10% Brij 35
1 .O% Lubrol
1 .O% Chaps
1 .O% Chapso
1 .O% Octyl glucoside
40.0% Sucrose
10.0% Sucrose
1.0% Sucrose
100 mM Glucose
50 mM Glucose
10 mM Glucose
0 2M Sorbitol
0.2M Sorbitol, pH 11 25
1 OM Glycine
1 .OM Glycme, pH 11
0.5M Tris
0.25M Tris
O.lMTrls
0.25M Tris, pH 11 25
20.0% Ammonium sulfate
10 0% Ammonium sulfate
3.0% Ammonium sulfate
10.0% Ammonium sulfate, pH 11
2.OM Sodium acetate, pH 5 5
0 2M Sodium acetate, pH 5.5
1 .OM Sodmm phosphate
O.lM Sodium phosphate
O.lM Cesium bicarbonate
50.00 - 5000 -
50.70 50.80 44.20 43.80
49.00 49.40 50.60 50.60
51.10 50 90 49 20 49.00
51.10 51 00 49 50 49 60
51.30
51.10 50.20 50 10
No color
138.50 5.10
28.00 29.40 96.70 6.80
48.80 49.10 33.60 12.70
31 50 32.80 72.30 5.00
48.30 46.90 Precipitated
51.30 50.10 53.20 45.00
50.20 49.80 Precipitated
49.20 48.90 Precipitated
51.00 50 90 Precipitated
50.70 50.70 Precipitated
49 90
49.50
Precipitated
51.80 51.00 Precipitated
50.90 50.80 Precipitated
55.40
48.70 4.90 28.90
5250 50.50 4290 41 10
51 30 51.20 4840 48 10
245 00 57.10 68.10 61.70
144.00 47.70 62.70 58.40
70.00 49.10 52.60 51.20
42.90 37.80 63.70 31.00
40.70
36.20 68.60 26.60
No color 7.30 7.70
50.70 48.90 32.50 27.90
36.20 32.90 10.20 8.80
46.60 44.00 27.90 28.10
50.80 4960
38.90 38.90
52.00 50.30
4080 40.80
560 1.20 Precipitated
16.00 12.00 Precipitated
44.90 4200 21.20 21.40
48.10
45.20 3260 3280
35.50 34.50 5.40 3 30
50.80 5040
47.50 47.60
37.10
36.20 7.30 5.30
50 80 5040
46.60 46.60
49.50 49.70 Precipitated
aReproduced from ref. I with permission from Academic Press Inc.
Walker
dard curve can only therefore be used to compare the relative protein
concentration of similar protein solutions.
5. Some reagents interfere with the BCA assay, but nothing like as many
as with the Lowry assay (see Table 1). The presence of lipids gives
excessively high absorbances with this assay (2). Variations produced
by buffers with sulfhydryl agents and detergents have been described (3).
6. Since the method relies on the use of Cu2+, the presence of chelating
agents such as EDTA will of course severely interfere with the method.
However, it may be possible to overcome such problems by diluting
the sample as long as the protein concentration remains sufficiently
high to be measurable. Similarly, dilution may be a way of coping with
any agent that interferes with the assay (see Table 1). In each case it is
of course necesary to run an approprrate control sample to allow for
any residual color development. A modificatton of the assay has been
described that overcomes liptd interference when measuring hpopro-
tein protein content (4).
7. A modification of the BCA assay, utilizing a nucrowave oven, has been
described that allows protein determination in a matter of seconds (5).
References
1. Smith, P. K., Krohn, R. I , Hermanson, G. T., Mallia, A. K., Gartner, F. H.,
Provenzano, M. D., Fujimoto, E. K., Goeke, N. M., Olson, B. J., and Klenk, D.
C. (1985) Measurement of protein using bicinchommc acid. Anal. Biochem.
150,76-85.
2. Kessler, R. J. and Fanestil, D. D. (1986) Interference by lipids in the determi-
nation of protein using bicinchoninic acid. Anal. Biochem.
159, 138-142.
3. Hill, H. D. and Straka, J. G. (1988) Protein determination using bicmchoninic
acid in the presence of sulfhydryl reagents. Anal. Biochem.
170,203-208.
4. Morton, R. E. and Evans, T. A. (1992) Modification of the BCA protein assay
to eliminate lipid interference m determining lipoprotein protein content. Anal
Biochem. 204332-334.
5. Akins, R. E. and Tuan, R S. (1992) Measurement of protein in 20 seconds
using a microwave BCA assay. BioTechniques
12(4), 496-499.
&IAP!FER
3
The Bradford Method
for Protein Quantitation
Nicholas J. Buger
1. Introduction
A rapid and accurate method for the estimation of protein concen-
tration is essential in many fields of protein study. An assay origi-
nally described by Bradford (I) has become the preferred method for
quantifying protein in many laboratories. This technique is simpler,
faster, and more sensitive than the Lowry method. Moreover, when
compared with the Lowry method, it is subject to less interference by
common reagents and nonprotein components of biological samples
(see Note 1).
The Bradford assay relies on the binding of the dye Coomassie
blue G250 to protein. The cationic form of the dye, which predomi-
nates in the acidic assay reagent solution, has a h max of 470 nm. In
contrast, the anionic form of the dye, which binds to protein, has a h
max of 595 nm (2). Thus, the amount of dye bound to the protein can
be quantified by measuring the absorbance of the solution at 595 nm.
The dye appears to bind most readily to arginyl residues of pro-
teins (but does not bind to the free amino acid) (2). This specificity
can lead to variation in the response of the assay to different proteins,
which is the main drawback of the method. The original Bradford
assay shows large variation in response between different proteins
(3-5). Several modifications to the method have been developed to
overcome this problem (see Note 2). However, these changes gener-
ally result in a less robust assay that is often more susceptible to
From:
Methods m Molecular B/ology, Vol 32. Basic Prorem and Pepbde Protocols
Edlted by J M Walker Copyright 01994 Humana Press Inc., Totowa, NJ
9
Kruger
interference by other chemicals. Consequently, the original method
devised by Bradford remains the most convenient and widely used
formulation. Two types of assay are described here: the standard assay,
which is suitable for measuring between lo-100 B protein, and the
microassay for detecting between l-10 pg protein.
2. Materials
1. Reagent: The assay reagent is made by dissolving 100 mg of Coo-
massie blue G250 m 50 rnL of 95% ethanol. The solution is then mixed
with 100 mL of 85% phosphoric acid and made up to 1 L with distilled
water (see Note 3).
The reagent should be filtered through Whatman No. 1 filter paper
and then stored in an amber bottle at room temperature. It is stable for
several weeks. However, during this time dye may precipitate from the
solution and so the stored reagent should be filtered before use.
2. Protein standard (see Note 4). Bovine y-globulin at a concentration of
1 mg/mL (100 pg/mL for the microassay) in distilled water is used as
a stock solution. This should be stored frozen at -2OOC. Since motsture
content of solid protein may vary during storage, the precise concen-
tration of protein in the standard solution should be determined from
its absorbance at 280 nm. The absorbance of a 1 mg/mL solu-
tion of y-globulin, in a l-cm light path, is 1.35. The corresponding
values for two alternative protein standards, bovine serum albumin and
ovalbumin, are 0.66 and 0.75, respectively.
3. Plastic and glassware used in the assay should be absolutely clean and
detergent-free. Quartz (silica) spectrophotometer cuvets should not be
used, since the dye binds to this material. Traces of dye bound to
glassware or plastic can be removed by rinsing with methanol or deter-
gent solution.
3. Methods
3.1. Standard Assay Method
1. Pipet between 10 and 100 clg of protein m 100 pL total volume mto a test
tube. If the approximate sample concentration is unknown, assay a range
of dilutions (1, l/10, 1/100,1/1000). Prepare duplicates of each sample.
2. For the calibration curve, pipet duplicate volumes of 10, 20, 40, 60,
80, and 100 pL of 1 mg/mL y-globulin standard solution mto test tubes,
and make each up to 100 pL with distilled water. Pipet 100 pL of dis-
tilled water into a further tube to provide the reagent blank.
The Bradford Method 22
3. Add 5 mL of protem reagent to each tube and mix well by inversion or
gentle vortexing. Avoid foaming, which will lead to poor reproducibility.
4. Measure the Asg5 of the samples and standards against the reagent blank
between 2 min and 1 h after mixing (see Note 5). The 100 pg standard
should give an A595
value of about 0.4. The standard curve is not linear
and the precise absorbance varies depending on the age of the assay
reagent. Consequently, it is essential to construct a calibration curve
for each set of assays (see Note 6).
3.2. Microassay Method
This form of the assay is more sensitive to protein. Consequently,
it is useful when the amount of the unknown protein is limited (see
Note 7).
1. Pipet duplicate samples containing between l-10 pg in a total volume
of 100 pL into 1 S-mL polyethylene microfuge tubes. If the approximate
sample concentration is unknown, assay a range of dilutions (1, l/10,
l/100, l/1000).
2. For the calibration curve, pipet duplicate volumes of 10, 20, 40, 60,
80, and 100 pL of 100 pg/rnL y-globulin standard solution into micro-
fuge tubes, and adjust the volume to 100 pL with water. Pipet 100 pL
of distilled water into a tube for the reagent blank.
3. Add 1 mL of protein reagent to each tube and mix gently, but thor-
oughly. Measure the absorbance of each sample between 2-60 min
after addition of the protein reagent. The Asg5 value of a sample con-
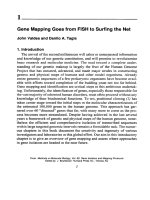
taming 10 pg y-globulin is 0.45. Figure 1 shows the response of three
common protein standards using the microassay method.
4. Notes
1. The Bradford assay is relatively free from interference by most com-
monly used biochemical reagents. However, a few chemicals may sig-
nificantly alter the absorbance of the reagent blank or modify the
response of proteins to the dye (Table 1). The materials that are most
likely to cause problems in biological extracts are detergents and
ampholytes (2,6). These should be removed from the sample solution,
for example, by gel filtration or dialysis. Alternatively, they should be
included in the reagent blank and calibration standards at the same
concentration as in the sample. The presence of base in the assay
increases absorbance by shifting the equilibrium of the free dye toward
the anionic form. This may present problems when measuring protein
12 Kruger
1.0
E
= 0.8 -
m
0.
zi
.,a 0.6 -
/
0
d
0 2
4 6 8 10
Protein content (c(g)
Fig. 1. Variation in the response of proteins in the Bradford assay. The extent of
protein-dye complex formation was determined for bovine serum albumin
( W), y-globulin (O), and ovalbumin (A) using the microassay. Each value is the
mean of four determinations. These data allow comparisons to be made between
estimates of protein content obtained using these protein standards.
content in concentrated basic buffers (2). Guanrdine hydrochloride and
sodium ascorbate compete with dye for protein, leading to underesti-
mation of the protein content (2).
2. The assay technique described here is subject to variation in sensitiv-
ity between individual proteins (see Table 2). Several modifications
have been suggested that reduce this variability (3-57). Generally, these
rely on increasing either the dye content or the pH of the solution. In
one variation, adjusting the pH by adding NaOH to the reagent improves
the sensitivity of the assay and greatly reduces the variation observed
with different proteins (5). However, the optimum pH is critically
dependent on the source and concentration of the dye (see Note 3).
Moreover, the modified assay 1s far more sensitive to interference from
detergents in the sample.
3. The amount of soluble dye in Coomassie blue G250 varies consider-
ably between sources, and suppliers’ figures for dye purity are not a
reliable estimate of the Coomassie blue G250 content (8). Generally,
Serva blue G is regarded to have the greatest dye content and should be
used in the modified assays discussed in Note 2. However, the quality
of the dye is not critical for routine protein determmation using the
The Bradford Method 13
Table 1
Effects of Common Reagents on the Bradford Assaya
Absorbance at 600 nm
Compound Blank 5 ~18 Immunoglobulin
Control 0.005 0.264
0.02% SDS 0.003 0.250
0.1% SDS 0.042* 0.059*
0.1% Triton 0.000 0.278
0.5% Triton 0.051” 0.311*
1M P-Mercaptoethanol 0.006 0.273
1M Sucrose 0.008 0.261
4M Urea
0.008 0.261
4M NaCl -0.015 O-207*
Glycerol 0 014 0.238*
O.lM HEPES (pH 7.0) 0.003 0.268
O.lM Tris (pH 7.5) -0.008 0.261
O.lM Citrate (pH 5.0) 0.015 0.249
10 mM EDTA 0.007 0.235*
1M W-bhSO4
0.002 0 269
OData were obtained by mixing 5 pL of sample with 5 pL+ of the
specified compound before adding 200 w of dye-reagent. Data taken
from ref. 5.
*The asterisks indicate measurements that differ from the control by
more than 0.02 absorbance unit for blank values or more than 10% for
the samples contaming protem.
method described m this chapter. The data presented in Fig. 1 were
obtained using Coomassie brilliant blue G (C.I. 42655; Product code
B-0770, Sigma Chemical Co., St. Louis, MO).
4. Whenever possible the protein used to construct the calibration curve
should be the same as that being determined. Often this is impractical
and the dye-response of a sample is quantified relative to that of a
“generic” protein. Bovine serum albumin is commonly used as the pro-
tein standard because it is inexpensive and readily available in a pure
form. The major argument for using this protein is that it allows the
results to be compared directly with those of the many previous stud-
ies that have used bovine serum albumin as a standard. However, it
suffers from the disadvantage of exhibiting an unusually large dye-
response in the Bradford assay and, thus, may underestimate the pro-
tein content of a sample. Increasingly, bovine y-globulin is being
advanced as a more suitable general standard since the dye bmdmg
14
Kruger
Table 2
Comparison of the Response
of Different Proteins in the Bradford Assay
Relative absorbance
Protein0
Assay 1 Assay 2
Myelin basic protein
139 -
Histone 130 175
Cytochrome c 128 142
Bovine serum albumin 100 100
Insulin 89 -
Transferrin
82 -
Lysozyme 73 -
a-Chymotrypsinogen 55 -
Soybean trypsin inhibitor 52 23
Ovalbumin 49 23
y-Globulin 48 55
P-Lactoglobulin A
20 -
Trypsin 18 15
Aprotinin 13 -
Gelatin - 5
Gramrcidin S 5 -
aFor each protein, the response is expressed relative to that of
the same concentration of bovme serum albumin. The data for
Assays 1 and 2 are recalculated from refs. 3 and 5, respectively.
capacity
of this protein is closer to the mean of those protems that have
been compared (Table 2). Because of this variation, it is essential to
specify the protein standard used when reporting measurements of pro-
tein amounts using the Bradford assay.
5. Generally, it is preferable to use a single new disposable polystyrene
semimicro cuvet that is discarded after a series of absorbance mea-
surements. Rinse the cuvet with reagent before use, zero the spectro-
photometer on the reagent blank and then do not remove the cuvet
from the machine. Replace the sample in the cuvet gently usmg a dis-
posable polyethylene pipet.
6. The standard curve is nonlinear at high protein levels because the
amount of free dye becomes depleted. If this presents problems, the
linearity of the assay can be improved by plotting the ratio of
absorbances at 595 and 465 nm, which corrects for depletion of the
free dye (9).
The
Bradford
Method 25
7. For routine measurement of the protein content of many samples the
microassay may be adapted for use with a microplate reader (5,10).
The total volume of the modified assay is limited to 210 @ by reduc-
ing the volume of each component. Ensure effective mixing of the assay
components by pipeting up to 10 w of the protein sample into each
well before adding 200 pL of the dye-reagent.
References
1. Bradford, M. M. (1976) A rapid and sensitive method for the quantitation of
microgram quantittes of protein utilizing the principle of protein-dye binding.
Anal. Biochem. 72,248-254.
2. Compton, S. J. and Jones, C. G (1985) Mechanism of dye response and mter-
ference in the Bradford protein assay. Anal. Biochem. 151,369-374.
3. Friendenauer, S. and Berlet, H. H. (1989) Sensitivity and variability of the Bradford
protein assay in the presence of detergents. Anal. Biochem. 178,263-268.
4. Reade, S. M. and Northcote, D. H. (1981) Minimization of variation in the
response to different proteins of the Coomassie blue G dye-binding assay for
protein. Anal Biochem. 116,53-64.
5. Stoscheck, C. M. (1990) Increased uniformity m the response of the Coomassie
blue protein assay to different proteins. Anal. Btochem. 184, 111-I 16.
6. Spector, T. (1978) Refinement of the Coomassie blue method of protein quan-
titation. A simple and linear spectrophotometric assay for <OS to 50 pg of
protein. Anal. Biochem. 86, 142-146.
7. Peterson, G. L. (1983) Coomassie blue dye binding protein quantrtation method,
in Methods in Enzymology, vol. 91 (Hirs, C. H. W. and Timasheff, S. N., eds.),
Academic, New York, pp. 95-l 19.
8. Wilson, C. M. (1979) Studies and critique of Amido black lOB, Coomassie
blue R and Fast green FCF as stains for proteins after polyacrylamide gel elec-
trophoresis. Anal. Biochem. 96,263-278.
9. Sedmak, J. J and Grossberg, S. E. (1977) A rapid, sensitive and versatile
assay for protein using Coomassie brilliant blue G250. Anal. Biochem. 79,
544-552.
10. Redinbaugh, M. G. and Campbell, W. H. (1985) Adaptation of the dye-bind-
ing protein assay to microtiter plates. Anal. Biochem. 147, 144-147.
4
Nondenaturing Polyacrylamide
Gel Electrophoresis of Proteins
John M. Walker
1. Introduction
SDS-PAGE (Chapter 5) is probably the most commonly used gel
electrophoretic system for analyzing proteins. However, it should be
stressed that this method separates denatured protein. Sometimes one
needs to analyze native, nondenatured proteins, particularly if want-
ing to identify a protein in the gel by its biological activity (for example,
enzyme activity, receptor binding, antibody binding, and so on). On
such occasions it is necessary to use a nondenaturing system such as
described in this chapter. For example, when purifying an enzyme, a
single major band on a gel would suggest a pure enzyme. However
this band could still be a contaminant; the enzyme could be present
as a weaker (even nonstaining) band on the same gel. Only by show-
ing that the major band had enzyme activity would you be convinced
that this band corresponded to your enzyme. The method described
here is based on the gel system first described by Davis (1). To enhance
resolution a stacking gel can be included (see Chapter 5 for the theory
behind the stacking gel system).
2. Materials
1. Stock acrylamide solution: 30 g acrylamide, 0.8 g his-acrylamide. Make
up to 100 mL in distilled water and filter. Stable at 4°C for months (see
Note 1).
Care: Acrylamide Monomer Is a Neurotoxin.
Take care in
handling acrylamide (wear gloves) and avoid breathing in acrylamide
dust when weighing out.
From Methods m Molecular Biology, Vool. 32: Basrc Protein and PeptIde Protocols
Edlted by. J M Walker CopyrIght 01994 Humana Press Inc., Totowa, NJ
17
18 Walker
2. Separating gel buffer: 1.5M Tris-HCl, pH 8.8.
3. Stacking gel buffer: 0.5M Tris-HCI, pH 6.8.
4. 10% Ammonium pet-sulfate in water.
5. N,N,N’,N’-tetramethylethylenediamine (TEMED).
6. Sample buffer (5X). Mix the following:
a. 15.5 mL of 1M Tris-HCl pH 6.8;
b. 2.5 mL of a 1% solution of bromophenol blue;
c. 7 mL of water; and
d. 25 mL of glycerol.
Solid samples can be dissolved directly in 1X sample buffer. Samples
already in solution should be diluted accordingly with 5X sample buffer
to give a solution that is 1X sample buffer. Do not use protein solutions
that are in a strong buffer that is not near to pH 6.8 as it is important
that the sample is at the correct pH. For these samples it will be neces-
sary to dialyze against 1X sample buffer.
7. Electrophoresrs buffer: Dissolve 3.0 g of Tris base and 14.4 g of gly-
cme m water and adjust the volume to 1 L. The final pH should be 8.3.
8. Protein stain: 0.25 g Coomassre brilliant blue R250 (or PAGE blue
83), 125 mL methanol, 25 mL glacial acetrc acid, and 100 mL water.
Dissolve the dye in the methanol component first, then add the acid
and water. Dye solubility is a problem rf a different order is used. Fil-
ter the solution if you are concerned about dye solubility. For best results
do not reuse the stain,
9. Destaining solution: 100 mL methanol, 100 mL glacial acetic acid,
and 800 mL water.
10. A microsyringe for loading samples.
3. Method
1. Set up the gel cassette.
2. To prepare the separating gel (see Note 2) mix the following in a
Buchner flask: 7.5 mL stock acrylamide solution, 7.5 mL separating
gel buffer, 14.85 mL water, and 150 pL 10% ammonium persulfate.
“Degas” this solution under vacuum for about 30 s. This degassing
step is necessary to remove dissolved air from the solution, since oxy-
gen can inhibit the polymerization step. Also, if the solution has not
been degassed to some extent, bubbles can form in the gel during poly-
merization, which will ruin the gel. Bubble formation is more of a prob-
lem in the higher percentage gels where more heat is liberated during
polymerization.
3. Add 15 pL of TEMED and gently swirl the flask to ensure even mix-
mg. The addition of TEMED will initiate the polymerrzation reaction,
Electrophoresis
of
Proteins 19
and although it will take about 20 min for the gel to set, this time can
vary depending on room temperature, so it is advisable to work fairly
quickly at this stage.
4. Using a Pasteur (or larger) pipet, transfer the separating gel mixture to
the gel cassette by running the solution carefully down one edge between
the glass plates. Continue adding this solution until it reaches a posi-
tion 1 cm from the bottom of the sample loading comb.
5. To ensure that the gel sets with a smooth surface, very cavefully run
distilled water down one edge into the cassette using a Pasteur pipet.
Because of the great difference in density between the water and the
gel solution, the water will spread across the surface of the gel without
serious mixing. Continue adding water until a layer about 2 mm exists
on top of the gel solution.
6. The gel can now be left to set. When set, a very clear refractive index
change can be seen between the polymerized gel and overlaying water.
7. While the separating gel is setting, prepare the following stacking gel
solution. Mix the following quantities in a Buchner flask: 1.5 mL stock
acrylamide solution, 3.0 mL stacking gel buffer, 7.4 mL water, and
100 pL 10% ammonium persulfate. Degas this solution as before.
8. When the separating gel has set, pour off the overlaying water. Add 15
pL of TEMED to the stacking gel solution and use some (-2 mL) of
this solution to wash the surface of the polymerized gel. Discard this
wash, then add the stacking gel solution to the gel cassette until the
solution reaches the cutaway edge of the gel plate. Place the well-
forming comb into this solution and leave to set. This will take about
30 min. Refractive index changes around the comb indicate that the
gel has set. It is useful at this stage to mark the positions of the bottoms
of the wells on the glass plates with a marker pen.
9. Carefully remove the comb from the stacking gel, remove any spacer
from the bottom of the gel cassette, and assemble the cassette in the
electrophoresis tank. Fill the top reservoir with electrophoresis buffer
ensuring that the buffer fully fills the sample loading wells, and look
for any leaks from the top tank. If there are no leaks, fill the bottom
tank with electrophoresis buffer, then tilt the apparatus to dispel any
bubbles caught under the gel.
10. Samples can now be loaded onto the gel. Place the syringe needle
through the buffer and locate it just above the bottom of the well. Slowly
deliver the sample (-5-20 pL) into the well. The dense sample solvent
ensures that the sample settles to the bottom of the loading well.
Continue in this way to fill all the wells with unknowns or standards,
and record the samples loaded.
20 Walker
11. The power pack is now connected to the apparatus and a current of 20-
25 mA passed through the gel (constant current) (see Note 3). Ensure
that the electrodes are arranged so that the proteins are running to the
anode (see Note 4). In the first few minutes the samples will be seen to
concentrate as a sharp band as it moves through the stacking gel. (It is
actually the bromophenol blue that one is observing, not the protein
but, of course, the protein is stacking in the same way.) Continue elec-
trophoresis until the bromophenol blue reaches the bottom of the gel.
This will usually take about 3 h. Electrophoresis can now be stopped
and the gel removed from the cassette. Remove the stacking gel and
immerse the separating gel in stain solution, or proceed to step 13 if
you wish to detect enzyme activity (see Notes 5 and 6).
12. Staining should be carried out, with shaking, for a minimum of 2 h and
preferably overnight. When the stain is replaced with destain, stronger
bands will be immediately apparent and weaker bands will appear as
the gel destains. Destaining can be speeded up by using a foam bung,
such as those used in microbiological flasks. Place the bung in the
destain and squeeze it a few times to expel air bubbles and ensure the
bung is fully wetted. The bung rapidly absorbs dye, thus speeding up
the destaining process.
13. If proteins are to be detected by their biological activity, duplicate
samples should be run. One set of samples should be stained for protein
and the other set for activity. Most commonly one would be looking
for enzyme activity in the gel. This is achieved by washing the gel in
an appropriate enzyme substrate solution that results in a colored product
appearing in the gel at the site of the enzyme activity (see Note 7).
4. Notes
1. The stock acrylamide used here is the same as used for SDS gels (see
Chapter 5) and may already be availabe in your laboratory.
2. The system described here is for a 7.5% acrylamide gel, which was
originally described for the separation of serum proteins (I). Since sepa-
ration in this system depends on both the native charge on the protein
and separation according to size owmg to frictional drag as the proteins
move through the gel, it is not possible to predict the electrophoretic
behavior of a given protein the way that one can on an SDS gel, where
separation is based on size alone. A 7.5% gel is a good starting point
for unknown proteins. Proteins of mol wt >lOO,OOO should be sepa-
rated in 3-5% gels. Gels in the range 5-10% will separate proteins in
the range 20,000-150,000, and lo-15% gels will separate proteins in
the range lO,OOO-80,000. The separation of smaller polypeptides is
Electrophoresis
of
Proteins 21
described in Chapter 8. To alter the acrylamide concentration, adjust
the volume of stock acrylamide solution m Section 3., step 2 accord-
ingly, and increase/decrease the water component to allow for the
change in volume. For example, to make a 5% gel change the stock
acrylamide to 5 mL and increase the water to 17.35 mL. The final vol-
ume is still 30 mL, so 5 mL of the 30% stock acrylamide solution has
been diluted in 30 mL to grve a 5% acrylamide solution.
3. Because we are separating native proteins, it is important that the gel
does not heat up too much, since this could denature the protein in the
gel, It is advisable therefore to run the gel in the cold room, or to circu-
late the buffer through a cooling coil in ice. (Many gel apparatus are
designed such that the electrode buffer cools the gel plates.) If heating
is thought to be a problem it is also worthwhile to try running the gel at
a lower current for a longer time.
4. This separating gel system is run at pH 8.8. At this pH most proteins
will have a negative charge and will run to the anode. However, it must
be noted that any basic proteins will migrate in the opposite direction
and will be lost from the gel. Basic proteins are best analyzed under
acid conditrons, as described in Chapter 7.
5. It is important to note that concentration m the stacking gel may cause
aggregation and precipitation of proteins. Also, the pH of the stacking
gel (pH 6.8) may affect the activity of the protein of interest. If this is
thought to be a problem (e.g., the protein cannot be detected on the
gel), prepare the gel without a stacking gel. Resolution of proteins will
not be quite so good, but will be sufficient for most uses.
6. If the buffer system described here is unsuitable (e.g., the protein of
interest does not electrophorese into the gel because it has the incor-
rect charge, or precipitates in the buffer, or the buffer is incompatible
with your detection system) then one can try different buffer systems
(without a stacking gel). A comprehensive list of alternative buffer
systems has been published (2).
7. The most convenient substrates for detecting enzymes in gels are small
molecules that freely diffuse into the gel and are converted by the
enzyme to a colored or fluorescent product within the gel. However,
for many enzymes such convenient substrates do not exist, and it 1s
necessary to design a linked assay where one includes an enzyme
together with the substrate such that the products of the enzymatic
reaction of interest is converted to a detectable product by the enzyme
included with the substrate. Such linked assays may require the use of
up to two or three enzymes and substrates to produce a detectable prod-
uct. In these cases the product is usually formed on the surface of the
22
Walker
gel because the coupling enzymes cannot easily diffuse into the gel. In
this case the zymogram technique is used where the substrate mix is
added to a cooled (but not solidified) solution of agarose (1%) in the
appropriate buffer. This is quickly poured over the solid gel where it
quickly sets on the gel. The product of the enzyme assay is therefore
formed at the gel-gel interface and does not get washed away. A num-
ber of review articles have been published which described methods
for detecting enymes in gels (3-7). A very useful list also appears as an
appendix m ref. 8.
8. In addition to the specific problems identified above, the technique is
susceptible to the normal problems associated with any polyacrylamide
gel electrophoresis system. These problems and the identification of
their causes are described in Table 1, Chapter 5.
References
1. Davis, B. J. (1964) Disc electrophoresis II-method and application to human
serum proteins. Ann. NY Acad. Sci. 121,404-427.
2. Andrews, A. T. (1986) Electrophoreszs. Theory, Techniques, and Biochem-
ical and Clinical Applications. Clarendon, Oxford, UK.
3. Shaw, C. R. and Prasad, R. (1970) Gel electrophoresis of enzymes-a compil-
ation of recipes. Biochem. Genet. 4,297-320.
4. Shaw, C. R. and Koen, A. L. (1968) Starch gel zone electrophoresis of enzymes,
in Chromatographic and Electrophoretic Techniques, vol. 2 (Smith, I., ed.),
Heinemann, London, pp. 332-359.
5. Harris, H. and Hopkinson, D. A. (eds.) (1976) Handbook of Enzyme Electro-
phoresis in Human Genetics. North-Holland, Amsterdam.
6. Gabriel, 0. (1971) Locating enymes on gels, in Methods in Enzymology, vol.
22 (Colowick, S. P. and Kaplan, N. O., eds.), Academic, New York, p. 578.
7 Gabriel, 0. and Gersten, D. M. (1992) Staining for enzymatic activity after gel
electrophoresis. I. Analyt. Biochem. 203, 1-21.
8. Hames, B. D. and Rickwood, D. (1990) Gel Electrophoresis
of
Proteins, 2nd
ed., IRL, Oxford and Washington
&IAI’TER 5
SDS Polyacrylamide Gel
Electrophoresis of Proteins
Bryan John Smith
1. Introduction
Probably the most widely used technique for analyzing mixtures
of proteins is SDS polyacrylamide gel electrophoresis. In this tech-
nique, proteins are reacted with the anionic detergent, sodium
dodecylsulfate (SDS, or sodium lauryl sulfate) to form negatively
charged complexes. The amount of SDS bound by a protein, and so
the charge on the complex, is roughly proportional to its size. Com-
monly, about 1.4 g SDS is bound per 1 g protein, although there are
exceptions to this rule. The proteins are generally denatured and solu-
bilized by their binding of SDS, and the complex forms a prolate
elipsoid or rod of length roughly proportionate to the protein’s mol
wt. Thus, proteins of either acidic or basic pZ form negatively charged
complexes that can be separated on the bases of differences in charges
and sizes by electrophoresis through a sieve-like matrix of polyacryl-
amide gel.
This is the basis of the SDS gel system, but it owes its popularity
to its excellent powers of resolution that derive from the use of a
“stacking gel.” This system employs the principles of isotachophoresis,
which effectively concentrates samples from large volumes (within
reason) into very small zones, that then leads to better separation of
the different species. The system is set up by making a stacking gel
on top of the “separating gel,” which is of a different pH. The sample
is introduced to the system at the stacking gel. With an electric field
From: Methods m Molecular Biology, Vol 32: Basic Protein and Pepbde Protocols
Edlted by J M Walker Copyright 01994 Humana Press Inc , Totowa, NJ
23
24 Smith
applied, ions move towards the electrodes, but at the pH prevailing in
the stacking gel, the protein-SDS complexes have mobilities inter-
mediate between the Cl- ions (present throughout the system) and
glycinate ions (present in the reservoir buffer). The Cl- ions have the
greatest mobility. The following larger ions concentrate into narrow
zones in the stacking gel, but are not effectively separated there. When
the moving zones reach the separating gel, their respective mobilities
change in the pH prevailing there and the glycinate ion front over-
takes the protein-SDS complex zones to leave them in a uniformly
buffered electric field to separate from each other according to size
and charge, More detailed treatments of the theory of isotachophoresis
and electrophoresis generally are available in the literature (e.g., I).
The system of buffers used in the gel system desrcibed below is
that of Laernmli (2), and is used in a polyacrylamide gel of slab shape.
This form allows simultaneous electrophoresis of more than one
sample, and thus is ideal for comparative purposes.
2. Materials
1. The apparatus required may be made in the workshop, say, to Studier’s
design (3), or is available from commercial sources. For safety rea-
sons, the design should deny access to the gel or buffers while the
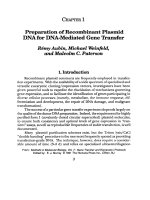
circuit is complete. The gel is prepared and run in a narrow chamber
formed by two glass plates separated by spacers of narrow strips of
perspex or other suitable material, arranged on the side and bottom
edges of the plates as indicated in Fig. 1. The thickness of the spacers clearly
dictates the thickness of the gel. The sample wells into which the sam-
ples are loaded are formed by a template “comb” that extends across
the top of the gel and is of the same thickness as the spacers. Typically,
the “teeth” on this comb will be 1 cm long, 2-10 mm wide, and sepa-
rated by 3 mm. The chamber may be sealed along its edges with white petro-
leumjelly (Vaseline), sticky tape (electrical insulation tape), or silicone
rubber tubing between the glass plates. A dc power supply is required.
2. Stock solutions. Chemicals should be analytical reagent (Analar) grade
and water should be distilled. Stock solutions should all be filtered.
Cold solutions should be warmed to room temperature before use.
a. Stock acrylamide solutron (total acrylamide content, %T = 30%
w/v, ratio of crosslmking agent to acrylamide monomer, %C = 2.7%
w/w): 73 g acrylamide and 2 g his-acrylamide. Dissolve and make
SDS-PAGE
of
Proteins
25
GLASS PLATES
- STACKING QEL
31 cm
Frg. 1. The constructron of a slab gel, showing the positions of the glass plates,
the spacers, and the comb.
up to 250 mL in water. This stock solution is stable for weeks in
brown glass, at 4OC.
b. Stock separating gel buffer: 1.0 g SDS and 45.5 g Tris buffer [2-
amino-2-(hydroxymethyl)- propane-l ,3-dial]. Dissolve m ~250 mL
of water, adjust the pH to 8.8 with HCl, and make the volume to 250
rnL. This stock solution is stable for months at 4OC.
c. Stock ammonium persulfate: 1 .O g ammonium persulfate. Dissolve
in 10 mL of water. This stock solution is stable for weeks in brown
glass, at 4°C.
d. Stock stacking gel buffer: 1.0 g SDS and 15.1 g Tris base. Dissolve
in ~250 mL of water, adjust the pH to 6.8 with HCl, and make up to
250 mL. Check the pH before use. This stock solution is stable for
months at 4OC.
e. Reservoir buffer (0.192M glycine, 0.025M Tris, 0.1% [w/v] SDS):
28.8 g glycine, 6.0 g Tris base, and 2.0 g SDS. Dissolve and make to