Identification of quantitative trait loci for phosphorus use efficiency traits in rice using a high density SNP map
Bạn đang xem bản rút gọn của tài liệu. Xem và tải ngay bản đầy đủ của tài liệu tại đây (1.46 MB, 15 trang )
Wang et al. BMC Genetics (2014) 15:155
DOI 10.1186/s12863-014-0155-y
RESEARCH ARTICLE
Open Access
Identification of quantitative trait loci for
phosphorus use efficiency traits in rice using a
high density SNP map
Kai Wang1,2, Kehui Cui1,2*, Guoling Liu1,2, Weibo Xie1, Huihui Yu1, Junfeng Pan2,3, Jianliang Huang1,2, Lixiao Nie1,2,
Farooq Shah1,2,4 and Shaobing Peng1,2
Abstract
Background: Soil phosphorus (P) deficiency is one of the major limiting factors to crop production. The
development of crop varieties with improved P use efficiency (PUE) is an important strategy for sustainable
agriculture. The objectives of this research were to identify quantitative trait loci (QTLs) linked to PUE traits using a
high-density single nucleotide polymorphism (SNP) map and to estimate the epistatic interactions and environmental
effects in rice (Oryza sativa L.).
Results: We conducted a two-year field experiment under low and normal P conditions using a recombinant inbred
population of rice derived from Zhenshan 97 and Minghui 63 (indica). We investigated three yield traits, biomass
(BIOM), harvest index (HI), and grain yield (Yield), and eight PUE traits: total P uptake (PUP), P harvest index (PHI), grain P
use efficiency (gPUE) based on P accumulation in grains, straw P use efficiency (strPUE) based on P accumulation in
straw, P use efficiency for biomass (PUEb) and for grain yield (PUEg) based on P accumulation in the whole plant, P
translocation (PT), and P translocation efficiency (PTE). Of the 36 QTLs and 24 epistatic interactions identified, 26 QTLs
and 12 interactions were detected for PUE traits. The environment affected seven QTLs and three epistatic interactions.
Four QTLs (qPHI1 and qPHI2 for PHI, qPUEg2 for PUEg, and qPTE8 for PTE) with strong effects were environmentally
independent. By comparing our results with similar QTLs in previous studies, three QTLs for PUE traits (qPUP1 and
qPUP10 for PUP, and qPHI6 for PHI) were found across various genetic backgrounds. Seven regions were shared by QTLs
for yield and PUE traits.
Conclusion: Most QTLs linked to PUE traits were different from those linked to yield traits, suggesting different genetic
controls underlying these two traits. Those chromosomal regions with large effects that are not affected by different
environments are promising for improving P use efficiency. The seven regions shared by QTLs linked to yield and PUE
traits imply the possibility of the simultaneous improvement of yield and PUE traits.
Keywords: Genotype by environment interaction, Phosphorus use efficiency, Quantitative trait loci, Recombinant
inbred lines, Rice, Single nucleotide polymorphism
* Correspondence:
1
National Key Laboratory of Crop Genetic Improvement, Huazhong Agricultural
University, Wuhan 430070, Hubei, China
2
MOA Key Laboratory of Crop Ecophysiology and Farming System in the
Middle Reaches of the Yangtze River, College of Plant Science and
Technology, Huazhong Agricultural University, Wuhan 430070, Hubei, China
Full list of author information is available at the end of the article
© 2014 Wang et al.; licensee Biomed Central. This is an Open Access article distributed under the terms of the Creative
Commons Attribution License ( which permits unrestricted use, distribution, and
reproduction in any medium, provided the original work is properly credited. The Creative Commons Public Domain
Dedication waiver ( applies to the data made available in this article,
unless otherwise stated.
Wang et al. BMC Genetics (2014) 15:155
Background
Phosphorus (P) is an important nutrient for crops. Low
levels of available P in soils and P use efficiency (PUE)
are becoming the two major constraints for crop production. The addition of P to soils increases crop production costs, exhausts non-renewable P resources, and
causes environmental problems [1-3]. Therefore, it is desirable to develop cultivars with high PUE.
Phosphorus use efficiency is improved by increasing
both P uptake and use efficiencies [3,4]. For crops, P deficiency may be attributed to low total P content or low
available P in soils; with respect to the latter, soils contain considerable amounts of P, but a large proportion is
soil bound or in the organic form, and thus cannot be
utilized by plants [5]. Therefore, improving PUE can be
approached by various strategies. For soils with low total
P content, strategies include regular applications of small
doses of P and the improvement of internal PUE. Under
P deficiency, crops have the ability to obtain more P
through increasing the activities of enzymes involved in
P scavenging and recycling and by altering respiratory
electron transport and other metabolic pathways [1,6].
For soils with high unavailable P content, the most
common strategy is the increase in P uptake efficiency
through the proliferation and extension of plant roots,
including the selection of deep rooting, thick roots, and
strong root penetration ability [5]. Most investigations
have focused on increasing P acquisition abilities by improving features such as root traits, root exudates, mycorrhiza, and high-affinity P transporters [7-10].
Among several parameters often investigated for P acquisition ability, P uptake (PUP) is an integrative trait
that directly reflects a plant’s ability to acquire P. For example, Wissuwa et al. [3] used PUP to estimate P uptake
efficiency and identified a major quantitative trait locus
(QTL) named Pup1 on chromosome 12 of rice. Further
studies have shown that Nipponbare near-isogenic lines
carrying Pup1 could increase PUP in a severely P-deficient
field, relative to the recurrent parent Nipponbare [11].
The high yield of modern rice varieties is mainly attributed to the high harvest index and great PUE for grain
yield, which are due to the plants’ ability to mobilize P
from vegetative to reproductive tissues [12]. However, the
genetic relationship between grain yield formation and the
traits associated with P uptake, re-translocation, and partitioning in plants have rarely been reported in previous
studies [13,14].
Genome mapping can be used to locate the QTLs
linked to PUE traits, which are controlled by multiple
genes and show the genetic characteristics of quantitative traits [8,15,16]. In recent decades, QTLs for PUE
and tolerance to P deficiency have been identified in rice
[3,17], wheat [18], maize [19,20], and soybean [21,22].
Those studies mainly used two approaches. First, they
Page 2 of 15
focused on indirect traits, such as relative growth, relative tiller, root traits, shoot dry weight, and relative
yield. Second, they investigated trait performance under
P deficient conditions [8,17,23,24]. However, traits directly related to PUE, such as PUE for grain yield (PUEg),
P harvest index (PHI), and P translocation efficiency
(PTE), which are based on P uptake, grain yield, and biomass production, have rarely been used for evaluating and
mapping QTLs [4,18,19].
Although dozens of QTLs have been identified in a single growing season in plants experiencing P-starvation,
few QTLs have been detected in different years at the
same or different locations, or in different genetic populations. Hence, as most traits are profoundly influenced by
many genes and show various genotypes due to environmental interactions, few QTLs can be used to improve
PUE [25]. Those QTLs detected for PUE traits or tolerance to P deficiency may be specifically functional or only
fully expressed in a given environment. Furthermore, most
previous investigations were carried out under controlled
conditions or based on small crop populations with small
experimental field plots [3,18,26]. Bray [27] emphasized
that controlled conditions can never fully mimic field scenarios because crop plants grown in the field may face
multiple abiotic and biotic factors. Therefore, more investigations on QTLs linked to PUE traits should be performed in several different environments.
Most QTL identifications in previous studies were based
on linkage maps using restriction fragment length polymorphism (RFLP) and simple sequence repeat (SSR)
markers. In those maps, sparse markers in many regions
made it impossible to obtain precise and complete information about the number and locations of the QTLs [28].
The QTLs for PUE traits and P-deficiency tolerance in the
previous studies were often located over a large confidence interval in RFLP/SSR maps, which complicated
identification when there were several minor QTLs closely
linked in the interval. Recently, new markers, such as single feature polymorphism (SFP) [29] and single nucleotide
polymorphism (SNP) [28,30,31], have been used for QTL
identification. These methods have facilitated the construction of high-density genetic maps, and have allowed
precise and effective detections of QTLs in soybean, rice,
and maize.
In most pervious reports, PUP was often used for estimating the P acquisition efficiency from soils; however
PUEg or PUE for total biomass (PUEb) at maturity are
better indicators in terms of biomass or grain yield. To
investigate the physiological mechanisms of PUE, Rose
and Wissuwa [32] suggested that it is preferable to dissect PUE into plant components, such as grain PUE
(gPUE) and shoot PUE (strPUE). In addition, there is
also significant P remobilization from leaves and stems
during grain development to the developing grains [13].
Wang et al. BMC Genetics (2014) 15:155
Moreover, PHI is considered a parameter for PUE [33].
These three parameters, i.e., PHI, P translocation from
stems to grains (PT), and P translocation efficiency (PE),
are used to reflect P translocation from stems to grains
during grain filling, which is associated with grain yield.
In this study, a recombinant inbred population derived
from a cross between Zhenshan 97 and Minghui 63,
along with a high-density SNP bin map from Yu et al.
[28], were used to locate QTLs linked to yield and eight
PUE traits under two P application rates. The main objectives of the present study were (1) to locate QTLs for
PUE traits and (2) to investigate the genetic relationship
between PUE traits and yield traits and their stability
across environments.
Methods
Plant materials and field experiments
The recombinant inbred line (RIL) population used in
the study was derived by single-seed descent from a
cross between two elite rice lines of indica subspecies,
Zhenshan 97 and Minghui 63, the parents of Shanyou
63, the most widely cultivated hybrid in China [28,34].
Lines with too short a growth duration and with very
low grain yield were not used for the field experiments
because it is less significant to estimate PUE traits based
on low grain yield or biomass from the viewpoint of
crop production. Additionally, our experiment investigated PUE traits in large plots under real conditions for
rice production. Thus, a total of 113 lines, plus the two
parents, were used for the field experiments in 2008 and
2009.
The field experiments were carried out in the farmers’
field in Dajin town, Wuxue city, Hubei province, China
(29°51' N, 115°33' E) during the rice-growing season
from May to October in 2008 and 2009. The soil type
was gleyed paddy soil, and it exhibited the following properties in the top 25 cm: pH 5.20, 25.89 g kg−1 organic C,
1.57 g kg−1 total N, 5.35 mg kg−1 available Olsen-P, and
54.93 mg kg−1 exchangeable K.
The experiments were conducted following a randomized complete block design with three replicates. Each
replicate contained two P application rates: low P (without P fertilizer) and normal P applications (with pure P
of 40 kg ha−1, equal to 92 kg P2O5 ha−1). All the P was
applied as basal fertilizer in the form of calcium superphosphate one day before transplanting. To support high
grain yield, a total of 135 kg N ha−1 in the form of
urea was applied three times: 54 (40%) kg ha−1 as basal
fertilizer, 40.5 (30%) kg ha−1 15 days after transplanting
(DAT), and 40.5 (30%) kg ha−1 25 DAT. Potassium
(100 kg K ha−1 as potassium chloride) was applied two
times: 50 kg ha−1 as basal fertilizer and 50 kg ha−1 25
DAT. Zinc (5 kg Zn ha−1) was applied in the form of
zinc sulfate heptahydrate as basal fertilizer. Under the
Page 3 of 15
low P application, the applications of the other fertilizers were the same as those under the normal P application. All the fertilizers were applied during an early
growth stage.
In both years, seeds were sown in nursery plastic
plates on 17 May and the seedlings were transplanted on
15 June. Each line was transplanted to plots with a spacing
of 0.20 × 0.17 m and an area of 8.2 m2. Each plot included
14 rows with 16 hills per row and three 27-day-old seedlings per hill. To minimize seepage between the P applications, the main plots were separated with double bunds to
prevent water flow, and all the bunds were covered with
plastic film, extending to a depth of 20 cm below the soil
surface. To avoid loss and movement of the fertilizers, the
plots were not drained during the duration of the experiment. A flood-irrigation system was adopted, which
followed high-yield agricultural practices according to
the local rice production. Pests, diseases, birds, and weeds
were intensively controlled.
Sampling and measurements
At the heading of the plants from each line (plot), eight
uniform plants were sampled (excluding the border plants).
The plants were separated into leaves and stems (including culms, sheaths, and young panicles). At maturity, twelve uniform plants were harvested from the
middle of each plot. All the panicles were collected and
hand-threshed, and then all the grains were divided
into filled and unfilled groups by submerging them in
tap water. All the leaves, stems (culms and sheaths), rachis, and filled and unfilled grains were separately collected and oven-dried at 80°C until a constant weight
was achieved. The grain yield (Yield, g m−2) was reported at a 14% moisture content basis. The harvest
index (HI, %) was calculated as the ratio of grain dry
matter to total aboveground biomass (BIOM, g m−2).
The BIOM, Yield, and HI were considered as yield
traits in the study.
Measurements of P concentration
The oven-dried leaves, stems, and filled grains were separately grinded into powders and mixed thoroughly, and
each powder was passed through a 1-mm sieve. Approximately 0.2 g of each sample powder was digested
with sulfuric acid and hydrogen peroxide to determine
the P concentration spectrophotometrically according to
the molybdenum blue method [35], using a continuousflow analyzer (FUTURA, Alliance Instrument, France).
The P concentration was calculated based on dry weight.
Definitions of PUE traits
Eight PUE traits were calculated, as described by Dordas
[13], Jones et al. [33], and Rose and Wissuwa [32]. The P
accumulation of each plant part (including leaves, stems,
Wang et al. BMC Genetics (2014) 15:155
and grains) is the product of the part’s dry weight and its
corresponding P concentration. The P uptake at maturity (PUP, g m−2) is the sum of the accumulations in the
various plant parts per m2. The P harvest index (PHI, %)
is the ratio of the grain P accumulation to the total P accumulation of the aboveground parts at maturity. The
grain PUE (gPUE, g g−1) is defined as the filled grain dry
weight per g P in grains. The straw PUE (strPUE, g g−1)
is defined as the straw dry weight per g P in straw at maturity. The PUE for biomass (PUEb, g g−1) is defined as
the total aboveground biomass per g P accumulated in
the whole plant at maturity. The PUE for grain yield
(PUEg, g g−1) is defined as the grain yield per g P accumulated in the whole plant at maturity. The P translocation from stems to grains (PT, g m−2) is calculated as the
leaf and stem P accumulations at heading minus those
at maturity. The P translocation efficiency (PTE, %) is
defined as the ratio of PT to P accumulation at heading.
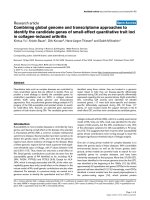
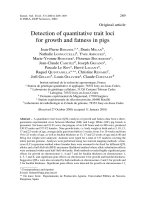
A network diagram for the investigated PUE traits are
presented in Figure 1.
Phenotype data analysis
The means over three replicates were used for all the
statistical analyses, which were conducted using SAS 9.1
(North Carolina, USA). The broad-sense heritability
(h2B, %) based on the RILs was estimated according
to the following formula: h2B = σ2g /(σ2g + σ2ge/e + σ2e /re),
where r is the number of replicates per year, e is number of environments (years), σ2g is the genetic variance,
Page 4 of 15
σ2ge is the variance of genotype due to environmental interactions, and σ2e is the residual variance [36].
Construction of genetic linkage map and QTL detection
A high-density bin map based on SNP, as described by
Xie et al. [37] and Yu et al. [28], was constructed. The map
consisted of 1619 recombination bins, covering all chromosomes without missing data and spanning 1625.5 cM in
length, with an average interval of 1.0 cM between adjacent
SNP markers. All the markers were used for the QTL mapping analysis in this study. Due to the large number of
SNP markers, the markers not involved in candidate QTLs
or epistatic interactions were removed from the genetic
map figures.
As revealed by the analysis of variance, the different P
applications (low and normal) and study years (2008 and
2009) had different effects on the traits. Thus, the four
combinations of these factors (two years and two P applications) were considered as four environmental factors (e1 and e2 represented low P in 2008 and 2009; e3
and e4 represented normal P in 2008 and 2009). The
mean of three replicates of each P application and each
year were considered as the phenotypic score for each
environment. All of the phenotype data were normally
distributed and directly used for the QTL detection without any transformations. The QTL detection was performed with the QTLNetwork-2.0 software (Institute of
bioinformatics, Zhejiang University, Hangzhou, China,
Yang and Zhu 2005) based on a mixed linear model [38].
Composite interval analyses were conducted with a 10 cM
Figure 1 The three yield traits and eight P use efficiency traits and their inter-relationships. gPUE: P use efficiency for grain yield based on
P accumulation in grains, PT: P translocation, PTE: P translocation efficiency, PUP: total aboveground P uptake, PUEb: P use efficiency for
biomass accumulation, PUEg: P use efficiency for grain yield, strPUE: P use efficiency for straw dry weight based on P accumulation in straws.
represents a positive relationship between two traits,
represents a negative relationship,
represents no obvious relationship.
Wang et al. BMC Genetics (2014) 15:155
window size and a 0.5 cM walking speed. One thousand
permutations were performed for each trait to calculate a
critical F value at P < 0.05. The Monte Carlo Markov
Chain was applied to estimate the QTL effects. A QTL
was declared if the phenotype was associated with a
marker locus at P < 0.005. The QTL naming followed the
procedure presented by McCouch et al. [39]. Additive ×
additive effects (aa), additive × environment interactions
(ae), and additive × additive × environment interactions
(aae) were separately estimated using the QTL location
software.
Individual and multi-environment (e1, e2, e3, and e4)
combined analyses were performed, and the locations
and effects of the QTLs were compared between individual and combined analyses. The locations and effects of
QTLs were reported, as well as the epistatic interactions
detected by the combined analysis across the four environments. Additionally, we also clarified the individual
environments for which similar QTLs for a given trait
were identified in the same or neighboring region by individual environment analysis.
Page 5 of 15
were also found between all trait values from 2008 to
2009 under both P applications.
The main inter-relationships among the 11 investigated traits are presented Figure 1. Generally, three
yield traits were significantly correlated with PUE traits
(Table 3). There were similar correlations among the
eight PUE traits under low and normal P applications
in both years, separately. Under both the low and normal P applications, PUP was negatively correlated with
strPUE, PUEb, and PTE in each year; however, PUP was
negatively correlated with PHI and PUEg in 2009 only.
Moreover, PHI was positively correlated with strPUE,
PUEb, PUEg, PT, and PTE. Under the two P applications,
gPUE was positively correlated with PUEb and PUEg in
each year. Positive correlations between strPUE and PUEb
and between PUEg and PTE under the two P applications
in each year were found. Under the two P applications
in each year, PUEb was positively correlated with PUEg
and PTE, and PUEg was positively correlated with PT
and PTE.
QTL detection
Results
Phenotypic variation
Under both low and normal P conditions in both two
years, Minghui 63 had higher BIOM, Yield, PUP, PUEb,
and PT, but lower HI, PHI, PUEg, and PTE than
Zhenshan 97 (Table 1). With the exception of PUEg
and PT for Zhenshan 97 under low P, the two parents
had higher BIOM, HI, Yield, PUP, PHI, PUEg, PT, and
PTE in 2008 than in 2009 under both P applications.
Under low P, the PHI, gPUE, strPUE, PUEb, PUEg, and
PTE of the two parents were higher than under normal
P in both years. Minghui 63 had a higher PT under low
P compared with under normal P; however, the opposite was true for Zhenshan 97.
All the traits varied widely under both the low and
normal P applications in both years (Table 1), and the
transgressive variations were both positive and negative.
The broad-sense heritabilities for all 11 traits varied
widely, ranging from 54.9% for gPUE to 90.9% for BIOM
under low P, and from 58.7% for PT to 86.9% for BIOM
under normal P (Table 1). Generally, BIOM, PUP, and
PTE had high heritabilities, whereas gPUE, PUEg, and
PT showed low heritabilities. The 11 traits varied significantly with year, P level, and genotype (Table 2).
Based on the multi-environment combined analysis, a
total of 36 QTLs were detected for the 11 investigated
traits (Table 4), 26 of which also detected in the similar
regions by individual environment analysis. Compared
with the QTL locations determined by individual environment analysis, seven of the 36 QTLs were simultaneously detected in both years, 14 were simultaneously
detected in different P applications, and 16 were located
in 2 or more individual environments.
QTLs for BIOM
Five QTLs for BIOM were detected, and they explained
34.0% of the total phenotypic variation (Table 4 and
Figure 2). Minghui 63, the parent with a high BIOM
value, contributed alleles at three QTLs (qBIOM7,
qBIOM10, and qBIOM11), and Zhenshan 97 provided
two alleles at the other two QTLs. Two QTLs (qBIOM2
and qBIOM7) exhibited interactions with the e4 environmental factor (normal P in 2009), and each interaction explained 0.5% and 0.4% of the total variation,
respectively. Except for qBIOM2, the remaining four
QTLs were detected in two environments across two
years.
QTLs for HI
Correlation among various traits
For all traits, significant positive correlations were observed between low and normal P applications in 2008.
Similar correlations were also found in 2009. These correlations ranged from 0.40 for gPUE to 0.90 for both
Yield and HI in 2008, and from 0.64 for PUEb to 0.93
for HI in 2009 (Table 3). Significant positive correlations
Three QTLs for HI were mapped and collectively explained 20.5% of the total phenotypic variation. Minghui
63, with a lower HI relative to Zhenshan 97, provided
the two alleles at qHI1 and qHI11, which explained
17.1% of the total variation. The QTL qHI11 was also
detected in the environment e4, and it had a significant
interaction with the environment.
Wang et al. BMC Genetics (2014) 15:155
Page 6 of 15
Table 1 Mean, range, and heritability for yield and P use efficiency traits of the population
Trait
Year
Parents
RILs
Minghui63
Zhenshan97
LSD0.05
Mean
Min
Max
Skew
Kurt
h2B
90.9
Low P
BIOM
2008
1585
819
378
1224
715
1678
0.15
1.08
(g m−2)
2009
1391
795
146
1211
789
1468
−0.74
0.71
HI
2008
44.1
48.3
7.7
40.7
27.7
51.6
−0.16
0.00
(%)
2009
36.4
43.9
15.2
40.0
24.8
51.4
−0.51
0.12
Yield
2008
813
464
255
580
335
1000
0.67
1.15
(g m−2)
2009
587
407
217
558
163
783
−0.59
1.20
PUP
2008
3.83
2.13
0.93
3.17
2.05
4.94
0.46
1.98
(g m−2)
2009
3.02
1.83
1.25
2.75
1.89
3.45
−0.61
0.24
PHI
2008
64.3
72.6
3.1
58.7
36.2
74.1
−0.37
−0.20
(%)
2009
56.5
63.0
25.1
57.4
18.6
73.7
−0.91
1.83
gPUE
2008
285
260
108
270
221
351
0.84
1.16
(g g−1)
2009
304
311
109
309
255
404
0.55
1.09
strPUE
2008
650
730
199
582
394
862
0.61
−0.30
(g g−1)
2009
743
695
575
666
463
1005
0.62
0.01
PUEb
2008
415
388
124
390
330
490
0.69
0.29
(g g−1)
2009
472
447
188
447
367
573
0.68
0.75
PUEg
2008
213
219
92
184
121
254
0.22
−0.25
(g g−1)
2009
204
230
157
207
55
295
−0.49
1.51
PT
2008
1.94
0.98
0.57
1.49
0.68
2.18
0.21
0.18
(g m−2)
2009
1.63
1.16
0.39
1.29
0.43
2.06
−0.33
−0.21
PTE
2008
61.0
76.5
10.1
61.0
25.4
80.2
−0.43
0.38
(%)
2009
58.5
76.1
26.3
58.3
16.4
79.0
−0.95
1.05
BIOM
2008
1610
810
200
1269
801
1704
−0.49
1.00
2009
1395
790
277
1232
808
1513
−0.78
0.97
HI
2008
42.5
50.7
6.3
40.8
27.7
50.0
−0.24
−0.44
2009
31.8
44.8
5.8
38.9
23.2
49.6
−0.54
−0.14
2008
796
479
148
600
197
908
0.07
1.20
2009
514
409
83
553
179
757
−0.57
0.76
2008
4.30
2.56
0.76
3.49
2.24
4.73
0.01
0.94
2009
3.78
2.22
0.73
3.29
2.29
4.21
−0.09
−0.28
2008
59.1
67.8
4.8
54.8
35.0
70.4
−0.21
−0.52
2009
42.7
56.7
4.0
50.0
14.4
68.0
−0.70
0.91
2008
271
239
89
273
217
343
0.38
0.52
2009
274
284
65
292
236
332
0.20
−0.24
2008
530
484
106
492
304
757
0.52
0.31
2009
438
457
70
474
326
664
0.45
−0.30
2008
377
317
81
364
272
469
0.23
1.75
2009
368
359
61
377
300
465
0.27
0.01
2008
187
188
63
173
88
231
−0.10
0.09
2009
136
187
45
170
45
246
−0.57
0.76
67.5
72.2
85.0
74.3
54.9
77.4
75.7
67.6
70.2
80.9
Normal P
Yield
PUP
PHI
gPUE
strPUE
PUEb
PUEg
86.9
72.3
69.4
83.8
78.2
76.1
81.2
80.4
73.5
Wang et al. BMC Genetics (2014) 15:155
Page 7 of 15
Table 1 Mean, range, and heritability for yield and P use efficiency traits of the population (Continued)
PT
PTE
2008
1.68
1.55
1.23
1.55
0.79
2.48
0.09
−0.08
2009
1.39
1.27
0.29
1.44
0.36
2.28
−0.68
0.81
2008
50.0
75.8
23.6
56.5
29.8
77.3
−0.49
−0.28
2009
41.2
66.7
13.1
51.6
13.4
76.0
−0.83
0.55
58.7
80.9
BIOM: total aboveground biomass, HI: harvest index, gPUE: P use efficiency for grain yield based on P accumulation in grains, PHI: P harvest index, PT: P
translocation, PTE: P translocation efficiency, PUP: total aboveground P uptake, PUEb: P use efficiency for biomass accumulation, PUEg: P use efficiency for grain
yield, strPUE: P use efficiency for straw dry weight based on P accumulation in straw, hB2: broad heritability.
QTLs for Yield
QTL for gPUE
Two QTLs were identified for Yield, and they jointly explained 11.2% of the total phenotypic variation. The
QTL qYield2 with the low-score parent Zhenshan 97 allele had a large effect and contributed 8.1% of the total
variation. The other QTL, which had the Minghui 63 allele, contributed 3.1%. The QTL qYield2 was mapped in
three individual environments. The QTL qYield2 were
detected in three environments across two years.
Only one QTL, qgPUE4, was identified for gPUE. It was
located in the region BIN680–BIN681 on chromosome 4
and explained 1.4% of the total phenotypic variation.
QTLs for strPUE
For strPUE, three QTLs were verified on chromosomes
1 and 2, and together they accounted for 15.1% of the
phenotypic variation. The Minghui alleles at two QTLs
(qstrPUE1-1 and qstrPUE1-2) and the Zhenshan97 allele at
qstrPUE2 increased strPUE. The two QTLs (qstrPUE1-2
and qstrPUE2) were detected in three environments across
two years.
QTLs for PUP
Three QTLs for PUP were identified and explained
13.6% of the total phenotypic variation. Among these
three QTLs, the two alleles at qPUP7 and qPUP10 were
from Minghui 63, which had a higher PUP than Zhenshan 97. The QTLs qPUP1 and qPUP10 were identified
in multiple environments.
QTL for PUEb
Only one QTL (qPUEb2) controlling PUEb on chromosome 2 was detected, and it explained 6.4% of the phenotypic variation. This QTL was only found in a single
environment.
QTLs for PHI
Four additive QTLs for PHI were found, and they collectively accounted for 42.8% of the total phenotypic
variation. The contribution of each QTL ranged from
2.6% to 20.0%. Minghui 63 provided the alleles at two
QTLs, qPHI1 and qPHI11. The alleles for increasing PHI
at the other two QTLs, qPHI2 and qPHI6, were from
Zhenshan 97. The qPHI1 with the Minghui 63 allele explained 15.8% of the total variation, whereas the qPHI2
with the Zhenshan 97 allele contributed 20.0%. A significant interaction was detected only between qPHI11 and
e4. The two QTLs on chromosomes 1 and 6 were found
in two environments simultaneously.
QTLs for PUEg
Five QTLs were detected for PUEg, collectively accounting for 32.6% of the phenotypic variation. The QTL
(qPUEg2) on chromosome 2 had large additive effect,
accounting for 13.4% of the phenotypic variation. The
alleles for increasing PUEg came from both Minghui 63
at three QTLs (qPUEg1, qPUEg11, and qPUEg12) and
Zhenshan 97 at two QTLs (qPUEg2 and qPUEg6). Two
QTLs (qPUEg11 and qPUEg12) had significant interactions with the environment. Three QTLs were located
in individual environments simultaneously.
Table 2 Analysis of variance for yield and P use efficiency traits
Source
df
F-value
Year (Y)
1
P level (P)
1
36.9**
13.8**
7.2**
516.8**
395.6**
22.5**
605.7**
515.5**
405.5**
35.6**
177.1**
Genotype (G)
112
26.8**
56.0**
37.1**
12.1**
25.1**
5.2**
8.1**
5.9**
18.8**
7.8**
19.5**
Y×P
1
3.0
24.7**
21.3**
31.6**
38.5**
31.9**
78.4**
109.7**
116.8**
5.0*
8.5**
Y×G
112
2.2**
16.1**
10.2**
1.2
5.6**
1.4**
1.5**
1.0
5.1**
2.5**
2.9**
BIOM
HI
Yield
PUP
PHI
gPUE
strPUE
PUEb
PUEg
PT
PTE
19.5**
153.7**
145.9**
272.0**
115.1**
373.8**
33.0**
282.4**
74.8**
84.0**
82.4**
P×G
112
0.8
1.7**
1.4*
1.1
1.1
1.1
1.0
1.2
1.1
1.5**
1.1
Y×P×G
112
0.9
1.2
1.0
0.8
0.7
0.9
0.5
0.6
0.8
0.9
1.0
See Table 1 for abbreviations. * and **Indicate significance at P = 0.05 and P = 0.01, respectively.
Wang et al. BMC Genetics (2014) 15:155
Page 8 of 15
Table 3 Correlations among yield and P use efficiency traits
Trait
BIOM
HI
Yield
PUP
PHI
gPUE
strPUE
PUEb
PUEg
PT
PTE
2008
BIOM
0.89**a
0.14
0.76**
0.77**
0.14
0.39**
0.24*
0.42**
0.31**
0.03
−0.32**
HI
0.10
0.90**
0.74**
0.01
0.85**
0.15
0.48**
0.19*
0.86**
0.41**
0.50**
Yield
0.76**
0.71**
0.90**
0.53**
0.63**
0.36**
0.46**
0.39**
0.76**
0.30**
0.11
PUP
0.78**
0.11
0.63**
0.74**
−0.17
0.07
−0.31**
−0.25**
−0.13
−0.07
−0.57**
PHI
0.12
0.83**
0.60**
−0.04
0.86**
−0.09
0.81**
0.45**
0.89**
0.39**
0.66**
gPUE
0.18
0.05
0.16
−0.15
−0.24**
0.40**
0.07
0.49**
0.37**
0.03
−0.12
strPUE
0.22*
0.42**
0.40**
−0.25**
0.78**
0.01
0.78**
0.82**
0.79**
0.26**
0.58**
PUEb
0.28**
0.01
0.18
−0.36**
0.25**
0.53**
0.73**
0.56**
0.65**
0.12
0.31**
PUEg
0.23*
0.82**
0.68**
−0.12
0.81**
0.36**
0.76**
0.57**
0.80**
0.38**
0.56**
PT
0.27**
0.24*
0.37**
0.21*
0.20*
0.11
0.16
0.10
0.26**
0.59**
0.75**
PTE
−0.29**
0.45**
0.10
−0.48**
0.62**
−0.03
0.59**
0.32**
0.56**
0.57**
0.82**
BIOM
0.89**
−0.13
0.51**
0.73**
−0.08
0.30**
0.17
0.36**
0.04
0.00
−0.32**
HI
−0.11
0.93**
0.78**
−0.33**
0.91**
0.18
0.53**
0.27**
0.91**
0.63**
0.73**
Yield
0.49**
0.81**
0.90**
0.18
0.73**
0.34**
0.55**
0.44**
0.81**
0.55**
0.44**
PUP
0.77**
−0.18
0.3**
0.78**
−0.42**
−0.08
−0.44**
−0.37**
−0.42**
−0.35**
−0.67**
PHI
−0.06
0.93**
0.76**
−0.25**
0.90**
−0.02
0.79**
0.47**
0.92**
0.68**
0.81**
gPUE
0.12
0.25**
0.30**
−0.28**
0.10
0.70**
0.14
0.52**
0.37**
0.18
0.09
2009
strPUE
0.11
0.56**
0.54**
−0.38**
0.77**
0.28**
0.76**
0.85**
0.79**
0.60**
0.68**
PUEb
0.22*
0.11
0.21*
−0.44**
0.29**
0.61**
0.76**
0.64**
0.64**
0.47**
0.47**
PUEg
0.00
0.89**
0.78**
−0.35**
0.91**
0.50**
0.82**
0.54**
0.88**
0.70**
0.78**
PT
0.29**
0.59**
0.69**
0.15
0.56**
0.19*
0.37**
0.14
0.56**
0.67**
0.89**
PTE
−0.24**
0.80**
0.56**
−0.46**
0.83**
0.28**
0.65**
0.34**
0.83**
0.74**
0.84**
Between 2008 and 2009
Low P
0.85**
0.52**
0.57**
0.76**
0.60**
0.38**
0.63**
0.61**
0.54**
0.55**
0.69**
Normal P
0.78**
0.61**
0.57**
0.73**
0.67**
0.63**
0.69**
0.68**
0.63**
0.42**
0.70**
See Table 1 for abbreviations.
The bold value in the diagonal indicates correlations between low and normal P values for an identical trait. The values below the diagonal are correlations under
the low P application, and the values above the diagonal are correlations under the normal P application.
* and **Indicate significance at P = 0.05 and P = 0.01, respectively.
QTLs for PT
For PT, three QTLs (qPT2, qPT5, and qPT8) were detected on chromosomes 2, 5, and 8, accounting for 14.5%
of the phenotypic variation (Table 4). At these three loci,
the alleles from Zhenshan 97 increased the trait. All
these QTLs were detected in individual environments.
QTLs for PTE
Six QTLs for PTE were detected on chromosomes 1, 2,
5, 8, and 12, and they accounted for 34.1% of the phenotypic variation. The Minghui 63 alleles increased PTE at
the three QTLs (qPTE1-1, qPTE1-2, and qPTE12), and
the Zhenshan 97 alleles increased the trait score for the
remaining QTLs (qPTE2, qPTE5, and qPTE8). The QTL
qPTE2 had a significant interaction with the environment.
Among the six QTLs, four were identified in individual
environments.
Co-location and cluster of QTLs
Thirty-one QTLs were mapped on the same location or
clustered in 12 intervals, respectively (Table 5). There
were three regions on chromosome 1. The Minghui 63 alleles on two regions (BIN59–BIN61 and BIN143–BIN161)
increased the phenotypic score, whereas the region
BIN31–BIN47 covered favorable alleles from the two parents. There were three regions on chromosome 2 in which
alleles from Zhenshan 97 increased the phenotypic score.
The other six regions were located on chromosomes 5, 7,
8, 10, 11, and 12. Among the six regions, Zhenshan 97
contributed alleles for increasing phenotypic score to two
Wang et al. BMC Genetics (2014) 15:155
Page 9 of 15
Table 4 Candidate QTLs and their interactions with environment for yield and P use efficiency traits determined by
multi-environment combined analysis
Trait
QTL
Chra
Intervalb
Position(cM)c
ad
h2(a)%e
BIOM
qBIOM1
1
BIN31-BIN32
26.1
−47.65**
8.6
qBIOM2
2
BIN244-BIN245
32.4
−21.46**
HI
Yield
PUP
PHI
aef
h2(ae)%g
1.7
−19.55* (ae4)
0.5
17.35* (ae4)
0.4
Individual environmenth
e1,e3
qBIOM7
7
BIN1008-BIN1009
59.2
45.50**
7.8
qBIOM10
10
BIN1342-BIN1343
34.0
56.95**
12.3
qBIOM11
11
BIN1497-BIN1498
92.4
31.02**
3.6
e1,e2
qHI1
1
BIN59-BIN60
62.9
1.85**
9.7
e4
qHI2
2
BIN302-BIN303
79.6
−1.08**
3.4
qHI11
11
BIN1398-BIN1399
5.9
1.60**
7.4
qYield2
2
BIN302-BIN303
79.6
−32.75**
8.1
qYield11
11
BIN1401-BIN1402
15.2
20.18**
3.1
qPUP1
1
BIN46-BIN47
36.1
−0.10**
4.7
e1,e3
qPUP7
7
BIN1007-BIN1008
55.0
0.09**
3.4
e2
qPUP10
10
BIN1348-BIN1349
37.7
0.11**
5.5
e1,e2,e3
qPHI1
1
BIN59-BIN60
63.4
3.71**
15.8
e2,e4
qPHI2
2
BIN310-BIN311
99.0
−4.18**
20.0
qPHI6
6
BIN838-BIN839
9.0
−1.49**
2. 6
e2,e4
e1,e3
0.93* (ae4)
0.8
e4
e1,e2,e4
e1,e3
qPHI11
11
BIN1392-BIN1393
2.2
1.96**
4.4
gPUE
qgPUE4
4
BIN680-BIN681
106.6
−3.83**
1.4
strPUE
qstrPUE1-1
1
BIN60-BIN61
63.9
24.67**
3.9
qstrPUE1-2
1
BIN177-BIN178
150.8
27.62**
4.9
e1,e3,e4
qstrPUE2
2
BIN302-BIN303
79.6
−31.30**
6.3
e2,e3,e4
qPUEb2
2
BIN253-BIN254
39.5
−11.36**
6.4
e3
PUEb
PUEg
PT
PTE
1.24* (ae4)
0.6
qPUEg1
1
BIN143-BIN144
135.9
6.84**
3.6
qPUEg2
2
BIN302-BIN303
79.6
−13.27**
13.4
qPUEg6
6
BIN946-BIN947
112.7
−7.37**
4.1
qPUEg11
11
BIN1395-BIN1396
5.2
7.62**
4.4
−4.82* (ae2)
0.6
−5.14* (ae2)
0.7
e4
e4
e2,e4
qPUEg12
12
BIN1612-BIN1613
100.1
9.63**
7.1
qPT2
2
BIN294-BIN295
75.7
−0.09**
4.6
e4
qPT5
5
BIN709-BIN710
13.9
−0.09**
4.9
e1,e2,e4
qPT8
8
BIN1130-BIN1131
56.3
−0.09**
5.0
e2,e4
qPTE1-1
1
BIN33-BIN34
30.1
3.26**
6.4
e4
qPTE1-2
1
BIN160-BIN161
140.7
2.59**
4.0
e4
qPTE2
2
BIN310-BIN311
88.0
−4.04**
9.9
qPTE5
5
BIN708-BIN709
13.4
−2.71**
4.4
qPTE8
8
BIN1131-BIN1132
56.5
−3.45**
7.2
qPTE12
12
BIN1618-BIN1619
109.3
1.91**
2.2
−1.92* (ae4)
e2
0.7
e1,e2
e2,e4
See Table 1 for abbreviations.
a
Chromosome the QTL is located on.
b
The underlined marker is closer to the QTL.
c
Position (cM) denotes the genetic distance in centiMorgan between the QTL and the first marker on the relevant chromosome.
d
Additive effect, a negative value indicates that the Zhenshan 97 allele increases phenotypic score.
e
Phenotypic variation explained by an additive effect.
f
Additive by environment interaction effect, e1 and e2 represent low P in 2008 and 2009, e3 and e4 represent normal P in 2008 and 2009, respectively.
g
Phenotypic variation explained by an additive by environment interaction.
h
The individual environment in which a QTL for the identical trait was detected by individual environment analysis and located in the same or neighboring region
listed in the fourth column.
* and **Indicate significance at P = 0.05 and P = 0.01, respectively.
Wang et al. BMC Genetics (2014) 15:155
Page 10 of 15
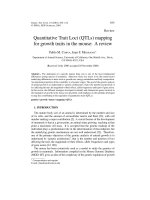
Figure 2 A genetic linkage map of rice showing the mapping of QTLs with additive effects and epistatic effects. The sequent SNP markers
have been sparsed according to the mapping results. The filled symbols represent the QTLs with additive effects; the open symbols represent the
indicate the QTLs or location detected for BIOM;
for HI;
for Yield;
for
non-QTL locations involved in epistatic interactions.
for PHI;
for gPUE;
for strPUE;
for PUEb;
for PUEg;
for PT; and
for PTE. Markers with arrows indicate a
PUP;
QTL located in a similar region according to RFLP/SSR maps and physical positions in previous studies. Marker RM259 on chromosome 1 [8],
RM211 and RM53 on chromosome 2 [47], R1962 and RM225 on chromosome 6 [3,47], RM201 on chromosome 9 [50], R2174 and R1629 on
chromosome 10 [3], and C732 and R2672 on chromosome 12 [3,51].
Wang et al. BMC Genetics (2014) 15:155
Page 11 of 15
Table 5 Chromosomal regions with pleiotropic effects on
yield and P use efficiency traits
Chromosome Interval
Investigated traita
Yield trait
P use efficiency trait
1
BIN31-BIN47
BIOM(−)
PUP(−), PTE
1
BIN59-BIN61
HI
1
BIN143-BIN161
PHI, strPUE
PUEg, PTE
2
BIN244-BIN254
BIOM(−)
2
BIN294-BIN303
HI(−), Yield(−) strPUE(−), PUEg(−),
PT(−)
PUEb(−)
2
BIN310-BIN311
PHI(−), PTE(−)
5
BIN708-BIN710
PT(−), PTE(−)
7
BIN1007-BIN1009 BIOM
PUP
8
BIN1130-BIN1132
PT(−), PTE(−)
10
BIN1342-BIN1349 BIOM
PUP
11
BIN1392-BIN1402 HI, Yield
PHI, PUEg
12
BIN1612-BIN1619
PUEg, PTE
See Table 1 for abbreviations.
a
(−) Indicates that Zhenshan 97 allele increases phenotypic score.
regions (BIN708–BIN710 and BIN1130–BIN1132), and
Minghui 63 provided alleles in the remaining four regions.
Seven of the 12 intervals contained clustered QTLs for
yield and PUE traits simultaneously.
Detection of epistatic interactions
Twenty-four digenic interactions were detected for eight
of the eleven traits (Table 6). Each interaction explained
0.4% to 10.2% of the phenotypic variation. Eighteen of
the twenty-four interactions did not involve loci with
additive effects. Of the six interactions involving additive
QTLs, three occurred between two additive QTLs. The
first occurred between the two main QTLs for PUP,
qPUP1 and qPUP7. The second additive interaction was
between QTLs for PHI and existed between the regions
BIN59–BIN60 and BIN1392–BIN1393 for PHI; QTLs
for PHI, strPUE, and HI (qPHI1, qstrPUE1-1, and qHI1,
respectively) were located on the former region. The
third interaction occurred between BIN160–BIN161
and BIN310–BIN311 for QTLs of PTE; the former region contained a QTL for PTE (qPTE1-2), and the latter
contained the QTLs qPTE2 and qPHI2. Three significant interactions occurred between e4 and QTLs for
BIOM, PHI, and PTE (normal P in 2009), and each aae
interaction explained 0.5%, 0.5%, and 0.8% of the phenotypic variation, respectively.
Discussion
among PUEb, PUEg, and strPUE (Table 3 and Figure 1).
However, we did not find any regions simultaneously
containing QTLs for PUEb, PUEg, and gPUE, or PUEb,
PUEg, and strPUE. Moreover, we did not find any colocations of QTLs for PUEg and gPUE or for PUEb and
strPUE. Therefore, P use efficiencies based on the P stored
in a specific part of plant (such as gPUE and strPUE) is
distinct from those based on the total P in an entire plant
(such as PUEg and PUEb). No correlation occurred between strPUE and gPUE, and the co-location of QTLs for
the two traits was not observed either. This suggests that
strPUE and gPUE are independent from each other.
Therefore, our results showed that it might be feasible to
improve gPUE and strPUE independently. The majority of
accumulated P was distributed in rice grains, and improving gPUE (such as decreasing P concentration in grains)
may therefore be a suitable option for reducing plant P
demand.
A genotype with tolerance to P deficiency is desirable,
with simultaneously high PUP and high PUE [1,3]. Negative correlations between PUP and PUEb, PUEg, gPUE,
and strPUE were observed (Table 3, Figure 1). Similar
correlations have been previously reported in rice [3]
and wheat [15,18,33]. Manske et al. [40] showed that
wheat PUEg was negatively correlated with pre-anthesis
P accumulation, but positively correlated with postanthesis P accumulation. In our study, PUEg was negatively correlated with pre-anthesis P accumulation
under low P conditions (r = −0.27** in 2008, −0.29** in
2009, ** indicate significance at P < 0.01) and not correlated with post-anthesis P accumulation under normal
P condition. However, gPUE was negatively correlated
with post-anthesis P accumulation (r = −0.41** under
low P in 2008, −0.32** under low P and −0.38** under
normal P in 2009). Therefore, the contributions of P accumulations to PUE appear to be different at various
growth stages, depending on crop and P level.
The QTLs for PUP did not share any regions with
those for the four PUE traits based on grain yield and
biomass (PUEb, PUEg, gPUE, and strPUE). Genetic association (close linkage and pleiotropy) and environmental effects are the main causes for the correlations
between the traits [41]. Thus, the relationships between
PUP and the four PUE traits may not be directly due to
genetic association. In fact, P accumulation is involved
in root characters, P absorption, and translocation and
distributions among various parts of a plant, whereas
PUE is associated with biomass production and yield
formation, as well as with responses of a plant to P supply (Figure 1).
Interrelationships among PUE traits
Two PUE traits (gPUE and strPUE) may be considered
as components of P use efficiency [32]. There were positive correlations among PUEb, PUEg, and gPUE, and
Relationships among yield and PUE traits
Seven regions simultaneously controlling yield and PUE
traits (Table 5) were identified. These co-locations implied
Trait
QTL
BIOM
HI
qBIOM1
Yield
Chr
qPUP10
PHI
qPHI1,qHI1,qstrPUE1-1
strPUE
PUEg
PTE
qPTE1-2
QTL
Chr
Interval
Positiona
aab
h2(aa)%c
BIN292-BIN293
74.8
6
BIN962-BIN963
128.4
−51.91**
10.2
3
BIN375-BIN376
28.2
6
BIN891-BIN892
52.2
−26.30**
2.6
3
BIN413-BIN414
76.2
4
BIN562-BIN563
8.2
−29.30**
3.2
3
BIN413-BIN414
76.2
3
BIN483-BIN484
125.3
−26.12**
2.6
7
BIN990-BIN991
26.4
11
1
BIN30-BIN31
24.9
6
1
BIN80-BIN81
78.6
3
2
BIN242-BIN243
17.7
2
6
BIN909-BIN910
75.3
10
3
BIN530-BIN531
177.2
4
5
qPUP1
Positiona
2
12
PUP
Interval
BIN694-BIN695
BIN1572-BIN1573
5.3
49.2
qPUEg12
qPUP7
1
BIN46-BIN47
36.1
2
BIN241-BIN242
17.5
10
104.2
29.65**
3.3
29.6
−1.23**
4.3
BIN435-BIN436
92.3
1.24**
4.4
BIN337-BIN338
162.0
−1.81**
9.3
BIN1328-BIN1329
22.4
0.99**
2.8
BIN580-BIN581
14.7
−26.25**
5.2
10
BIN1321-BIN1322
16.8
−21.15**
3.4
12
BIN1612-BIN1613
99.1
−23.47**
4.2
7
BIN1007-BIN1008
55.0
0.07**
2.3
8
BIN1169-BIN1170
111.4
0.11**
5.8
BIN1348-BIN1349
37.7
1
BIN59-BIN60
63.4
2
BIN218-BIN219
0
5
3
BIN490-BIN491
129.7
9
qPHI11
BIN1515-BIN1516
BIN862-BIN863
12
BIN1613-BIN1614
104.3
0.04*
0.9
11
BIN1392-BIN1393
2.2
0.58
0.4
BIN815-BIN816
113.3
−1.65**
3.1
BIN1290-BIN1291
104.7
2.18**
5.5
5
BIN691-BIN692
3.0
11
BIN1405-BIN1406
17.9
−1.49**
2.6
5
BIN692-BIN693
4.3
10
BIN1354-BIN1355
43.5
−25.93**
4.3
8
BIN1163-BIN1164
106.4
−8.42**
5.4
2
BIN310-BIN311
88.0
0.84
0.42
97.4
8
BIN1085-BIN1086
35.8
−2.34**
3.30
3.4
12
BIN1549-BIN1550
38.5
2.49**
3.72
1
BIN28-BIN29
1
BIN160-BIN161
140.7
BIN451-BIN452
3
10
BIN1299-BIN1300
23.9
qPTE2, qPHI2
aaed
h2(aae)%e
19.36* (aae4)
0.5
1.19* (aae4)
0.5
2.00* (aae4)
0.8
Wang et al. BMC Genetics (2014) 15:155
Table 6 Epistasis and epistasis by environment interaction on yield and P use efficiency traits
a
Position (cM) denotes the genetic distance in centiMorgan between the QTL and the first marker on the relevant chromosome.
Additive by additive effect, a negative value means that recombinant alleles from the two parents increase the phenotypic score, a positive value means that two alleles from an identical parent increase the
phenotypic score.
c
Phenotypic variation explained by an epistatic effect.
d
Epistasis by environment interaction, e1 and e2 represent low P in 2008 and 2009, e3 and e4 represent normal P in 2008 and 2009, respectively.
e
Phenotypic variation explained by an epistasis by environment interaction.
* and **Indicate significance at P = 0.05 and P = 0.01, respectively.
b
Page 12 of 15
Wang et al. BMC Genetics (2014) 15:155
the close association between yield and PUE traits, which
is also shown by the correlation analysis (Table 3, Figure 1).
Generally, P accumulation and PUEg increased with yield
and biomass. As expected, PUP, PUEg, and PUEb were individually positively correlated with yield. Regardless of
these correlations, this study did not identify any common
regions simultaneously shared by QTLs for PUP, PUEg/
PUEb, and Yield. The QTLs for Yield and PUEg shared
the interval BIN302–BIN303. This is consistent with the
fact that high grain yield often results in high PUEg when
P content is stable. We found co-locations for PUEg and
PTE and for PUEg and PT, suggesting close relationships
of PUEg with PTE and PT. The translocation of P from
stems to grains is associated with grain P accumulation
and PHI during grain filling [13]. Although Ogawa et al.
[42] reported that carbohydrate accumulation is not directly associated with P accumulation in rice grains, increased P translocation to younger panicles may facilitate
the grain filling and lead to high grain yield, which is advantageous to PUEg.
In this study, PHI was associated with HI and P contents in grains and straw. The region BIN1392–BIN1402
on chromosome 11 contained four QTLs affecting PHI,
PUEg, HI, and Yield. This co-location was consistent
with the correlations found in this study and in previous
studies [14,33]. In contrast, two regions (BIN59–BIN60
and BIN1392–BIN1399) contained QTLs for HI and
PHI (Table 5 and Figure 2). However, the QTLs for PHI
were different than those for HI, which suggests a relative independence of the two traits.
Grain yield was taken into account when HI and PUEg
were calculated. Higher grain yield may indicate both
higher HI and higher PUEg when the P accumulation in
an entire plant is the same, as supported by the high correlation between the two traits (Table 3). The two regions on chromosomes 2 and 11 were simultaneously
shared by QTLs for HI and PUEg (Table 5). Both the colocation of these QTLs and the correlation between HI
and PUEg suggest that PUEg depends on HI to some
degree. However, the two traits had specific QTLs that
were not common, implying different genetic controls.
From the viewpoint of crop physiology, HI is positively
associated with grain yield and total biomass, whereas
PUEg depends on grain yield, in addition to the P content of an entire plant (Table 3, Figure 1).
Plant P accumulation increases biomass production to
a certain extent and vice versa [3,15,18], as confirmed by
the correlations found in this study (Table 3). Three regions were concurrently shared by QTLs for BIOM and
PUP (Table 5). Notably, at least two QTLs for BIOM
were not shared by PUP, and no correlation was observed between growth duration and PUP (data not
shown), suggesting that the processes for biomass
production and P accumulation in rice are not the
Page 13 of 15
same. With respect to physiology, biomass production
is related to photosynthetic capacity and respiration,
and P accumulation is often affected by P absorption
and translocation. Moreover, two QTLs for PUEb and
BIOM were tightly linked in the region BIN244–BIN254
on chromosome 2, and two regions (BIN294–BIN303 and
BIN1392–BIN1402) simultaneously affected PUEg and
Yield (Table 5 and Figure 2). This suggests that Yield and
PUEg (and BIOM and PUEb) could be concurrently improved by exploring these regions.
Epistatic and environmental effects for PUE traits
Epistasis is the interaction of genes at different loci, and it
plays an important role in the formation of complex traits
[43,44]. A dozen pairs of epistatic interactions were detected for PUE traits in this study. Taking PUP as an example, three QTLs explained 13.6% of the phenotypic
variation, and three pairs of interactions explained 9.0% of
the variation (Tables 4 and 6). This implies that both additive QTLs and epistatic interactions could make substantial
contributions to PUE traits. A relatively large proportion of
QTLs (33%, 12 of 36) had both individual effects and epistatic interactions (Tables 4 and 6), indicating that interaction is common for yield and PUE traits. Hu et al. [45]
and Li et al. [8] have reported similar epistatic interactions.
The development of complex traits integrates genetic
and environmental effects. Seven of the 36 additive QTLs
(Table 4) and the three epistatic interactions (Table 6)
identified in this study interacted significantly with the environment. The seven QTLs with ae effects exhibited various responses to the environment. Several interactions of
QTLs with the environment and epistasis with the environment were up-regulated by the particular environment.
For example, three additive QTLs (qBIOM7, qHI11, and
qPHI11, Table 4) and three pairs of epistatic interactions
(Table 6) displayed positive ae and aae effects with the
environment e4 (normal P in 2009), suggesting that
the QTLs and epistatic interactions were significantly
strengthened by the application of P fertilizer.
In contrast, several interactions were down-regulated
by the environment. For example, two QTLs controlling
PUEg (qPUEg11, qPUEg12) were down-regulated by e2
(low P in 2009), and two QTLs (qBIOM2 and qPTE2)
were down-regulated by e4 (normal P in 2009). The
down-regulations of qPUEg11 and qPUEg12 by low P
and the down-regulation of qBIOM2 by the normal P
application appeared in contrast to the expected behavior, as low P application often results in high PUEg and
low BIOM (Table 1). However, for qPTE2, the downregulation by the normal P application was consistent
with the reduction of PTE under normal P. Therefore,
our results suggest that both QTL and epistatic interactions are differentially expressed in response to the
environment.
Wang et al. BMC Genetics (2014) 15:155
Comparisons of QTLs across genetic backgrounds
In previous studies, several populations have been used
to detect QTLs associated with PUE in rice, with more
attention focused on P deficiency tolerance and relative
agronomic traits [3,8,17,45,46]. According to the physical positions in the SNP (Figure 2) and RFLP/SSR maps
[28], the QTL qPUP10 for PUP may share a similar region with a QTL for PUP on chromosome 10 found by
Wissuwa et al. [3], which was flanked by the marker
R1629. Similarly, the QTL qPUP1 (BIN46–BIN47) was
very close to the marker RM259 on chromosome 1 for
root traits, which was found by Li et al. [8]. A QTL interaction linked to PUP on chromosome 2 was located
on an interval (BIN241–BIN242) that was tightly linked
to marker RM211, which was close to a QTL for root
number [47]. These results were consistent with previous studies showing that root traits play an important
role in P uptake and tolerance to P deficiency [48,49].
Further increases in grain yield under P deficiency
would most likely result from increases in PUP and PHI
[33]. The interval BIN1290–BIN1291 on chromosome
9, which was involved in an interaction for PHI, had a
similar location to RM201; moreover, Mao et al. [50]
identified a QTL for 1000-grain weight on the similar
interval (Figure 2). The QTL, qPHI6 for PHI seems to
share a similar region with the QTLs near R1962 on
chromosome 6 for tiller number and PUP under P deficiency detected by Wissuwa et al. [3]. This suggests that
the QTLs and the interval may be involved in partitioning more P to grains under P deficient conditions.
The interval BIN1549–BIN1550, which was involved in
an epistatic interaction for PTE on chromosome 12, was
tightly linked to R2672, which was close to two QTLs for Pdeficiency tolerance [3] and for amount of stem nonstructural carbohydrates per spikelet at heading [51]. Thus,
considering the traits linked to and controlled by the same
interval, the epistatic effect between BIN1299–BIN1300 and
BIN1549–BIN1550 may contribute to the relocations of P
and carbohydrates from stems to grains during grain filling.
Conclusions
In this study, most of the QTLs for the eight PUE traits
were different from those for yield traits, indicating different genetic mechanisms underlying high PUE and high
grain yield. However, seven regions were shared by yield
and PUE traits; therefore, grain yield and PUE traits may
be simultaneously improved.
Four QTLs (qPHI1 and qPHI2 for PHI, qPUEg2 for
PUEg, and qPTE8 for PTE) had strong additive effects
but no environmental effects (Table 4). Additionally, three
QTLs (qPUP1, qPUP10, and qPHI6) were simultaneously
found under different genetic backgrounds. These QTLs
are promising for improving rice PUE in future breeding
research.
Page 14 of 15
This study documented that 12 QTLs and many loci
were involved in epistatic interactions, which played substantial roles in determining PUE traits. The observed
interactions provide an approach to reveal the genetic
networks affecting PUE traits.
Abbreviations
BIOM: Biomass; gPUE: Grain P use efficiency based on P accumulation in
grains; HI: Harvest index; PHI: P harvest index; PT: P translocation; PTE: P
translocation efficiency; PUEb: P use efficiency for biomass; PUEg: P use
efficiency for grain yield based on P accumulation in the whole plant;
PUP: Total P uptake in the whole plant; QTLs: Quantitative trait loci;
strPUE: Straw P use efficiency based on P accumulation in straw.
Competing interests
The authors declare that they have no competing interests.
Authors’ contributions
KC, KW, and JH designed the experiments. KW, GL, JP, and KC performed the
field experiments, P concentration determinations, and data analyses. WX
and HY constructed the SNP map; LN and JH provided field management;
KW and KC wrote the manuscript; FS and SP interpreted the data and
revised the manuscript. All authors have read and approved the final
manuscript.
Acknowledgements
We thank Professors Xing Yongzhong and Yu Sibin, and the National Key
Laboratory of Crop Genetic Improvement, Huazhong Agricultural University,
Wuhan, 430070, for providing seeds and the SNP marker data for the
recombinant inbred lines used in the study. This study was supported by the
National Basic Research Program of China (2005CB120905) and the National
Key Technology R&D Program (2013BAD07B10) of the Ministry of Science
and Technology.
Author details
1
National Key Laboratory of Crop Genetic Improvement, Huazhong Agricultural
University, Wuhan 430070, Hubei, China. 2MOA Key Laboratory of Crop
Ecophysiology and Farming System in the Middle Reaches of the Yangtze River,
College of Plant Science and Technology, Huazhong Agricultural University,
Wuhan 430070, Hubei, China. 3Rice Research Institute, Guangdong Academy of
Agricultural Science, Guangzhou 510640, Guangdong, China. 4Department of
Agriculture, Anbar Campus of Abdul Wali Khan University, Mardan, Khyber
Pakhtunkhwa, Pakistan.
Received: 20 September 2014 Accepted: 17 December 2014
References
1. Panigrahy M, Rao DN, Sarla N: Molecular mechanisms in response to
phosphate starvation in rice. Biotechnol Adv 2009, 27:389–397.
2. Vance CP: Symbiotic nitrogen fixation and phosphorus acquisition, plant
nutrition in world of declining renewable resources. Plant Physiol 2001,
127:390–397.
3. Wissuwa M, Yano M, Ae N: Mapping of QTLs for phosphorus-deficiency
tolerance in rice (Oryza sativa L.). Theor Appl Genet 1998, 97:777–783.
4. Ismail AM, Heuer S, Thomson MJ, Wissuwa M: Genetic and genomic
approaches to develop rice germplasm for problem soils. Plant Mol Biol
2007, 65:547–570.
5. Ramaekers L, Remans R, Rao IM, Blair MW, Vanderleyden J: Strategies for
improving phosphorus acquisition efficiency of crop plants. Field Crop Res
2010, 117:169–176.
6. Hammond JP, Broadley MR, White PJ: Genetic responses to phosphorus
deficiency. Ann Bot 2004, 94:323–332.
7. Bucher M: Functional biology of plant phosphate uptake at root and
mycorrhiza interfaces. New Phytol 2007, 173:11–26.
8. Li JZ, Xie Y, Dai AY, Liu LF, Li ZC: Root and shoot traits responses to
phosphorus deficiency and QTL analysis at seedling stage using
introgression lines of rice. J Genet Genomics 2009, 36:173–183.
9. Rausch C, Bucher M: Molecular mechanisms of phosphate transport in
plants. Planta 2002, 216:23–37.
Wang et al. BMC Genetics (2014) 15:155
10. Rengel Z: Genetic control of root exudation. Plant Soil 2002, 245:59–70.
11. Heuer S, Lu XC, Chin JH, Tanaka JP, Kanamori H, Matsumoto T, De Leon T,
Ulat VJ, Ismail AM, Yano M, Wissuwa M: Comparative sequence analyses of
the major quantitative trait locus phosphorus uptake 1 (Pup1) reveal a
complex genetic structure. Plant Biotechnol J 2009, 7:456–471.
12. Wissuwa M, Ae N: Genotypic variation for tolerance to phosphorus
deficiency in rice and the potential for its exploitation in rice
improvement. Plant Breed 2001, 120:43–48.
13. Dordas C: Dry matter, nitrogen and phosphorus accumulation,
partitioning and remobilization as affected by N and P fertilization and
source-sink relations. Eur J Agron 2009, 30:129–139.
14. Rose TJ, Pariasca-Tanaka J, Rose MT, Fukuta Y, Wissuwa M: Genotypic
variation in grain phosphorus concentration, and opportunities to
improve P-use efficiency in rice. Field Crop Res 2010, 119:154–160.
15. Su JY, Xiao YM, Li M, Liu QY, Li B, Tong YP, Jia JZ, Li ZS: Mapping QTLs for
phosphorus-deficiency tolerance at wheat seedling stage. Plant Soil 2006,
2006(281):25–36.
16. Paterson AH, Lander ES, Hewitt JD, Peterson S, Lincoln SE, Tanksley SD:
Resolution of quantitative traits into Mendelian factors by using a
complete linkage map of restriction fragment length polymorphisms.
Nature 1988, 335:721–726.
17. Ni JJ, Wu P, Senadhira D, Huang N: Mapping QTLs for phosphorus
deficiency tolerance in rice (Oryza sativa L.). Theor Appl Genet 1998,
97:1361–1369.
18. Su JY, Zheng Q, Li HW, Li B, Jing RL, Tong YP, Li ZS: Detection of QTLs for
phosphorus use efficiency in relation to agronomic performance of
wheat grown under phosphorus sufficient and limited conditions.
Plant Sci 2009, 176:824–836.
19. Chen JY, Xu L, Cai YL, Xu J: Identification of QTLs for phosphorus
utilization efficiency in maize (Zea mays L.) across P levels. Euphytica
2009, 167:245–252.
20. Zhu JM, Kaeppler SM, Lynch JP: Mapping of QTLs for lateral root
branching and length in maize (Zea mays L.) under differential
phosphorus supply. Theor Appl Genet 2005, 111:688–695.
21. Li YD, Wang YJ, Tong YP, Gao JG, Zhang JS, Chen SY: QTL mapping of
phosphorus deficiency tolerance in soybean (Glycine max L. Merr.).
Euphytica 2005, 142:137–142.
22. Zhang D, Cheng H, Geng LY, Kan GZ, Cui SY, Meng QC, Gai JY, Yu DY:
Detection of quantitative trait loci for phosphorus deficiency tolerance
at soybean seedling stage. Euphytica 2009, 167:313–322.
23. Chaubey CN, Senadhira D, Gregorio GB: Genetic analysis of tolerance for
phosphorous deficiency in rice (Oryza sativa L.). Theor Appl Genet 1994,
89:313–317.
24. Guo ZH, Ding P, He LY, Xu CG: Genetic analysis of agricultural traits in rice
related to phosphorus efficiency. Acta Genet Sin 2006, 33:634–641.
25. Li ZK, Yu SB, Lafitte HR, Huang N, Courtois B, Hittalmani S, Vijayakumar CHM,
Liu GF, Wang GC, Shashidhar HE, Zhuang JY, Zheng KL, Singh VP, Sidhu JS,
Srivantaneeyakul S, Khush GS: QTL × environment interactions in rice. I.
Heading date and plant height. Theor Appl Genet 2003, 108:141–153.
26. Li M, Guo XH, Zhang M, Wang XP, Zhang GD, Tian YC, Wang ZL: Mapping
QTLs for grain yield and yield components under high and low
phosphorus treatments in maize (Zea mays L.). Plant Sci 2010,
178:454–462.
27. Bray EA: Plant responses to water deficit. Trends Plant Sci 1997, 2:48–54.
28. Yu HH, Xie WB, Wang J, Xing YZ, Xu CG, Li XH, Xiao JH, Zhang QF:
Gains in QTL detection Using an ultra-high density SNP map based on
population sequencing relative to traditional RFLP/SSR markers.
PLoS One 2011, 6:e17595.
29. Wang J, Yu HH, Xie WB, Xing YZ, Yu SB, Xu CG, Li XH, Xiao JH, Zhang QF:
A global analysis of QTLs for expression variations in rice shoots at the
early seedling stage. Plant J 2010, 63:1063–1074.
30. Hyten DL, Song QJ, Choi IY, Yoon MS, Specht JE, Matukumalli LK, Nelson RL,
Randy C, Shoemaker RC, Young ND, Cregan PB: High-throughput
genotyping with the GoldenGate assay in the complex genome of
soybean. Theor Appl Genet 2008, 116:945–952.
31. Yan JB, Yang XH, Shah T, Sánchez-Villeda H, Li JS, Warburton ML, Zhou Y,
Crouch JH, Xu YB: High-throughput SNP genotyping with the
GoldenGate assay in maize. Mol Breed 2010, 25:441–451.
32. Rose TJ, Wissuwa M: Rethinking internal phosphorus utilization efficiency:
a new approach is needed to improve PUE in grain crops. Adv Agron
2012, 116:185–217.
Page 15 of 15
33. Jones GPD, Blair GJ, Jessop RSJ: Phosphorus efficiency in wheat - A useful
selection criterion? Field Crop Res 1989, 21:257–264.
34. Xing YZ, Tan YF, Hua JP, Sun XL, Xu CG, Zhang Q: Characterization of the
main effects, epistatic effects and their environmental interactions of
QTLs on the genetic basis of yield traits in rice. Theor Appl Genet 2002,
105: 248–257. 33
35. Murphy J, Riley JP: A modified single solution method for the
determination of phosphate in natural waters. Anal Chim Acta 1962,
27:31–36.
36. Knapp SJ, Stroup WW, Ross WM: Exact confidence intervals for heritability
on a progeny mean basis. Crop Sci 1985, 25:192–194.
37. Xie WB, Feng Q, Yu HH, Huang XH, Zhao Q, Xing YZ, Yu SB, Han B, Zhang
QF: Parent-independent genotyping for constructing an ultra highdensity linkage map based on population sequencing. Proc Natl Acad Sci
USA 2010, 107:10578–10583.
38. Wang DL, Zhu J, Li ZK, Paterson AH: Mapping QTLs with epistatic effects
and QTL × environment interactions by mixed linear model approaches.
Theor Appl Genet 1999, 99:1255–1264.
39. McCouch SR, Cho YG, Yano M, Paul E, Blinstrub M: Report on QTL
nomenclature. Rice Genet Newsl 1997, 14:11–13.
40. Manske GGB, Ortiz-Monasterio JI, van Ginkel RM, Rajaram S, Vlek PLG:
Phosphorus use efficiency in tall, semi-dwarf and dwarf near-isogenic
lines of spring wheat. Euphytica 2002, 125:113–119.
41. Aastveit AH, Aastveit K: Effects of genotype-environment interactions on
genetic correlations. Theor Appl Genet 1993, 86:1007–1013.
42. Ogawa M, Tanaka K, Kasai Z: Accumulation of phosphorus, magnesium
and potassium in developing rice grains: followed by electron
microprobe X-ray analysis focusing on the aleurone layer. Plant Cell
Physiol 1979, 20:19–27.
43. Carlborg Ö, Haley CS: Epistasis: too often neglected in complex trait
studies? Nat Rev Genet 2004, 5:618–625.
44. Wu XS, Wang ZH, Chang XP, Jing RL: Genetic dissection of the
developmental behaviours of plant height in wheat under diverse water
regimes. J Exp Bot 2010, 61:2923–2937.
45. Hu B, Wu P, Liao CY, Zhang WP, Ni JJ: QTLs and epistasis underlying
activity of acid phosphatase under phosphorus sufficient and deficient
conditions in rice (Oryza sativa L.). Plant Soil 2001, 230:99–105.
46. Shimizu A, Yanagihara S, Kawasaki S, Ikehashi H: Phosphorus deficiencyinduced root elongation and its QTL in rice (Oryza sativa L.). Theor Appl
Genet 2004, 109:1361–1368.
47. Cui KH, Huang JL, Xing YZ, Yu S, Xu CG, Peng SB: Mapping QTLs for
seedling characteristics under different water supply conditions in rice
(Oryza sativa). Physiol Plantarum 2008, 132:53–68.
48. Itoh S, Barber SA: A numerical solution of whole plant nutrient uptake for
soil-root systems with root hairs. Plant Soil 1983, 70:403–413.
49. Wissuwa M: Combining a modelling with a genetic approach in
establishing associations between genetic and physiological effects in
relation to phosphorus uptake. Plant Soil 2005, 269:57–68.
50. Mao DH, Liu TM, Xu CG, Li XH, Xing YZ: Epistasis and complementary
gene action adequately account for the genetic bases of transgressive
segregation of kilo-grain weight in rice. Euphytica 2011, 180:261–271.
51. Nagata K, Shimizu H, Terao T: Quantitative trait loci for nonstructural
carbohydrate accumulation in leaf sheaths and culms of rice (Oryza
sativa L.) and their effects on grain filling. Breed Sci 2002, 52:275–283.
Submit your next manuscript to BioMed Central
and take full advantage of:
• Convenient online submission
• Thorough peer review
• No space constraints or color figure charges
• Immediate publication on acceptance
• Inclusion in PubMed, CAS, Scopus and Google Scholar
• Research which is freely available for redistribution
Submit your manuscript at
www.biomedcentral.com/submit