Variability of candidate genes, genetic structure and association with sugar accumulation and climacteric behavior in a broad germplasm collection of melon (Cucumis melo L.)
Bạn đang xem bản rút gọn của tài liệu. Xem và tải ngay bản đầy đủ của tài liệu tại đây (1.49 MB, 17 trang )
Leida et al. BMC Genetics (2015) 16:28
DOI 10.1186/s12863-015-0183-2
RESEARCH ARTICLE
Open Access
Variability of candidate genes, genetic structure
and association with sugar accumulation and
climacteric behavior in a broad germplasm
collection of melon (Cucumis melo L.)
Carmen Leida1, Claudio Moser1, Cristina Esteras2, Ronan Sulpice3,4, John E Lunn3, Frank de Langen5,
Antonio J Monforte6* and Belen Picó2*
Abstract
Background: A collection of 175 melon (Cucumis melo L.) accessions (including wild relatives, feral types, landraces,
breeding lines and commercial cultivars) from 50 countries was selected to study the phenotypic variability for
ripening behavior and sugar accumulation. The variability of single nucleotide polymorphisms (SNPs) at 53 selected
candidate genes involved in sugar accumulation and fruit ripening processes was studied, as well as their
association with phenotypic variation of related traits.
Results: The collection showed a strong genetic structure, defining seven groups plus a number of accessions that
could not be associated to any of the groups (admixture), which fitted well with the botanical classification of
melon varieties. The variability in candidate genes for ethylene, cell wall and sugar-related traits was high and similar
to SNPs located in reference genes. Variability at ripening candidate genes had an important weight on the genetic
stratification of melon germplasm, indicating that traditional farmers might have selected for ripening traits during
cultivar diversification. A strong relationship was also found between the genetic structure and phenotypic diversity,
which could hamper genetic association studies. Accessions belonging to the ameri group are the most appropriate for
association analysis given the high phenotypic and molecular diversity within the group, and lack of genetic structure.
The most remarkable association was found between sugar content and SNPs in LG III, where a hotspot of sugar
content QTLs has previously been defined. By studying the differences in allelic variation of SNPs within horticultural
groups with specific phenotypic features, we also detected differential variation in sugar-related candidates located in
LGIX and LGX, and in ripening-related candidates located in LGII and X, all in regions with previously mapped QTLs for
the corresponding traits.
Conclusions: In the current study we have found an important variability at both the phenotypic and candidate gene
levels for ripening behavior and sugar accumulation in melon fruit. By combination of differences in allelic diversity and
association analysis, we have identified several candidate genes that may be involved in the melon phenotypic diversity.
Keywords: Melon, Climacteric ripening, Sugar, Germplasm collection
* Correspondence: ;
6
Instituto de Biología Molecular y Celular de Plantas (IBMCP), Universitat
Politècnica de València (UPV)-Consejo Superior de Investigaciones Científicas
(CSIC), Ciudad Politécnica de la Innovación (CPI), Ed. 8E, C/Ingeniero Fausto
Elio s/n, 46022 Valencia, Spain
2
Institute for the Conservation and Breeding of Agricultural Biodiversity
(COMAV-UPV), Universitat Politècnica de Valencia, Camino de Vera s/n, 46022
Valencia, Spain
Full list of author information is available at the end of the article
© 2015 Leida et al.; licensee BioMed Central. This is an Open Access article distributed under the terms of the Creative
Commons Attribution License ( which permits unrestricted use, distribution, and
reproduction in any medium, provided the original work is properly credited. The Creative Commons Public Domain
Dedication waiver ( applies to the data made available in this article,
unless otherwise stated.
Leida et al. BMC Genetics (2015) 16:28
Background
Melon (Cucumis melo L.) is one of the most important
crops within the Cucurbitaceae family, presenting a high
variability in fruit traits among different cultivars, ranging from non-sweet fruits that are harvested before maturity and consumed as vegetables, to sweet fruits with
high sugar concentrations that are eaten in salads or as
dessert. Melon has been proposed to have an African
and/or Asian origin [1], and was subject to intense diversification after domestication, with primary centers of
diversity in Central Asia and secondary centers in the
Mediterranean basin and Far East countries.
C. melo has been divided into two subspecies: ssp.
melo, and ssp. agrestis [2]. Recently Pitrat [3] split these
subspecies into 15 botanical groups: ssp. melo, which includes cantalupensis, reticulatus, adana, chandalak, ameri,
inodorus chate, flexuosus, dudaim and tibish (later reclassified as ssp. agrestis by Esteras et al., [4]), and ssp. agrestis,
which includes momordica, conomon, chinensis, makuwa
and acidulus. Among these, melon cultivars belonging to
the cantalupensis, reticulatus and inodorus groups are economically the most important (e.g. cantaloups, western
shippers, galias, ‘Piel de Sapo’ and honeydew).
Melon fruits display a broad range of phenotypic
variation. Melon fruit weight varies from a few grams
to several kilograms (fruits up to 35 kg have been reported), and the shape may be round, oblate, ovate, elliptical or extremely elongated [5-8]. A huge variability
also exists for other characteristics associated with
fruit quality, such as flesh color, sugar content and
aroma [9]. Different combinations can be found, varying from the non-sweet non-aromatic fruits of cultivars
from the flexuosus group to the sweet and aromatic
cantalupensis melons [10].
Differences in sugar content among cultivars mainly
reflect differences in sucrose accumulation [8]. Sucrose
accumulation is controlled by a major gene [9] that
explains the main differences between sweet and nonsweet cultivars, although multiple minor quantitative
trait loci (QTLs) for sugar accumulation have also been
reported [11]. The metabolic pathway of sugar metabolism
in melon fruit has been investigated in several studies
[9,12]. Melon, like other cucurbits is a symplastic phloem
loader that synthesize raffinose and stachyose from sucrose
in specialized intermediary cells in source leaves. These
two raffinose-family oligosaccharides (RFOs), plus sucrose,
are translocated from source leaves to the developing
melon fruit. After phloem unloading in sink organs, the
RFOs are hydrolyzed by acid and neutral α-galactosidases
(AAG, NAG), producing sucrose and galactose. The latter
is phosphorylated by galactokinase and then converted to
glucose 6-phosphate, which can either be respired or used
to synthesize sucrose via sucrose-phosphate synthase
(SPS) and sucrose-phosphate phosphatase (SPP). Sucrose
Page 2 of 17
unloaded from the phloem can be hydrolyzed in the apoplast by cell wall invertase (CIN). The resulting hexose
sugars (glucose and fructose) are imported into cells by
monosaccharide transporters, phosphorylated by hexokinase (HXK) and fructokinase (FK) and used for respiration
or sucrose resynthesis. Sucrose can also be unloaded symplastically. Within the cell, sucrose can be catabolized in
the cytosol by sucrose synthase (SUS) or neutral invertase
(NIN), or imported into the vacuole for storage or hydrolysis by vacuolar acid invertase (AIN), with potential
regulation of the latter by invertase inhibitor proteins
(INH). During early fruit development, sucrose catabolism
predominates, as the carbon and energy derived from
sucrose are needed for growth-related processes. As
the fruit develops, more and more sucrose is stored rather
than respired, and this transition from sucrose catabolism
to storage is characterized by loss of AIN activity. Vacuolar
processing enzymes (VPE) participate in protein maturation in the vacuole and are also implicated as factors in
sugar storage. For example, a reduction in the rate of the
proteolysis of vacuolar invertases can lead to their accumulation and modify sugar metabolism and accumulation
[13]. Some of the genes encoding sugar metabolizing
enzymes and VPEs have been mapped in melon using
specific biparental populations [11,14-16].
Melon also comprises broad genetic variation for ripening behavior, with climacteric and non-climacteric varieties. Typical climacteric melons are found within the
cantalupensis group. These exhibit a distinct peak in respiration and ethylene production at maturity, and generally have a short ripening time and rapidly deteriorate in
quality after harvest [17]. In contrast, melons from the
inodorus group are unable to produce autocatalytic
ethylene [18] and, in general, ripen more slowly and
have a longer postharvest shelf life [19]. This diversity in
ripening behavior makes melon an ideal subject for investigating the physiological and genetic basis for differences
between ethylene-dependent and ethylene-independent
fruit ripening. There have been several studies of the inheritance of climacteric ripening behavior in melon. Perin
et al. [17], investigated the segregation of the formation of
the abscission layer and ethylene production in a climacteric x non-climacteric cross. Both traits were controlled
by two independent loci (Al-3 and Al-4) in linkage groups
(LG) VIII and IX, and four further QTLs in LGs I, II, III
and XI. In a collection of near isogenic lines (NILs) derived
from two non-climacteric genotypes [20-22], one NIL
showed climacteric behavior [14]. This NIL carried two introgressions in LG III and LG VI, and both of them had
QTLs involved in climacteric ripening (ETHQB3.5 and
ETHQV6.3, respectively), which interacted epistatically [23].
Fine mapping studies narrowed down the position of
ETHQV6.3 to a 4.5-Mbp physical region of the melon
genome [23].
Leida et al. BMC Genetics (2015) 16:28
Ethylene affects the expression of many ripening related
genes, in both climacteric and non-climacteric fruits, but
expression of other genes is ethylene independent even in
climacteric fruits [24-26]. Most of the research based on
the regulation of ripening has been focused on the climacteric tomato fruit. The deciphering of the ethylene
biosynthetic pathway, including the isolation of the
two key enzymes, 1-aminocyclopropane-1-carboxylate
(ACC) synthase and ACC oxidase (ACS and ACO)
[25], represented substantial advances in our understanding of the role of this hormone in tomato ripening.
Further insights came from identification of components
of the ethylene perception and signal transduction
pathways. These includes ERS (ETHYLENE RESPONSE
SENSOR) and ETR (ETHYLENE RESPONSE), which
encode membrane proteins involved in signal reception,
RTE1 (REVERSION TO ETHYLENE SENSITIVITY 1)
that might be involved in negative feedback of ethylene
responses, and CTR1 (CONSTITUTIVE TRIPLE RESPONSE 1), which encode a Raf-like kinase that negatively regulates the downstream ethylene response pathway.
Also transcription factors such as ERF (ETHYLENE
RESPONSIVE FACTOR), EIN (ETHYLENE INSENSITIVE), EIL (ETHYLENE-INSENSITIVE LIKE), and EBF
(EIN3-BINDING F-BOX) are involved in ethylene responses [26-28].
In tomato, mapping of mutants showing defects in
fruit ripening, such as ripening inhibitor (rin; also called
MADS-RIN), non-ripening (nor, also called NAC-NOR),
colorless non-ripening (Cnr, also called SPL-CNR) and
NR (never ripe) revealed that all the underlying lesions
were in transcription factor genes [29-31]. Other transcription factors shown to be involved in ripening include
SlHB-1, ETO1, E8 and E4/E8BP. SlHB-1 is a HD-zip
homeodomain protein that interacts with ACO1, decreases
ethylene synthesis and delays ripening [32]. ETO1
(ETHYLENE OVERPRODUCER 1) is a negative regulator of ethylene ACS type2 [33]. E8 is induced in mature
fruits in response to ethylene, although its precise function
is still not well defined [34]. E4/E8 binding protein is a
protein that interacts with E8 promoter sequences, acting
as a positive regulator during fruit ripening [35]. Despite
the discovery of the key factors in fruit ripening [36] and
interactions between them [37], much remains to be
learned before we have a complete understanding of this
complex process.
An array of genomic and genetic tools has become
available in the last few years for melon research, including genetic maps [11], microarrays [38], TILLING and
EcoTILLING platforms [39,40], new mapping populations
such as NILs [41] and double haploid lines (DHLs) [42],
deep transcriptomic sequencing data [43,44], and a
complete genome sequence [45]. These tools are now
being deployed to investigate the physiological and
Page 3 of 17
genetic basis for agronomically important traits in
melon, including fruit ripening and sugar content.
The huge genetic diversity of the species has been
studied with different molecular markers [46]. However,
despite the availability of massive collections of SNPs,
these are still underexploited. Blanca et al. [44] created
the most complete version of the melon transcriptome
to date, using a combination of expressed sequence tags
(ESTs) from Sanger sequencing and next generation
sequencing methods, e.g. 454 (Roche) and SOLID (Life
Technologies Inc). The resulting database contains thousands of in silico identified SNPs, representing the largest collection existing for melon (www.melogene.net).
In an attempt to study the variation of genes involved in
sugar metabolism and the ripening process, we searched
the Melogene database for SNPs located in a set of
candidate genes involved in these processes. We used
this set of SNPs, along with reference SNPs evenly distributed in the genome, to genotype a set of 175 melon
accessions, including commercial varieties, landraces,
and wild or feral melons from over 50 countries, representing the wide diversity within the species. We report the variability of a set of genes involved in
ripening behavior and sugar accumulation in melon
fruit, providing a framework for studying the putative
role of those genes in the diversification of the species,
and to associate allelic variants with the phenotypic
differences within the germplasm.
Results
Germplasm population structure
The genetic diversity of the whole germplasm collection
(Additional file 1) based on SNP variability (Additional
file 2) was analyzed using principal component analysis
(PCA) and STRUCTURE. The PCA approach showed a
clear differentiation between the two subspecies, melo
and agrestis (Figure 1a), so in order to investigate more
subtle genetic structure, we performed the PCA for
each subspecies separately (Figure 1b and c). Within ssp
melo (Figure 1b), the PC1 axis separated inodorus from
cantalupensis and reticulatus cultivars. Taking together
the first two PC dimensions (11.8% and 7.9% of the total
variance for PC1 and PC2 respectively), a group of
Spanish inodorus landraces (located in the upper-right
part of the plot) is clearly differentiated from a group
that includes other Spanish landraces and inodorus and
ameri cultivars from Eastern Europe, Asia and North
Africa (located in the center/lower-right part of the
plot). The cantalupensis types could also be split into
two groups: modern ‘Charentais’ and reticulatus cultivars in the upper-left area, and older cantaloup landraces in the central part of the plot. The non-sweet
flexuosus types were grouped together, but clearly separate from all the sweet melons.
Leida et al. BMC Genetics (2015) 16:28
Page 4 of 17
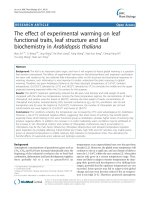
Figure 1 Principal Component Analysis (PCA) based on 210 SNP markers distributed through the melon genome and in candidate
genes for quality traits. a) the PCA analysis for all the germplasm collection. b and c) C. melo ssp. melo and agrestis considered separately.
For ssp. agrestis (Figure 1c), two groups could be distinguished along the PC1 axis (21.4% of the total variance):
African wild agrestis accessions with tibish varieties, and
conomon types that originate from the Far East. The other
accessions of this subspecies, including Indian momordica,
wild Indian agrestis, Indian and African acidulus, Middle
Leida et al. BMC Genetics (2015) 16:28
East dudaim and additional Far East conomon were distributed between the two extreme populations. Some wild
American melons, likely representing African or Asian
introductions, were also found between those populations. Along the PC2 axis (13.8% of the total variance),
the Indian momordica accessions could be distinguished
from the rest. This distribution of the genetic variability
in the PCA space supports previous observations, indicating that Far East conomon varieties represent one extreme
within the overall genetic distribution of melons [5,47],
and that the African and Indian wild melons are genetically distinct [4].
Analysis with STRUCTURE following the Evanno ΔK
approach [48] to determine the number of populations
gave a maximum value when K = 2, with lesser maxima
for K = 5 and K = 7 (Additional file 3). The most strongly
supported division into two subpopulations (K = 2) reflects the classification into two subspecies, agrestis and
melo (Figure 2a), which is supported by most previous
molecular studies [4] and the initial PCA of our complete
dataset. Further resolution into seven sub-groups (K = 7)
was consistent with groupings based on geographical
origin and fruit characteristics (Figure 2b). Five of these
groups belong to ssp. melo and two to ssp. agrestis, with a
small number of accessions in a mixed group that was not
clearly resolved. Within subspecies melo, the cantalupensis
varieties split into two groups. The first includes mostly
French ‘Charentais’ varieties (population 1, dark blue line
in Figure 2b), such as ‘Vedrantais’ and ‘Nantais Oblong’.
The second includes reticulatus melons (population 2, dark
purple line in Figure 2b), with both commercial cultivars
and breeding lines, most of which have an American origin
(e.g. ‘Top Mark’, ‘Dulce’, ‘PMR 45’). Some other commercial American reticulatus cultivars (e.g. ‘Golden Honey’,
‘Golden Champlain’) seem to be a mixture of Charentais
and reticulatus populations. Some other cultivars from
different origins were also included within one of these
groups. Thus, the Japanese ‘Yamato Purinsu’ and the
Chinese ‘China 151’, both considered makuwa types, were
included with the French group although they showed
some commonality with the conomon population (population 6, light purple line in Figure 2b). These two cultivars
have been used in breeding commercial melons due to
their high fruit quality and resistance to viruses [49].
Population 3 (red line in Figure 2b) contains mostly
inodorus varieties, especially Spanish and Portuguese casaba melons, commercial cultivars and landraces of the
market classes ‘Piel de sapo’ (e.g. ‘Pipa de oro’, ‘Piñoncillo’,
‘Piñonet’, ‘Verde Pinto’), ‘Amarillo’ (e.g. ‘Amarillo Oro’, ‘Caña
Dulce’), ‘Tendral’ (e.g. ‘Mollerusa’, ‘Negro de Invierno’),
‘Rochet’ (e.g. ‘Mochuelo’), and ‘Blanco’ (e.g. ‘Crabranco’,
‘Tempranillo’). Other singular Spanish landraces that show
some traits of climacteric ripening including aroma and
flesh softening (e.g.‘Hilo carrete’, ‘Madura Amarilla’,
Page 5 of 17
‘Amarillo Manchado’, ‘Calamonte’, and some ‘Blanco’
types), are not classified in the common market classes. These formed a separate population (Population 4
light blue in Figure 2b) along with inodorus varieties
from Northern Africa, Eastern Europe and Western
Asia (e.g. ‘Muscatello’, ‘Maazoon’, ‘Cassaba golden’,
‘Kirkagac’, ‘Yuva’). This population also included some
Turkish, Russian, Israeli and Egyptian varieties that belong to the highly variable ameri group (e.g. ‘Hassanbey’,
‘Kuvinska’, ‘Ananas Yokneam’, ‘Ananas Dokki’).
A group of accessions from Iran, Uzbekistan and
Russia (e.g. ‘Korca’, ‘Souski’, ‘Ouzbeque’, ‘Gorgab’, ‘Persia’),
which mostly belong to the ameri pool, formed the last
population of subspecies melo (population 5 green line in
Figure 2b). This population showed the highest genetic
variability (gene diversity = 0.22), whereas population 3
showed the lowest (gene diversity = 0.09) (Additional
file 4). Most of the landraces from Eastern and Central
Asia or the Middle East, show high levels of admixture
with one or more ssp. melo populations. There seems to
be a continuous degree of overlap between population 4
and 5 found in most ameri landraces, such as ‘Koljonitza’
and ‘Mucha Nesvi’ from Georgia, ‘Altinbas’ from Turkey,
‘Chandalak’ from Rusia and Mongolia, ‘Tokash’ from
Tajikistan or ‘Mestnaia’ from Kazajistan.
Within the agrestis subspecies, two clear populations
could be distinguished, in agreement with the PCA.
Accessions belonging to different types of the conomon
group (makuwa, chinensis and conomon) from Far
Eastern countries (China, Japan, Korea, and Philippines)
were grouped in population 6 (light purple in Figure 2b).
Wild African agrestis from Ghana, Nigeria and Sudan,
as well as the cultivated tibish from Sudan, which is
considered to represent a first step of domestication in
Africa, are clearly separated from conomon melons
(population 7 orange color in Figure 2b). Most agrestis
accessions from India and America showed a clear mix
between these two populations, supporting a common
ancestral origin.
None of the remaining accessions belonged to any specific population, but exhibited a high degree of admixture
between populations of both subspecies. For example, the
flexuosus varieties from Mediterranean and Middle East
countries, traditionally included in the subspecies melo,
show mixed agrestis-melo patterns. A similar situation is
observed in the dudaim (mix of conomon and reticulatus)
and momordica varieties (mix of the two agrestis populations with ameri and cantalupensis). Momordica has been
traditionally assigned to the agrestis subspecies, but our results reflect the proximity of these agrestis varieties to the
melo group. The subgroups demarcated by the PCA coincide with the sub-populations identified by STRUCTURE
analysis, corroborating division of the overall population
into the designated groups.
Leida et al. BMC Genetics (2015) 16:28
Figure 2 (See legend on next page.)
Page 6 of 17
Leida et al. BMC Genetics (2015) 16:28
Page 7 of 17
(See figure on previous page.)
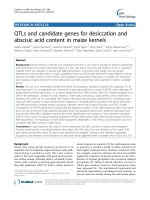
Figure 2 Inferred population structure of the collection using STRUCTURE [75]. Each accession is represented by a line that is partitioned
into coloured segments in proportion to the estimated membership in the corresponding populations. a) Best K choice based on the ΔK
method K = 2; blue line represents melo subspecies and red line agrestis. b) second best choice K = 7; Dark blue line represents ‘Charentains’
group (1), purple line reticulatus (2), red line Spanish Inodorus accessions (3), light blue line a mixture of inodorus and ameri (4), green line mostly
ameri (5), light purple line conomon (6) and orange line African agrestis (7). Abbreviations: Can = cantalupensis, In = inodorus, Am = ameri, Flex = flexuosus,
Cha = chate, Dud = dudaim, Con = conomon, Mom = momordica, Chi = chito, Tibish = tibish, Ag = agrestis. La = landraces. Last three letters indicate the
country of origin.
Variability in fruit traits and ripening behavior
All accessions have been characterized for different fruits
traits: fruit weight, flesh color, sugar and malate content,
and also for traits related to climacteric behavior, such as
abscission layer formation, fruit detachment, and flesh
firmness (Additional file 5). In general, the traits showed a
continuous distribution, fitting or approximating a normal
distribution. Variability within and between sub-populations
was observed for most traits. All cantalupensis and reticulatus cultivars of the structure populations 1 and 2 had fruits
with medium size (average fruit weight ± sd = 816 ± 348 g),
mostly with orange flesh, with medium to high sugar content (°Brix = 9.5 ± 1.5 and 9.1 ± 1.2 in VCO and COMAV trials respectively, and average sucrose content = 97 ± 33 μg/g
fresh weight). These accessions also clearly show strong climacteric behavior, most with a fully formed abscission layer
and fruit detachment, whereas the Spanish group of inodorus landraces (population 3) had bigger fruits (fruit
weight = 1,027 ± 315 g), with green, white or cream
flesh, with higher sugar content (°Brix = 11.1 ± 1.1 and
10 ± 1.7 and average sucrose = 134 ± 44 μg/g fresh weight),
and were mostly non-climacteric with no abscission layer
or fruit detachment.
A higher variability in most traits was observed
among accessions assigned to sub-populations 4 and 5.
These developed medium to large sized fruits (fruit
weight = 1,017 ± 425 and 975 ± 554 g, for populations 4
and 5 respectively), with green, white, yellow, cream or
light orange flesh, and variable sugar content (°Brix =
9.1 ± 2.0 -7.1 ± 2.3 in the VCO trial and 8.0 ± 1.8-7.0 ±
1.9 at COMAV, and sucrose content = 114 ± 42 and 60 ±
46 μg/g fresh weight, respectively in both populations).
The ripening behavior was also variable, including some
Spanish landraces with certain climacteric behavior, typical non-climacteric inodorus and some ameri cultivars
with different degrees of climacteric behavior (from no
to full fruit slip).
Other ssp. melo accessions (cantalupensis, reticulatus,
ameri, and inodorus, and other landraces) that show admixture of two or more of these sub-populations (populations 1 to 5) were also variable for fruit size and flesh
color. Most had medium to high sugar content, but exhibited different degrees of climacteric behavior, ranging
from clearly non-climacteric cultivars to some fully
climacteric cantaloups and ameri accessions, with a wide
range of intermediate behaviors (Additional file 5).
Within the subspecies agrestis, sub-population 6, which
includes conomon, makuwa and chinensis types, showed
small fruits (fruit weight = 464 ± 266 g), mostly with green
or white flesh, and wide variation in sugar levels (°Brix =
7.5 ± 3.1-7.2 ± 2.1 in VCO and COMAV, and sucrose
content = 78 ± 43 μg/g fresh weight). They also showed
different ripening behaviors, ranging from non-climacteric
to weakly climacteric. Similar variation in ripening behavior was also observed in some wild African agrestis melons
(population 7) that turn yellow during ripening and show
signs of forming an abscission layer. However, this population was quite uniform for fruit size, flesh color and sugar
content, developing very small, green-fleshed, non-sweet
fruits (fruit weight = 31 ± 30 g, °Brix = 6.3 ± 3.8-6.9 ± 2.6 in
VCO and COMAV, and sucrose content = 37 ± 53 μg/g
fresh weight). Accessions included in the admixture
melo-agrestis group, consisting of momordica, dudaim,
flexuosus and chate cultivar types, generally had little
or no sugar, and showed weak to strong climacteric
behavior (Additional file 5).
Variability in candidate genes
Out of a total of 251 SNPs assayed, 210 were polymorphic in the population. Of these, 37 were located
in ethylene metabolism or cell wall related genes and
27 in sugar metabolism candidates (Additional file 2).
Variability at ethylene and cell wall related SNPs (gene
diversity = 0.37) is slightly higher than at sugar related
SNPs (gene diversity = 0.31), and similar to reference
SNPs (gene diversity = 0.41) (Additional file 6). SNP
variability among the ethylene and cell wall related
SNPs had a higher weighting than sugar related SNPs
in the first component of the PCA (PC1 in Figure 1a),
which separates the two subspecies (Additional file 7).
This indicated that variability in the ethylene and cell
wall related genes made a greater contribution to the
sub specific genetic structure of the collection than the
sugar-related genes. However, SNPs among all three
groups of genes appeared to make similar contributions to the separation in PC2, which mainly distinguishes African agrestis from the others. Interestingly,
Leida et al. BMC Genetics (2015) 16:28
the candidate genes for ethylene metabolism and cell
wall have a larger contribution in the population differentiation found with STRUCTURE than candidate
genes for sugar content (Additional file 8).
Relationship between candidate gene variation and
cultivar classification
Some SNPs in sugar-related genes have an allele specific
for one of the groups defined by STRUCTURE (Additional
file 9). For example, the C/T SNP in CmINH1, which
causes a non-tolerated (according to SIFT) A126V amino
acid substitution in invertase inhibitor 1 (CmINH1.1),
appears only in the French ‘Vedrantais’ cultivar and some
closely related ‘Charentais’ melons, and in the makuwa
‘Yamato Purinsu’ and ‘China51’ genotypes that are known
to have been used in cantaloup breeding [49]. All these cultivars belong to the STRUCTURE-defined sub-population
1 (Figure 2). They are sweet climacteric varieties that show
a decline in sucrose content upon harvest. Invertase inhibitors potentially play a role in reducing invertase activity,
thereby allowing sucrose to accumulate in the developing
fruits. CmINH1 is the mostly highly expressed of the three
invertase inhibitors at the onset of sucrose accumulation in
the reticulatus ‘Dulce’ genotype [12]. Another SNP in the
3´-UTR region of the same gene, CmINH1.4, is almost
exclusively present in wild agrestis types and tibish from
Sudan. Similar SNPs in other invertase inhibitors, such as a
C/T mutation that causes a tolerated P31S substitution in
CmINHLIKE2.1, have a slightly less restricted distribution,
occurring in other non-sweet, wild African agrestis types as
well as agrestis and tibish from Sudan (all in STRUCTURE
sub-population 7) (Additional file 9). The same allelic distribution is found in a 3´-UTR mutation in the fructokinase
gene (CmFK3), in a non-tolerated C/T (F9L) mutation in
the vacuolar processing enzyme CmVPELIKE2.3, and in a
synonymous C/T (Q721Q) change in CmSUS3 encoding
one isoform of sucrose synthase (CmSUS3.1). Similarly,
the non-tolerated C/A (L267I) mutation in CmSPP1
(CmSPP1.1) is present only in a few African wild types,
tibish cultivars and in some African acidulus. CmSUS3 is
the mostly highly expressed SUS gene during the sucrose accumulating period in reticulatus melons, and
CmSPP1 increases its expression during ripening [12].
Most of these genes make a major contribution to PC2
in Figure 1a (Additional file 7), which mainly separates
African agrestis from other melons. Some of these genes
also make a substantial contribution to the genetic
differentiation among groups (high Fst and R2 from
AMOVA) (Additional file 8).
Other SNPs in sugar-related candidates had more balanced frequencies for both alleles, and allelic variation was
found within specific populations inferred by STRUCTURE
and within the admixture group. Some of these SNPs
showed an interesting pattern among sucrose accumulating
Page 8 of 17
and non-accumulating accessions. For example, most
non-sweet or low-sugar genotypes in several populations (African, Indian and American agrestis, tibish,
acidulus, flexuosus-chate, dudaim, conomon and momordica) had a non-tolerated T/C (S173P) mutation in
CmAIN2 (CmAIN2.3), which also appears in some exotic
medium sugar ameri and cantaloups (e.g. ‘Chandalack’,
‘Pearl’, ‘Earl favourite’, ‘Seminole’, ‘Persian’), but is absent in
the other sweet genotypes. Most cantaloups and all
inodorus had the alternative allele (Additional file 9).
CmAIN2 encodes an acid invertase that is expressed in
young fruits but not at maturity [12,50]. If invertase
activity reflects the change in expression at the transcript level, the enzyme is likely to contribute to sucrose hydrolysis in young fruit but then decrease in
activity as the fruit develops, allowing sucrose to
accumulate in mature fruit.
There are SNPs in the 3´-UTRs of two invertase inhibitor genes (CmINH1.3 and CmINH3.1), and in each
case, one allele tends to occur more frequently in sweet
genotypes (inodorus, cantalupensis and ameri), although
also present in a few low sugar momordica, dudaim and
chate types. Also the CmINHLIKE2.4 SNP (C/T giving rise
to a tolerated S137A substitution), shows a variation pattern similar to that of CmAIN2, with most of the non-sweet
agrestis and melo genotypes (agrestis, tibish, acidulus,
momordica, conomon, dudaim, flexuosus, chate) sharing
the same allele as a few cantaloups. One synonymous
mutation in the coding region of CmVPELIKE3
(CmVPELIKE3.2) and one 3´-UTR change in CmAAG2
(CmAAG2.1) could also be related with sugar content.
The expression studies by Dai et al [12] suggested that
the acid α-galactosidase encoded by the AAG2 gene
plays a role in hexose production only in the early stages
of fruit development in the ‘Dulce’ reticulatus genotype.
This genotype has the C allele, more common in the sweet
genotypes. Most of these mutations are located in the
sugar candidate genes with the highest contributions to
the PC1 in Figure 1a (Additional file 7), which separate
both subspecies. QTLs for sugar accumulation have been
reported previously in the genomic regions linked to some
of the discussed genes, especially CmAIN2 and CmVPELIKE3 (LG IX), and CmAAG2 (LG X) [11].
The ripening-related gene candidates that contribute
most strongly to differentiation between the subspecies
(such as the CNR, AtEIN3, CmACO3 andCmERF3 genes
linked to ethylene metabolism, and the cell wall related
gene CmEXP3) (Additional file 7) have different alleles
in ssp. melo (sub-populations 1-5) versus ssp. agrestis,
(sub-populations 6 and 7), and are almost fixed within
the respective subspecies (Additional file 9). This echoes
the pattern seen for sugar related genes, where some of
the STRUCTURE sub-populations carry a specific allele
for some of the SNPs. For example, the rare alleles of two
Leida et al. BMC Genetics (2015) 16:28
SNPs, CmEIN3LIKEex2 (a G/T change that causes a tolerated L36V substitution) and AtEIN3ex2 (a C/T synonymous substitution of I499I), both located in the same melon
gene MELO3C015633 (an EIL3 transcription factor involved in ethylene signaling [51]), were fixed in the population of inodorus (sub-population 3), mostly composed of
clearly non-climacteric genotypes. The cantalupensis and
reticulatus populations, which are both highly climacteric,
have the alternative allele, which is also more frequent in
all of the remaining populations composed of genotypes
with different degrees of climacteric behavior.
Other SNPs are also differentially distributed between
highly climacteric cantalupensis and reticulatus (subpopulations 1 and 2) and non-climateric inodorus (subpopulation 3). However, in this case the allele associated
with climacteric behavior is also fixed in the conomon
population (sub-population 6), while the allele that is more
commonly associated with non-climacteric behavior appears in populations 4, 5 and 7. The latter three populations show variable levels of climacteric behavior. These
SNPs include a tolerated C/G mutation (H121D) in the
coding region of the cell wall related gene CmXTH5, a
SNP in the 3´-UTR of CmACO3, and a synonymous T/G
mutation (G171G) in CmERF2. All these SNPs contributed to the genetic differentiation of STRUCTURE populations (Additional file 7).
Linkage disequilibrium
Linkage disequilibrium (LD) was studied in order to
assess the possible degree of linkage between SNPs
Page 9 of 17
associated with the studied traits (see below) and real
causal SNPs. Wild melon accessions were excluded because the fruits from these accessions differed in too many
respects from fruits of cultivated accessions, making direct
comparisons difficult if not impossible. Intra-chromosomal
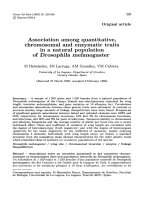
LD showed a rapid decay within a physical distance of less
than 0.5 kbp, but increases from 0.5 to 1 kbp and then
decreases rapidly with larger distances (Figure 3). This is
similar to the results of Esteras et al. [4], who found that
the LD extension decayed at less than 3 kbp. Thus, in the
current data set, causal SNPs are expected to be very
closely linked to the SNPs that are significantly associated
with trait variation.
Association analysis for sugar and organic acid content
Association analysis was investigated using either a general
linear model (GLM) or mixed linear model (MLM) approach, with the latter method being used to correct for
the effect of genetic structure. GLM analysis gave a high
number of significant associations (Additional file 10), including a consistent association of SNPs in sugar candidates (such as CmINHLIKE2.1 and CmAIN2.3) with Brix
and sucrose content, whereas MLM analysis provided only
a few significant associations (Table 1). The larger number
of associations obtained by GLM is attributable to the
strong genetic structure in the current germplasm sample,
so we focussed on the MLM results, which are likely to be
more robust.
Three SNPs located in different genomic regions,
CMPSNP711, SlERF1 and SlERF3 (Additional file 2)
Figure 3 Linkage disequilibrium (r2) versus physical distance (kb) in the accessions considered for the association linkage analysis.
LD extension is shown for a subpopulation of melons, excluding African agrestis, and was used in the association analysis for fruit quality
traits. The false discovery rates p < 0.05 and p < 0.01 are indicated with black and grey dashed lines respectively. Curves were fitted by
second degree LOESS.
Leida et al. BMC Genetics (2015) 16:28
Page 10 of 17
Table 1 Markers associated with melon fruit traits of interest
Marker
Transcription model Chr locus_position R2
MLO65044.1
MELO3C005044
12
3625217
0.111 5.475E-05
1481
C/T
L454L
PSI_41-B07
MELO3C021426
11
22820373
0.134 1.996E-05
593
C/T
F167F
BRIXVCO
SlERF1
MELO3C011287
3
22138473
0.133 2.598E-05
208
C/T
N62N
BRIXCOMAV
CMPSNP711
MELO3C021106
1
26308138
0.103 0.0001498 2382
C/T
3´UTR
p value
Nucleotide position SNP AA change
Climacteric behavior
ABCISSION LAYER
Firmness
FLESHFIRMESSVCO
Sugar
BRIXCOMAV
SlERF1
MELO3C011287
3
22138473
0.131 1.839E-05
208
C/T
N62N
Sucrose
SlERF1
MELO3C011287
3
22138473
0.112 7.56E-05
208
C/T
N62N
Sucrose
SlERF3
MELO3C002624
12
20075012
0.132 3.144E-05
481
A/G
Q138Q
Organic acid
malic acid
CmINHLIKE2.2 MELO3C017187
2
22908768
0.101 0.0001873 245
C/T
S60S
malic acid
AtEIN3ex4.2
MELO3C019931
3
17934192
0.084 0.0003247 1464
C/T
F375F
malic acid
CMPSNP677
MELO3C009586
4
26788563
0.088 0.0002695 2976
C/G
3´UTR
C_FLESH
CmXTH5
MELO3C012004
10
3358353
0.167 1.339E-06
583
C/G
H121D
C_FLESH
CmERF2ex2
MELO3C012242
10
1742964
0,149 7.931E-06
741
G/T
G171G
C_FLESH
MLO625760.1
MELO3C025760
11
22071980
0,095 0.0002283 384
A/G
Q128Q
Fruit color
Results are shown for markers that are significantly associated with various fruit ripening and sugar content traits, based on a mixed linear model (MLM) analysis
of association using TASSEL [77]. Bonferroni’s correction was applied and the R2 and p-values for each association are indicated.
were associated with sugar content (Table 1). These
were also significant with GLM analysis (Additional
file 10). Although initially selected as a reference
marker [4], CMPSNP711 in LG I was found to be
associated with soluble solids content (°Brix) in the
COMAV trial. This SNP is a 3´-UTR mutation in the
MELO3C021106 gene, which putatively encodes xyloglucan glycosyltransferase 6. The C allele is more common in
accessions producing fruits with low sugar content. It is
fixed in sub-populations 6 and 7, comprised of low sugar
conomon and non-sweet African agrestis accessions. The
alternative allele is fixed in populations 1, 2 and 3 (sweet
cantalupensis and Spanish inodorus), except in the Apelsinaja cultivar from Russia, the accession with the lowest
brix degree in sub-population 2. Sub-populations 4 and 5
and the admixture group, with variable sugar content,
contained both alleles, with the C allele occurring more
frequently in the less sweet genotypes (Additional file 9).
CMPSNP711 is located in a more distant part of chromosome I than other sugar content QTLs that have been
mapped to the same linkage group [11].
Two melon orthologs of tomato ethylene responsive
factors genes, SlERF3 and SlERF1 [52], carrying synonymous A/G (Q138Q) and C/T (N62N) mutations, respectively, were also found to be significantly associated
with sugar content (Table 1). The A allele of the SlERF3
SNP was fixed in the non-sweet African agrestis (subpopulation 7), and frequent in the low sugar genotypes
of the admixture group. The alternative G allele was
fixed in the remaining populations, as defined by the
STRUCTURE analysis, and correlates with higher °Brix
content in the admixture group. This SNP is located in
LG XII in a region in which QTLs for sugar content have
been reported previously [11]. Interestingly, mutation of
SlERF1, located in LG III was consistently associated with
soluble solids content in both trials and to sucrose content.
The C allele is more frequent in conomon, cantalupensis
groups (both Charentais and reticulatus) and Spanish
inodorus, while European and Asiatic inodorus and ameri
share the alternative allele with African agrestis and most
of the low sugar types of the admixture group (acidulus,
flexuosus, chate and momordica) (Additional file 9). A hotspot of QTLs involved in sugar accumulation has been
described previously on this region of LG III [11].
Fruit flavor is also affected by acidity. Malic acid content was significantly associated with CmINHLIKE2.2,
CMPSNP677 and AtEIN3ex4 (Table 1, Additional file 9).
The SNP in the invertase inhibitor gene CmINHLIKE2
corresponds to a synonymous T/C (S60S) mutation. The
C allele found in all conomon was also present in flexuosus,
chate, dudaim, momordica, acidulus and some wild
American and Indian agrestis, all accessions with acid pulp
rich in malic acid. The 3´-UTR mutation in CMPSNP677
(MELO3C009586 encoding a melon orthologue of the
Arabidopsis ubiquitin carboxyl-terminal hydrolase 12-like
protein) was initially selected as a reference SNP, but was
Leida et al. BMC Genetics (2015) 16:28
also found to be related to malic acid content. The allelic
distribution was similar to that of CmINH-LIKE2.2, except
that the conomon allele is shared not only with flexuosus,
dudaim, momordica, acidulus and wild American and
Indian agrestis, but also with African agrestis. QTLs for
glucose, fructose and soluble solids have previously been
located in the chromosomal region of LG IV where this
gene is located [11]. Finally, a synonymous C/T mutation
(AtEIN3ex4.2 F375F) in AtEIN3 was also associated with
malic acid content. For this SNP, the conomon allele is
shared with acidulus and Indian and American wild types.
In Arabidopsis, the AtEIN3 transcription factor plays a
role in ethylene signaling downstream of the ETR1 ethylene receptor, and is involved in fine tuning of the ethylene
response [28]. The association observed in the present
work suggests a potential role for this transcription factor
in regulating organic acid content in fruit.
Page 11 of 17
flesh (gf ) and white flesh (wf ), which interact epistatically
[54] and give rise to orange, white or green flesh depending on the gene combination. The gf gene has been
mapped to chromosome VIII [20,47], while wf is located
on chromosome IX [17]. Nevertheless the variability in
the intensity of flesh color suggests that the phenotypic
influence of the two major genes is modulated by the action of other genes, and minor QTLs for color intensity
have been mapped to chromosomes III, VI and VII
[10,20]. MLM showed several mutations associated with
the variation in the color parameter chroma C, the nonsynonymous mutation in CmXTH5, the synonymous
changes in CmERF2ex2, and MLO625760.1, a gene in LG
XI that encodes an MLO-like protein (Table 1). The same
region (16-27 cM) contains a SNP in a ZEAXANTHIN
EPOXIDASE (ZEP) gene [11]. The results obtained here
suggest a contribution from chromosome X and XI that is
worth further investigation.
Association analysis for fruit ripening
Similarly to what occurred with sugar related gene candidates, the GLM analysis showed associations with some
ripening candidates. For example, a non-synonymous,
tolerated mutation (H121D) in CmXTH5 located in LG X,
was associated with formation of an abscission layer and
fruit detachment (Additional file 10). The alternative
alleles of this gene are fixed in the highly climacteric and
the non-climacteric cantalupensis and inodorus, as described above (Additional file 9). Furthermore CmXTH5
was mapped in the same region as a QTL for fruit firmness on LG X [14].
MLM showed a significant association with the same trait
of MLO65044.1, a synonymous C/T mutation (L454L) in
an MLO-like gene [53] located in LG XII (Table 1). The
homozygous CC genotype is found exclusively in most inodorus types of Spanish, Turkish or Portuguese origin, which
are mostly non-climacteric, whereas most other accessions
have a homozygous TT genotype, including both climacteric and non-climacteric types. No QTLs related to climacteric ripening or fruit abscission have been reported before
in this chromosome region [11,17].
Fruit firmness is also related to ripening behavior. MLM
found the marker PSI_41-B07 SNP (C/T, F167F), on LG
XI, significantly associated with the variation in this trait.
In this region a QTL for flesh firmness was previously reported [11]. The T allele is present in the great majority of
the germplasm, while the C allele is characteristic of conomon, African and Indian wild agrestis and acidulus, which
had the highest values for firmness.
Association analysis for flesh color
Fruit flesh color is also related with both fruit quality
and ripening behavior, as the flesh of most climacteric
genotypes changes from green to orange during ripening. Flesh color is controlled by two major genes, green
Discussion
PCA and STRUCTURE analyses carried out in the
current study, based on SNPs located in reference and
candidate genes, provided a germplasm stratification and
classification very similar to previous works based on
other marker systems or un-selected SNPs [4,5,47]. Therefore, the variability in sugar- and ripening-related genes
appears to reflect the known genetic variability of this species. This observation is supported by the fact that gene
diversity at candidate genes is just slightly lower than in
reference genes.
Our results confirm that the highest genetic variability
among cultivated melons occurs in Western and Central
Asia and in the Middle East, where a high degree of genetic admixture was found. This admixture is not unexpected in melon, as no major geophysical barriers are
found in the geographical distribution of traditional
melon varieties, so gene flow among different regions is
not impeded. Asian varieties are thought to be the likely
ancestors of the cantalupensis and inodorus group
[5,55]. In fact, some known current cultivars and landraces from France, Spain, Italy, Israel, Japan, and USA
that do not fit to the cantalupensis Charentais, reticulatus or inodorus morphotypes completely, show variable
admixture degrees of several sub-populations.
Our results indicate that SNPs in ripening related candidates, both ethylene and cell wall related, have a higher
weight than SNPs in sugar candidates on both subspecies and sub-population stratification. This might
reflect the effect of human selection in the development
of strictly non-climacteric and high climacteric cultivars
within ssp. melo. In contrast, selection for strictly climacteric or non-climacteric ripening was probably less
intense within the ssp. agrestis cultivars, which more
frequently show an intermediate ripening behaviour. A
Leida et al. BMC Genetics (2015) 16:28
number of consistent QTLs involved in climacteric ripening have been described previously [14,17,18,23].
However, QTLs for sugar content have been found less
consistently [16,20,47], indicating a higher heritability
of ripening-related QTLs. Traditional farmers might
have exerted a stronger selection for ripening traits,
selecting alleles underlying ripening phenotypic variability more efficiently and thereby fixing the alleles
within a particular cultivar group.
Association of candidate SNPs with phenotypic variability has been investigated by two approaches: (i) by
looking for alleles that are fixed or have a higher frequency within horticultural groups with characteristic
phenotypic features, and (ii) by association analysis.
Sugar content and ripening behavior were clearly related
with genetic structure, so the use of MLM models to adjust for genetic structure would also reduce the power to
detect associations. MLM analysis has resulted in a
much smaller number of SNPs associated with the studied traits. This could be due to lack of linkage or to the
association between genetic structure and trait variability, as alleles that are close to being fixed within groups
could not be associated significantly after adjusting for
population structure in the MLM analysis. Nevertheless,
a consistent association of the SlERF1 SNP and sugar content has been found on LG III. This linkage group contains a sugar content QTL hotspot [11], and was also
found to be significantly associated with sugar content in
a previous study [56], providing good evidence that this
region contains genes that influence sugar accumulation.
Allelic differentiation analysis provided information
that is complementary to the association results. Some
SNPs in sugar-related candidate genes appeared in genotypes with common features in sugar content. These include SNPs that could be related with the mechanisms
that prevent sugar accumulation in African melons, such
as SNPs in invertase inhibitor genes (CmINH1 and
CmINHLIKE2) and in other genes encoding enzymes or
proteins involved in sugar metabolism (CmFK3, CmVPELIKE2, CmSUS3 and CmSPP1). Also of interest are mutations with more balanced allele frequencies and those with
differential patterns of variation within sugar accumulating
and non-accumulating groups, such as the mutation in
the acid invertase CmAIN2 and other sugar-related genes
(CmVPELIKE3 or CmAAG2). The fact that these three
genes co-localize with previously reported QTLs for sugar
content in LG IX and X [11] gives support to their role in
sugar content variation. It is worth noting that the more
permissive GLM analysis provided consistent association
of SNPs in these three candidates (CmAIN2.3, CmINHLIKE 2.1 and CmVPELIKE3.2) with °Brix values in both
locations and with sucrose content.
Both GLM and MLM gave significant associations
of traits related with ripening behavior, such as the
Page 12 of 17
formation of the abscission layer and flesh firmness,
with reference SNPs in genes located in LG XII and
XI, the latter being co-localized with a QTL for flesh
firmness [11] (Table 1 and Additional file 10). However,
association of ripening-related candidate genes with these
traits was only detected by GLM. For example, the mutation in CmXTH5, a xyloglucan endotransglycolase/hydrolase that contributes to xyloglucan depolymerization in
ripening fruit, had contrasting genotypes in cantalupensis
and inodorus groups and was consistently associated with
the formation of abscission layer and fruit detachment.
The co-localization of this gene with a QTL for fruit firmness in LG X [14] provides further evidence that CmXTH5
could be a candidate gene for the QTL. Other candidate
regions found to be associated to the formation of the abscission layer with GLM mapped in regions of LG II, III,
and VI that carry QTLs involved in climacteric ripening
[11,23]. In addition, ethylene pathway candidate genes
(ACS1, ETR1, AtEIN3), that map to regions in which
QTLs for ripening in LG III, V and VII have been previously reported, were found to be associated with fruit
firmness. However, further studies are needed to see if
these mutations affect gene expression or gene function,
as this differential allelic distribution might also be an
effect of the population structure.
Our study shows that association and allelic differentiation analysis could be used as complementary approaches in highly structured populations, such as the
current one, in order to define candidate genes. A highly
variable germplasm collection with low genetic structure
would be necessary to increase the power of association
studies in melon. The ameri group showed both high
phenotypic and genotypic diversity. Therefore, cultivars
from this group, along with cultivars from related
admixture groups from the Near-Middle East region,
would provide a suitable genotype set for association
analysis in melon.
Conclusions
The analysis of SNPs in sugar metabolism and ripeningrelated genes, and also in reference genes, has revealed
differences in the amount of genetic diversity among the
main groups. Ripening-related genes seem to contribute
more to this structure than sugar metabolism related
genes. We found specific alleles of candidate genes fixed
in cultivar groups concomitant with differences in sugar
or ripening behavior. This could be due to ancient selection of these alleles by early farmers, but given the
strong genetic structure, it is not currently possible to
distinguish between direct selection or genetic drift.
Nevertheless, some SNPs were still found to be associated with ripening behavior or sugar accumulation
even after taking the genetic structure of the collection
into consideration. As LD is extremely low in melon
Leida et al. BMC Genetics (2015) 16:28
germplasm, these SNPs should be tightly linked to the
causal SNPs. Taking into consideration the low LD, the
strong genetic structure of melon germplasm, and the
relatively high phenotypic and genotypic diversity found
among accessions of Near-Middle East origin within the
admixture group, it should be feasible to define a panel of
accessions derived from this group that has minimal genetic structure but retains sufficient genetic diversity for
association analysis after more extensive genotyping.
Methods
Plant material
The panel of melon genotypes used in this study consisted
of 175 accessions of diverse origins (Additional file 1), with
all of the major types identified by Pitrat [3] within the
two subspecies, C. melo ssp. melo and C. melo ssp. agrestis,
being represented by multiple accessions. This was based
on a previously assembled core germplasm collection [4,57],
supplemented by germplasm from the Cucurbit Breeding
group at the Institute for the Conservation and Breeding of
Agrobiodiversity (COMAV) in Valencia and is currently
conserved at the COMAV genebank (www.comav.upv.es).
Subspecies melo accessions included the commercially important groups inodorus, cantalupensis and reticulatus. The
inodorus group contains commercial cultivars, Spanish
landraces and traditional cultivars from Southern and
Eastern Europe, North Africa and Asia. The cantalupensis
group includes accessions widely grown in Europe, such
as ‘Charentais’ types and other French, American, Israeli
and Japanese cantaloupes, commercial reticulatus varieties
and other cantalupensis types. The rest of the ssp. melo
accessions belong to ameri, chandalak, adana, flexuosus,
chate and dudaim groups from Southern and Eastern
Europe, Northern Africa, Central Asia and India. The
agrestis subspecies was represented mostly by accessions of Asian and African origin. Momordica from
India, conomon, makuwa and chinensis from Far-East
Asia, and Indian wild melons together represented the
Asian melon diversity. Tibish cultivars from Sudan,
considered as the most primitive melon known, cultivated
acidulus and wild melons from Africa were also included.
SNP selection
Three collections of SNPs were selected: (i) reference
(148 SNPs), (ii) sugar metabolism related (43 SNPs), and
(iii) ripening related (including ethylene related elements
as well as genes encoding enzymes for cell wall degradation) (60 SNPs) (Additional file 2). The reference SNPs
were chosen to define the genetic structure of the collection, and were extracted from a larger SNP collection genotyped in a set of accessions that collectively represents
the full range of variation within the species, most of
which were included in the current study [4]. The criteria
for reference SNPs selection were: (i) even distribution
Page 13 of 17
throughout the genome; and (ii) variation in the germplasm collection representative of the variability within
the species (preferably with a major allele frequency
(MAF) of less than 80%) [4].
The SNPs of the candidate genes were selected from a
SNP collection generated after resequencing eight pools
of accessions representing the main melon botanical
groups [44], most of which are common with the collection described in [4] and are included in the current
study. All are in the SNP collection in the Melogene
database (www.melogene.net).
Candidate SNPs were selected from the full SNP collection by using the BLAST algorithm to search the sequences
for candidate genes against the Melogene database. The
genome position of candidate gene SNPs was defined according to melon genome assembly v3.5, and their position
in the genetic map was also established relative to the
mapped refrence SNPs, using the anchorage of the genome
sequence to the genetic map available in the Melonomics
database (www.melonomics.net) [4,45]. The following criteria were also used to select SNPs in candidate genes: (i)
location in the coding region (preferably causing nonsynonymous substitutions) or in the 5´- or 3´-untranslated
regions (UTRs) of candidate genes; (ii) not linked to
other SNPs (≥100-bp distance); (iii) not close to an intronic region; and (iv) preferably having a MAF of less
than 80%.
Forty-three SNPs were located in nineteen candidate
genes related to sugar metabolism. Thirteen of these
candidate genes were selected from those reported in
previous studies (acid α-galactosidases CmAAG1 and
CmAAG2, sucrose synthases CmSUS2 and CmSUS3, sucrose P phosphatases CmSPP1 and CmSPP2, fructokinase CmFK3, soluble acid invertase CmAIN2, cell wall
acid invertases CmCIN3 and CmCIN4, and invertase
inhibitors CmINH1, CmINH2 and CmINH3). Dai et al.
[12] analyzed the expression of these candidate genes
during fruit development and ripening in cv. ‘Dulce’, a
sweet melon from the reticulatus group, using publicly
available data from the ICUGI melon EST database
(www.icugi.org). Some of them were mapped by HarelBeja et al [16] and Diaz et al [11] and colocalize with
QTLs associated with sugar content. Additional candidates were identified directly in the melon genome database according to their annotation (www.melonomics.net)
(CmAAG3, CmAAG4, CmINHLIKE2, CmVPELIKE 1,
2 and 3 (Additional file 2).
Thirty four candidates involved in ethylene biosynthesis, signal reception and signaling, and cell wall disassembly were selected from the Melonomics database
based on their genome annotation and information from
previous studies in melon [58], tomato mutants [52],
grapevine [59], Arabidopsis thaliana [60], apple [61]
and peach [62] (Additional file 2). Ethylene receptors
Leida et al. BMC Genetics (2015) 16:28
and signal transduction elements such as CmETR1 [11]
and the melon orthologs of the following genes were
selected: (i) PpERS1 from Prunus persica (ERS1PRUPE);
(ii) VvETR2, VvRTE1 and VvCTR1 from Vitis vinifera; (iii)
AtCTR1 from Arabidopsis thaliana; and (iv) SlETR3 from
Solanum lycopersicum. SlETR3 (NR) was previously identified in the NR (never ripe) tomato mutant [63-66].
Furthermore, genes encoding components of the ethylene
signalling pathway downstream of CTR1 were also analyzed. These included the melon orthologue of AtEIN3,
other genes annotated as EIN3 or EIL (CmEIN3LIKE,
CmEIN3LIKE2 and CmEIL3) in the Melonomics database,
and the melon orthologue of the SlEBF gene of tomato
[67], which controls EIN3 degradation in the nucleus.
Other candidates were regulatory elements that affect
ACS activity (CmE8, E4/E8, CmETO1LIKE and the melon
orthologue of SlHB1) [32,36], ethylene responsive factors
(CmERF1, CmERF2, CmERF3, the melon othologue of the
apple MdERF2, two melon orthologs of the tomato genes
SlERF1 and SlERF3) [14,52,62], and the melon orthologs
of the tomato ripening mutants Cnr and rin [31,68]. Genes
co-located with the major QTLs for ripening, or coding
for proteins involved in ethylene synthesis and signaling,
e.g. SlSBP and CmETHIND were also included in the SNP
analysis, using information from melon genetic maps
[11,14,15,23]. Finally, genes encoding proteins involved in
cell wall degradation were considered, such as expasin3
(CmEXP3), which has been hypothesized to contribute
to hemicellulose depolymerization, and CmXTH5, which
encodes a xyloglucan endotransglycolase/hydrolase that
contributes to xyloglucan depolymerization in ripening
fruit [69].
The effect of the variants was analyzed with SIFT
(Sorting Intolerant from Tolerant, />which predicts whether an amino acid substitution will
significantly affect protein function. Scores below 0.05
indicate a strong probability that protein function will
be affected by the mutation [70] (Additional file 2).
Page 14 of 17
Melon fruit phenotyping
The whole collection was phenotyped in two locations.
Three randomized plants per accession were grown in
Valencia (Spain) (39°28′11″ N- 0°22′38″ W) at COMAVUPV greenhouse facilities, and in VCO’s St Rémy station
(France) (43°47′18″ N- 4°49′54″ E), during spring/summer
2008. The following fruit traits (one fruit per plant) were
analyzed: (i) fruit weight; (ii) flesh color ( L*C*h*, lightness, chroma and hue angle were measured with a Minolta colorimeter, at COMAV facilities, while at VCO,
color was scored visually on the following scale: 1 = green,
2 = green-white, 3 = green-yellow, 4 = white, 5 = cream,
6 = yellow, 7 = orange, 8 = orange-green, 9 = orange-white,
10 = other); (iii) total soluble solids, °Brix (measured from
drops of juice using a Milwaukee MR32ATC refractometer); and (iv) flesh firmness (measured using a fruit pressure tester FT327 with a plunger diameter of 8 mm).
Flesh color, firmness, and total soluble solids were measured at four points in the equatorial region of the mesocarp. Samples of flesh tissue from the same region were
harvested for metabolite analysis from fruits grown at
COMAV, immediately frozen in liquid nitrogen and stored
at -80°C until analysis. Soluble sugars (glucose, fructose
and sucrose) and malate were measured enzymatically in
ethanolic extracts as described in Stitt et al. [72].
From the classical markers of climacteric ripening
(peak in ethylene production, degreening of the rind,
aroma production, formation of an abscission layer and
fruit detachment), formation of an abscission layer and
fruit detachment were selected as the most amenable for
high-throughput phenotyping to classify the accessions as
climacteric or non-climacteric. Formation of an abscission
layer was scored visually in the assay performed at
COMAV-UPV on a scale from zero (no abscission layer)
to four (fully formed abscission layer). Fruit detachment
was scored visually in the assay performed at VCO on the
scale 1 = absent, 2 = no slip, 3 = half slip, 4 = full slip.
Genetic variability analysis
Sequenom MassARRAY® assay
Total DNA was extracted from each genotype in the collection, from young leaves, by the method described in
Doyle and Doyle [71] with minor modifications [4]. To
improve the quality of the obtained DNA, 70% ethanol
containing 15 mM ammonium acetate was used in the
final wash, and the DNA was treated with RNAse A.
DNA concentrations (in TE buffer) were measured on
an ABI7900 (Applied Biosystems) using PicoGreen fluorescent dye and adjusted to 50 ng/μl. SNP genotyping was
performed using an iPLEX® Gold MassARRAY® Sequenom system at the eEpigenetic and Genotyping unit of
the University of Valencia (Unitat Central d´Investigació en
Medicina (UCIM), University of Valencia, Valencia, Spain).
The genetic diversity of the germplasm collection as a whole
was assessed by principal component analysis (PCA) using
the ‘adegenet 1.4-0’ package in the R project for statistical
computing (version R.14.1; www.r-project.org) [73,74]. The
population genetic structure was also analyzed with
STRUCTURE v.2.3.3 software [75]. Twenty independent
runs for each K value ranging from 2 to 10 were performed with a burn-in length of 500,000 and 1 million
iterations. The optimal subpopulation was calculated
from the second order rate of change of likelihood
(ΔK method) [48].
Basic genetic variability parameters, MAF, gene diversity (expected heterozygosity), observed heterozygosity
(Ho) and Fisher’s fixation index (Fis) were calculated for
each locus with PowerMarker 3.5 [76]. In order to
Leida et al. BMC Genetics (2015) 16:28
investigate which SNPs could be responsible of the genetic
structure, Fst and Analysis of Molecular Variance
(AMOVA) were also studied for each SNP using the
STRUCTURE defined groups with PowerMarker 3.5.
LD estimation
TASSEL v 5.0 [77] () was used
to estimate the LD parameter r2 and the comparison-wise
significance was computed from 1000 permutations. LD
decay was drawn as a smooth line from r2 against distance
in kb, fitting the data using a second-degree, locallyweighted scatterplot-smoothing LOESS [78], implemented
in an Excel plug-in [79]. A critical value of r2 was derived
from a distribution of the unlinked r2. The parametric
95th and 99th percentiles of the unlinked-r2 distribution
were taken as a population specific critical value of r2.
Association analysis
Association analysis was investigated by general linear
(GLM) and mixed linear models (MLM) implemented in
TASSEL v. 5.0. In order to control genetic structure
effects, a kinship matrix was calculated using reference
SNPs Associations were considered statistically significant
for an experimental-wise threshold p < 0.05 after adjusting
by the Bonferroni’s correction based on the total number
of tested markers (p < 0.000333 for individual test).
Page 15 of 17
of 8 mm) in two locations, in Valencia (Spain) at COMAV facilities, and in
VCO’s St Rémy station (France). Additional fruit traits were analyzed at
COMAV: fruit weight, flesh colour (measured with a Minolta colorimeter,
L*C*h*, lightness, chroma and hue angle), and the formation of an
abscission layer (scored visually on a scale from zero, no abscission layer,
to four, fully formed abscission layer). Samples of flesh tissue were
harvested for metabolite analysis (glucose, fructose and sucrose and
malate) from fruits grown at COMAV. Additional fruit traits were analyzed
at VCO: fruit detachment (scored visually on the scale 1 = absent, 2 = no
slip, 3 = half slip, 4 = full slip) and flesh color (scored visually on the scale
1 = green, 2 = green-white, 3 = green-yellow, 4 = white, 5 = cream, 6 = yellow,
7 = orange, 8 = orange-green, 9 = orange-white, 10 = other).
The subspecies, the cultivar group and the population or population mixture,
according to STRUCTURE results in Figure 2, are indicated for each accession.
Additional file 6: Genetic Diversity parameters for the candidate
genes for ripening and sugar accumulation as well as for referencel
markers. MAF indicates Major Alelle Frequency, gene diversity is the
expected heterozygosity and Ho refers to observed heterozygosity.
Additional file 7: Loading for PC1 and PC2 of candidate genes for
ripening, including ethylene and cell wall related, (orange) and
sugar accumulation (blue).
Additional file 8: Contribution of the candidate genes (orange
ripening, including ethylene and cell wall related, blue sugars) to
the genetic differentiation among groups based on STRUCTURE
analysis. The SNPs with higher contributions are listed on the first
column followed by the category candidate gene. Fst and percentage of
variance (R2) among groups explained for each locus after AMOVA are
depicted in the last columns.
Additional file 9: Genotyping results for the polymorphic SNPs in
the germplasm collection. Colors indicate the 7 groups of STRUCTURE
in Figure 2.
Additional file 10: Significant markers associated to the trait of
interest from GLM analysis by using TASSEL. The analyzed traits are
described in Additional file 5.
Additional files
Additional file 1: Melon germplasm analyzed in the current study.
A given number, code, country of origin and local/commercial name is
given for each accession. Accessions are classified according to the
Cucumis melo subspecies (ssp. melo and ssp. agrestis) and cultivar group
(cantalupensis, reticulatus, inodorus, ameri group (including ameri, adana
and chandalack), flexuosus (including chate) and dudaim within ssp. melo
and momordica, acidulus, conomon (including chinensis, conomon and
makuwa), tibish, chito and agrestis, within ssp. agrestis), and others i.e.,
classification not clear.
Additional file 2: List of genes considered in the association study.
Their position in the genome and scaffold according to Garcia-Mas et al. [45],
gene name and annotation according to Melogene (www.melogene.net)
and Melonomics (www.melonomics.net), position in the genetic map
according to Esteras et al. [4] are reported. AA represents the aminoacid
change due to the SNP and the effect of the mutation screened by SIFT.
Additional file 3; Estimated number of clusters obtained with
STRUCTURE for K values from 1 to 10 using SNPs data for the all
germplasm collection. a) Graphical representation of estimated mean
L (k) and b) its derivative statistics ΔK. The graph below was obtained
excluding k = 2 in order to evidence the subpopulations present in the
germplasm. c) Table summarizing parameters of STRUCTURE simulations
performed for each present K: mean likelihoods of models, their standard
deviations, ΔK.
Additional file 4: Genetic diversity parameters present in each
group defined from STRUCTURE analysis. MAF indicates Major Alelle
Frequency, gene diversity is the expected heterozygosity, Ho the
observed heterozygosity, and Fis is Wright's fixation index.
Additional file 5: Quantitative traits measured in the study for each
accession (mean). The collection was phenotyped for Brix degree
(measured from drops of juice using a refractometer) and for flesh
firmness (measured using a fruit pressure tester with a plunger diameter
Competing interests
The authors declare that they have no competing interests.
Authors’ contributions
BP, CE, JEL, RS and FdL phenotyped the collection in the different localities
and performed the chemical analysis of sugars and organic acids. BP and
CE genotyped the collection; CL and AM performed the data analysis and
statistical computation; BP, CL and AM selected the SNPs, designed the
experiment, and drafted the manuscript. CM, JEL, RS and FdL contributed
to the critical review of the manuscript. All authors read and approved the
final manuscript.
Acknowledgments
C.L. is recipient of a Marie Curie Career Integration Grant (CIG) and her visit to
IBMCP-COMAV (Valencia) is supported by ESF Cost Action “FA1106 Quality
Fruit” - Short-Term Scientific Mission (STSM). We thank Dr. Pau Javier-Montero
(COMAV) and Dr. Javier Forment Millet (IBMCP) for their kind bioinformatics
support, Nicole Krohn and Beatrice Encke (MPIMP) for their technical support in
sugar and malic acid analyses, and Prof. Mark Stitt for helpful discussions.
Genotyping was supported by SAFQIM project, AGL2012-40130-C02-02 from
the Spanish Ministry of Economy and Competitivity (MINECO). Metabolite
analysis at the MPIMP was supported by the German Federal Ministry of
Education and Research (FP6 ERA-NET Plant Genomics project MELRIP; BMBF
contract 0313987 to Mark Stitt).
Author details
1
Research and Innovation Center, Department Genomics and Biology of Fruit
Crops, Fondazione Edmund Mach (FEM), Via E. Mach 1, 38010 San Michele,
Italy. 2Institute for the Conservation and Breeding of Agricultural Biodiversity
(COMAV-UPV), Universitat Politècnica de Valencia, Camino de Vera s/n, 46022
Valencia, Spain. 3Max-Planck-Institute of Molecular Plant Physiology,
Wissenschaftspark Golm, Am Mühlenberg 1, 14476 Potsdam, Germany. 4Plant
Systems Biology Research Laboratory, Department of Botany and Plant
Science, Plant and AgriBiosciences Research Centre, National University of
Leida et al. BMC Genetics (2015) 16:28
Galway, University Road, Galway, Ireland. 5HMCLAUSE (Business Unit of
Limagrain), Station de Mas Saint Pierre, La Galine, 13210
Saint-Rémy-de-Provence, France. 6Instituto de Biología Molecular y Celular de
Plantas (IBMCP), Universitat Politècnica de València (UPV)-Consejo Superior
de Investigaciones Científicas (CSIC), Ciudad Politécnica de la Innovación
(CPI), Ed. 8E, C/Ingeniero Fausto Elio s/n, 46022 Valencia, Spain.
Received: 5 December 2014 Accepted: 18 February 2015
References
1. Sebastian P, Schaefer H, Telford IRH, Renner SS. Cucumber (Cucumis sativus)
and melon (C. melo) have numerous wild relatives in Asia and Australia, and
the sister species of melon is from Australia. Proc Natl Acad Sci U S A.
2010;107:14269–73.
2. Jeffrey C. A review of the Cucurbitaceae. Bot J Linn Soc. 1980;81:233–47.
3. Pitrat M. Melon (Cucumis melo L.). In: Prohens J, Nuez F, editors. Handb Crop
breeding, vol I Veg. New York, USA: Springer; 2008. p. 283–315.
4. Esteras C, Formisano G, Roig C, Díaz A, Blanca J, Garcia-Mas J, et al. SNP
genotyping in melons: genetic variation, population structure, and linkage
disequilibrium. Theor Appl Genet. 2013;126:1285–303.
5. Dhillon NPS, Ranjana R, Singh K, Eduardo I, Monforte AJ, Pitrat M, et al.
Diversity among landraces of Indian snapmelon (Cucumis melo var.
momordica). Genet Resour Crop Evol. 2006;54:1267–83.
6. Dhillon NPS, Singh J, Fergany M, Monforte AJ, Sureja AK. Phenotypic and
molecular diversity among landraces of snapmelon (Cucumis melo var.
momordica) adapted to the hot and humid tropics of eastern India.
Plant Genet Resour. 2009;7:291–300.
7. Mavlyanova R, Rustamov A, Khakimov R, Khakimov A, Turdieva M, Padulosi
S. O'zbekiston Qovunlari [Melons of Uzbekistan]. IPGRI: Rome; 2005.
8. Stepansky A, Kovalski I. Intraspecific classifcation of melons (Cucumis melo L
.) in view of their phenotypic and molecular variation. Plant Syst Evol.
2000;217:313–32.
9. Burger Y, Sa’ar U, Paris HS, Lewinsohn E, Katzir N, Tadmor Y, et al. Genetic
variability for valuable fruit quality traits in Cucumis melo. Isr J Plant Sci.
2006;54:233–42.
10. Fernández-Trujillo JP, Picó B, Garcia-Mas J, Álvarez JM, Monforte AJ,
Fernandez-Trujillo JP, et al. Breeding for fruit quality in melon. In: Jenks M-A,
Bebeli PJ, editors. Breed fruit Qual. Winley-Bla. Hoboken, NJ, USA: John Wiley
& Sons, Inc; 2011. p. 261–78.
11. Diaz A, Fergany M, Formisano G, Ziarsolo P, Blanca J, Fei Z, et al. A
consensus linkage map for molecular markers and Quantitative Trait Loci
associated with economically important traits in melon (Cucumis melo L.).
BMC Plant Biol. 2011;11:111–51.
12. Dai N, Cohen S, Portnoy V, Tzuri G, Harel-Beja R, Pompan-Lotan M, et al.
Metabolism of soluble sugars in developing melon fruit: a global
transcriptional view of the metabolic transition to sucrose accumulation.
Plant Mol Biol. 2011;76:1–18.
13. Ariizumi T, Higuchi K, Arakaki S, Sano T, Asamizu E, Ezura H. Genetic suppression
analysis in novel vacuolar processing enzymes reveals their roles in controlling
sugar accumulation in tomato fruits. J Exp Bot. 2011;62(8):2773–86.
14. Moreno E, Obando JM, Dos-Santos N, Fernandez-Trujillo JP, Monforte AJ,
Garcia-Mas J, et al. Candidate genes and {QTLs} for fruit ripening and
softening in melon. Theor Appl Genet. 2008;116:589–602.
15. Deleu W, Esteras C, Roig C, González-To M, Fernández-Silva I, Gonzalez-Ibeas
D, et al. A set of EST-SNPs for map saturation and cultivar identification in
melon. BMC Plant Biol. 2009;9:90–9.
16. Harel-Beja R, Tzuri G, Portnoy V, Lotan-Pompan M, Lev S, Cohen S, et al. A
genetic map of melon highly enriched with fruit quality QTLs and EST
markers, including sugar and carotenoid metabolism genes. Theor Appl
Genet. 2010;121:511–33.
17. Perin C, Gomez-jimenez M, Hagen L, Dogimont C, Pech J, Pitrat M, et al.
Molecular and Genetic Characterization of a Non- Climacteric Phenotype in
Melon Reveals Two Loci Conferring Altered Ethylene Response in Fruit 1.
Plant Physiol. 2002;129:300–9.
18. Obando-Ulloa JM, Moreno E, García-Mas J, Nicolai B, Lammertyn J, Monforte
AJ, et al. Climacteric or non-climacteric behavior in melon fruit: 1. Aroma
volatiles. Postharvest Biol Technol. 2008;49:27–37.
19. Zheng XY, Wolff DW. Ethylene production, shelf-life and evidence of RFLP
polymorphisms linked to ethylene genes in melon (Cucumis melo L.). TAG
Theor Appl Genet. 2000;101:613–24.
Page 16 of 17
20. Eduardo I, Arus P, Monforte AJ, Obando J, Fernandez-Trujillo JP,
Martinez JA, et al. Estimating the genetic architecture of fruit quality traits in
melon using a genomic library of near isogenic lines. J Am Soc Hortic Sci.
2007;132:80–9.
21. Fita A, Picó B, Monforte AJ, Nuez F. Genetics of Root System Architecture
Using Near-isogenic Lines of Melon. J Am Soc Hortic Sci. 2008;133:448–58.
22. Obando-Ulloa JM, Nicolai B, Lammertyn J, Bueso MC, Monforte AJ,
Fernández-Trujillo JP. Aroma volatiles associated with the senescence of
climacteric or non-climacteric melon fruit. Postharvest Biol Technol.
2009;52:146–55.
23. Vegas J, Garcia-Mas J, Monforte AJ. Interaction between QTLs induces an advance
in ethylene biosynthesis during melon fruit ripening. Theor Appl Genet.
2013;126:1531–44.
24. Pech JC, Bouzayen M, Latche A. Climacteric fruit ripening: Ethylene-dependent
and independent regulation of ripening pathways in melon fruit. Plant Sci.
2008;175:114–20.
25. Chervin C, El-Kereamy A, Roustan J-P, Latché A, Lamon J, Bouzayen M. Ethylene
seems required for the berry development and ripening in grape, a
non-climacteric fruit. Plant Sci. 2004;167:1301–5.
26. Trainotti L, Pavanello A, Casadoro G, Colombo VG, Padova I. Different ethylene
receptors show an increased expression during the ripening of strawberries:
does such an increment imply a role for ethylene in the ripening of these
non-climacteric fruits? J Exp Bot. 2005;56:2037–46.
27. Gao F, Hao J, Yao Y, Wang X, Hasi A. Cloning and characterization of
ethylene-insensitive 2 (EIN2) gene from Cucumis melo. Russian J Plant
Physio. 2013;60:713–9.
28. Kendrick MD, Chang C. Ethylene signaling: new levels of complexity and
regulation. Curr Opin Plant Biol. 2008;11:479–85.
29. Eriksson EM, Bovy A, Manning K, Harrison L, Andrews J, De Silva J, et al.
Effect of the Colorless non-ripening mutation on cell wall biochemistry and
gene expression during tomato fruit development and ripening.
Plant Physiol. 2004;136:4184–97.
30. Giovannoni JJ. Fruit ripening mutants yield insights into ripening control.
Curr Opin Plant Biol. 2007;10:283–9.
31. Manning K, Tor M, Poole M, Hong Y, Thompson AJ, King GJ, et al. A
naturally occurring epigenetic mutation in a gene encoding an SBP-box
transcription factor inhibits tomato fruit ripening. Nat Genet. 2006;38:948–52.
32. Lin Z, Hong Y, Yin M, Li C, Zhang K, Grierson D. A tomato HD-Zip homeobox
protein, LeHB-1, plays an important role in floral organogenesis and ripening.
Plant J. 2008;55:301–10.
33. Yoshida H, Nagata M, Saito K, Wang KLC, Ecker JR. Arabidopsis ETO1
specifically interacts with and negatively regulates type 2 1aminocyclopropane-1-carboxylate synthases. BMC Plant Biol. 2005;5:14.
34. Lincoln JE, Cordes S, Read E, Fischer RL. Regulation of gene expression by
ethylene during Lycopersicon esculentum (tomato ) fruit development.
Proc Natl Acad Sci. 1987;84:2793–7.
35. Deikman J, Xu R, Kneissl ML, Ciardi JA, Kim KN, Pelah D. Separation of cis
elements responsive to ethylene, fruit development, and ripening in the
5’-flanking region of the ripening-related E8 gene. Plant Mol Biol. 1998;37:1001–11.
36. Klee HJ, Giovannoni JJ. Genetics and control of tomato fruit ripening and
quality attributes. Annu Rev Genet. 2011;45:41–59.
37. Fujisawa M, Nakano T, Shima Y, Ito Y. A Large-Scale Identification of Direct
Targets of the Tomato MADS Box Transcription Factor RIPENING INHIBITOR
Reveals the Regulation of Fruit Ripening. Plant Cell. 2013;25:371–86.
38. Mascarell-Creus A, Cañizares J, Vilarrasa-Blasi J, Mora-García S, Blanca J,
Gonzalez-Ibeas D, et al. An oligo-based microarray offers novel transcriptomic
approaches for the analysis of pathogen resistance and fruit quality traits in
melon (Cucumis melo L.). BMC Genomics. 2009;10:467.
39. Esteras C, Lunn J, Sulpice R, Blanca J, Garcia-Mas J, Pitrat M et al.
Phenotyping a highly diverse core melon collection to be screened
using Ecotilling. Plant Genomics Eur Meet (Plant Gem), Lisbon (Portugal),
7–10 Oct 2009 2009:214.
40. González M, Xu M, Esteras C, Roig C, Monforte AJ, Troadec C, et al.
Towards a TILLING platform for functional genomics in Piel de Sapo
melons. BMC Res Notes. 2011;4:289.
41. Eduardo I, Arús P, Monforte AJ. Development of a genomic library of near
isogenic lines (NILs) in melon (Cucumis melo L.) from the exotic accession
PI161375. Theor Appl Genet. 2005;112:139–48.
42. Gonzalo MJ, Claveria E, Monforte AJ, Dolcet-sanjuan R. Parthenogenic
Haploids in Melon : Generation and Molecular Characterization of a
Doubled Haploid Line Population. J Amer Soc Hort Sci. 2011;136:145–54.
Leida et al. BMC Genetics (2015) 16:28
43. Blanca J, Cañizares J, Ziarsolo P, Esteras C, Mir G, Nuez F, et al. Melon
transcriptome characterization: Simple sequence repeats and Single
nucleotide polymorphisms discovery for high throughput genotyping
across the species. The Plant Genome. 2011;4(2):118–31.
44. Blanca J, Esteras C, Ziarsolo P, Pérez D, Fernandez-Pedrosa V, Collado C,
et al. Transcriptome sequencing for SNP discovery across Cucumis melo.
BMC Genomics. 2012;13:280.
45. Garcia-Mas J, Benjak A, Sanseverino W, Bourgeois M, Mir G, González VM,
et al. The genome of melon (Cucumis melo L.). Proc Natl Acad Sci.
2012;109:11872–7.
46. Esteras C, Nuez F, Picó B. Genetic diversity studies in Cucurbits using
molecular tools. In: Behera T, Wang Y, Kole C, editors. Genet Genomics
Breed Cucurbits. New Hampshire: CRC Press; 2012. p. 140–98.
47. Monforte AJ, Oliver M, Gonzalo MJ, Alvarez JM, Dolcet-Sanjuan R, Arús P.
Identification of quantitative trait loci involved in fruit quality traits in melon
(Cucumis melo L.). Theor Appl Genet. 2004;108:750–8.
48. Evanno G, Regnaut S, Goudet J. Detecting the number of clusters of
individuals using the software STRUCTURE: a simulation study. Mol Ecol.
2005;14:2611–20.
49. Provvidenti R. A Source of a High Level of Tolerance to Squash Mosaic Virus
in a Melon from China. Cucurbit Genet Coop Rep. 1998;21:29–30.
50. Yu X, Wang X, Zhang W, Qian T, Tang G, Guo Y, et al. Antisense suppression
of an acid invertase gene (MAI1) in muskmelon alters plant growth and fruit
development. J Exp Bot. 2008;59:2969–77.
51. Yoo S-D, Cho Y, Sheen J. Emerging connections in the ethylene signaling
network. Trends Plant Sci. 2009;14:270–9.
52. Cara B, Giovannoni JJ. Molecular biology of ethylene during tomato fruit
development and maturation. Plant Sci. 2008;175:106–13.
53. Devoto A, Hartmann H, Piffanelli P, Elliott C, Simmons C, Taramino G, et al.
Molecular phylogeny and evolution of the plant-specific seven-transmembrane
MLO family. J Mol Evol. 2003;56:77–88.
54. Clayberg CD. Interaction and linkage tests of flesh color genes in Cucumis
melo L. Cucurbit Genet Coop Rep. 1992;15:53.
55. Dhillon N, Monforte A, Pitrat M, Pandey S, Singht P, Reitsma KR, et al. Melon
landraces of India: contributions and importance. Plant Breed Rev.
2012;35:85–150.
56. Tomason Y, Nimmakayala P, Levi A, Reddy UK. Map-based molecular diversity,
linkage disequilibrium and association mapping of fruit traits in melon.
Mol Breed. 2013;31:829–41.
57. Esteras C, Pascual L, Saladie M, Dogimont C, Garcia-Mas J, Nuez F et al. Use
of Ecotilling to identify natural allelic variants of melon candidate genes
involved in fruit ripening. In Plant Genomics Eur Meet (Plant Gem), Lisboa
(Portugal), PLANT GEM 7-10 Oct 2009; 2009:213.
58. Lasserre E, Bouquin T, Hernandez JA, Bull J, Pech JC, Balagué C. Structure
and expression of three genes encoding ACC oxidase homologs from
melon (Cucumis melo L.). Mol Gen Genet. 1996;251:81–90.
59. Chervin C, Deluc L. Ethylene signalling receptors and transcription factors
over the grape berry development: gene expression profiling. Vitis.
2010;49:129–36.
60. Kieber JJ, Rothenberg M, Roman G, Feldmann KA, Ecker JR. CTR1, a negative
regulator of the ethylene response pathway in Arabidopsis, encodes a
member of the raf family of protein kinases. Cell. 1993;72:427–41.
61. Wang A, Tan D, Takahashi A, Li TZ, Harada T. MdERFs, two ethyleneresponse factors involved in apple fruit ripening. J Exp Bot. 2007;58:3743–8.
62. Bassett C, Artlip T, Nelson M. Characterization of an ETR homologue from
peach (Prunus persica). Plant Biol 1999.
63. Barry CS, Mcquinn RP, Thompson AJ, Seymour GB, Grierson D, Giovannoni JJ, et al.
Ethylene Insensitivity Conferred by the Green-ripe and Never-ripe 2 Ripening
Mutants of Tomato 1. Plant Physiol. 2005;138:267–75.
64. Giovannoni JJ. Genetic Regulation of Fruit Development and Ripening.
Plant Cell. 2004;16:170–81.
65. Lanahan MB. The Never Ripe Mutation Blocks Ethylene Perception in
Tomato. Plant Cell. 1994;6:521–30.
66. Wilkinson J, Lanahan M, Yen H, Giovannoni J, Klee H. An ethylene-inducible
component of signal transduction encoded by NEVER-RIPE. Science.
1995;270:1807–9.
67. Yang YW, Wu Y, Pirrello J, Regad F, Bouzayen M, Deng W, et al. Silencing Sl-EBF1
and Sl EBF2 expression causes constitutive ethylene response phenotype, accelerate
plant senescence and fruit ripening in tomato. J Exp Bot. 2010;61:697–708.
Page 17 of 17
68. Vrebalov J, Ruezinsky D, Padmanabhan V, White R, Medrano D, Drake R, et al.
A MADS-box gene necessary for fruit ripening at the tomato
ripening-inhibitor (Rin) locus. Science. 2002;296:343–6.
69. Saladié M, Rose JKC, Cosgrove DJ, Catalá C. Characterization of a new
xyloglucan endotransglucosylase/hydrolase (XTH) from ripening tomato fruit
and implications for the diverse modes of enzymic action. Plant J.
2006;47:282–95.
70. Ng PC, Henikoff S. SIFT: predicting amino acid changes that affect protein
function. Nucleic Acids Res. 2003;31:3812–4.
71. Doyle JJDJ. Isolation of plant DNA from fresh tissue. Focus. 1990;12:13–15.74.
72. Stitt M, Lilley R, Gerhardt R, Heldt H. Determination of metabolite levels in
specific cells and subcellular compartments of plant leave. Methods Enzym.
1989;174:518–22.
73. Jombart T, Ahmed I. adegenet 1.3–1: new tools for the analysis of
genome-wide SNP data. Bioinformatics. 2011;27:3070–1.
74. Jombart T. adegenet: a R package for the multivariate analysis of genetic
markers. Bioinformatics. 2008;24:1403–5.
75. Pritchard JK, Stephens M, Donnelly P. Inference of population structure
using multilocus genotype data. Genetics. 2000;155:945–59.
76. Liu K, Muse SV. PowerMarker: an integrated analysis environment for
genetic marker analysis. Bioinformatics. 2005;21:2128–9.
77. Bradbury PJ, Zhang Z, Kroon DE, Casstevens TM, Ramdoss Y, Buckler ES.
TASSEL: Software for association mapping of complex traits in diverse
samples. Bioinformatics. 2007;23:2633–5.
78. Breseghello F, Sorrells ME. Association mapping of kernel size and milling
quality in wheat (Triticum aestivum L.) cultivars. Genetics. 2006;172:1165–77.
79. Peltier J: LOESS Smoothing in Excel. 2009.
Submit your next manuscript to BioMed Central
and take full advantage of:
• Convenient online submission
• Thorough peer review
• No space constraints or color figure charges
• Immediate publication on acceptance
• Inclusion in PubMed, CAS, Scopus and Google Scholar
• Research which is freely available for redistribution
Submit your manuscript at
www.biomedcentral.com/submit