polymer compositeeur 21682 en tools for composite indicator building
Bạn đang xem bản rút gọn của tài liệu. Xem và tải ngay bản đầy đủ của tài liệu tại đây (2.21 MB, 134 trang )
Institute for the Protection and Security of the Citizen
Econometrics and Statistical Support to Antifraud Unit
I-21020 Ispra (VA) Italy
Tools for Composite Indicators Building
Michela Nardo, Michaela Saisana,
Andrea Saltelli & Stefano Tarantola
2005 EUR 21682 EN
2
LEGAL NOTICE
The views expressed in this report are purely those of the authors
and may not in any circumstances be regarded
as stating an official position of the European Commission.
Neither the European Commission nor any person
acting on behalf of the Commission is responsible for
the use which might be made of the following information
A great deal of information on the
European Union is available on the Internet.
It can be accessed through the Europa server
(
).
The Report is available online at />
EUR 21682 EN
© European Communities, 2005
Reproduction is authorised provided the source is acknowledged
3
Table of Contents
FOREWORD ________________________________________________________________________ 5
IMPORTANT NOTE ___________________________________________________________________ 5
1. INTRODUCTION ___________________________________________________________________ 6
2. CONSTRUCTION OF COMPOSITE INDICATORS _____________________________________________ 7
2.1 Steps towards composite indicators ________________________________________________ 9
2.1 Requirements for quality control _________________________________________________ 14
3. MULTIVARIATE ANALYSIS __________________________________________________________ 15
3.1 Grouping Information on sub-indicators ___________________________________________ 17
3.1.1 Principal Components Analysis ______________________________________________________ 17
3.1.2 Factor Analysis ___________________________________________________________________ 21
3.1.3 Cronbach Coefficient Alpha_________________________________________________________ 26
3.2 Grouping information on countries _______________________________________________ 28
3.2.1 Cluster analysis ___________________________________________________________________ 28
3.2.2 Factorial k-means analysis __________________________________________________________ 34
3.3 Conclusions _________________________________________________________________ 34
4. IMPUTATION OF MISSING DATA ______________________________________________________ 35
4.1 Single imputation _____________________________________________________________ 36
3.1.1 Unconditional mean imputation _____________________________________________________ 37
4.1.2 Regression imputation _____________________________________________________________ 38
4.1.3 Expected maximization imputation___________________________________________________ 38
4.2 Multiple imputation ___________________________________________________________ 40
5. NORMALISATION OF DATA __________________________________________________________ 44
5.1 Scale transformations __________________________________________________________ 44
5.2 Normalisation methods_________________________________________________________ 46
5.2.1 Ranking of indicators across countries ________________________________________________ 46
5.2.2 Standardisation (or z-scores) ________________________________________________________ 47
5.2.3 Re-scaling ________________________________________________________________________ 47
5.2.4 Distance to a reference country ______________________________________________________ 48
5.2.5 Categorical scales _________________________________________________________________ 49
5.2.6 Indicators above or below the mean __________________________________________________ 50
5.2.7 Methods for Cyclical Indicators______________________________________________________ 51
5.2.8 Percentage of annual differences over consecutive years _________________________________ 51
6. WEIGHTING AND AGGREGATION_____________________________________________________ 54
6.1 Weighting ___________________________________________________________________ 54
Weights based on statistical models _______________________________________________________ 55
6.1.1 Principal component analysis and factor analysis _______________________________________ 56
6.1.2 Data envelopment analysis and Benefit of the doubt _____________________________________ 59
Benefit of the doubt approach____________________________________________________________ 60
6.1.3 Regression approach_______________________________________________________________ 63
6.1.4 Unobserved components models _____________________________________________________ 64
6.1.5 Budget allocation__________________________________________________________________ 66
6.1.6 Public opinion ____________________________________________________________________ 67
6.1.7 Benchmarking with “distance to the target” ___________________________________________ 68
6.1.8 Analytic Hierarchy Process _________________________________________________________ 68
6.1.9 Conjoint analysis __________________________________________________________________ 71
6.1.10 Performance of the different weighting methods_______________________________________ 72
6.2 Aggregation techniques ________________________________________________________ 74
6.2.1 Additive methods__________________________________________________________________ 74
6.2.2 Preference independence ___________________________________________________________ 75
6.2.3 Weights and aggregations: lessons from multi-criteria analysis ___________________________ 76
6.2.4 Geometric aggregation _____________________________________________________________ 79
6.3 Conclusions: when to use what?__________________________________________________ 81
7. UNCERTAINTY AND SENSITIVITY ANALYSIS _____________________________________________ 85
7.1 Set up of the analysis __________________________________________________________ 87
7.1.1 Output variables of interest _________________________________________________________ 87
7.1.2 General framework for the analysis __________________________________________________ 88
4
7.1.3 Inclusion – exclusion of individual sub- indicators ______________________________________ 88
7.1.4 Data quality ______________________________________________________________________ 88
7.1.5 Normalisation ____________________________________________________________________ 88
7.1.6 Uncertainty analysis _______________________________________________________________ 89
7.1.7 Sensitivity analysis using variance-based techniques ____________________________________ 91
7.2 Results _____________________________________________________________________ 94
7.2.1 First analysis _____________________________________________________________________ 94
7.2.2 Second analysis ___________________________________________________________________ 99
7.3 Conclusions ________________________________________________________________ 100
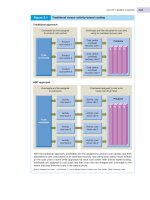
8. VISUALISATION _________________________________________________________________ 102
8.1 Tabular format ______________________________________________________________ 103
8.2 Bar charts __________________________________________________________________ 104
8.3 Line charts _________________________________________________________________ 105
8.4 Traffic lights to monitor progress________________________________________________ 108
8.5 Rankings ___________________________________________________________________ 109
8.6 Scores and rankings __________________________________________________________ 109
8.7 Dashboards_________________________________________________________________ 111
8.8 Nation Master _______________________________________________________________ 114
8.9 Comparing indicators using clusters of countries ___________________________________ 117
9. CONCLUSIONS __________________________________________________________________ 119
REFERENCES AND BIBLIOGRAPHY ________________________________________________ 122
APPENDIX______________________________________________________________________ 129
5
Foreword
Our society is changing so fast we need to know as soon as possible when things go wrong
(Euroabstracts, 2003). This is where composite indicators enter into the discussion. A composite
indicator is an aggregated index comprising individual indicators and weights that commonly
represent the relative importance of each indicator. However, the construction of a composite
indicator is not straightforward and the methodological challenges raise a series of technical
issues that, if not addressed adequately, can lead to composite indicators being misinterpreted or
manipulated. Therefore, careful attention needs to be given to their construction and subsequent
use.
This document reviews the steps involved in a composite indicator’s construction process and
discusses the common pitfalls to be avoided. We stress the need for multivariate analysis prior to
the aggregation of the individual indicators. We deal with the problem of missing data and with
the techniques used to bring into a common unit the indicators that are of very different nature.
We explore different methodologies for weighting and aggregating indicators into a composite
and test the robustness of the composite using uncertainty and sensitivity analysis. Finally we
show how the same information that is communicated by the composite indicator can be
presented in very different ways and how this can influence the policy message.
Important note
The material presented here will eventually feed in a joint OECD-JRC Handbook of composite
indicators building, expected to appear in fall 2005.
6
1. Introduction
Composite indicators are increasingly recognized as a useful tool for policy making and public
communications in conveying information on countries’ performance in fields such as
environment, economy, society, or technological development. Composite indicators are much
easier to interpret than trying to find a common trend in many separate indicators. Composite
indicators have proven to be useful in ranking countries in benchmarking exercises. However,
composite indicators can send misleading or non-robust policy messages if they are poorly
constructed or misinterpreted. Andrew Sharpe (2004) notes:
“The aggregators believe there are two major reasons that there is value in combining indicators
in some manner to produce a bottom line. They believe that such a summary statistic can indeed
capture reality and is meaningful, and that stressing the bottom line is extremely useful in
garnering media interest and hence the attention of policy makers. The second school, the non-
aggregators, believe one should stop once an appropriate set of indicators has been created and
not go the further step of producing a composite index. Their key objection to aggregation is what
they see as the arbitrary nature of the weighting process by which the variables are combined.”
In Saisana et al. (2005) one reads:
“[…] it is hard to imagine that debate on the use of composite indicators will ever be settled […]
official statisticians may tend to resent composite indicators, whereby a lot of work in data
collection and editing is “wasted” or “hidden” behind a single number of dubious significance.
On the other hand, the temptation of stakeholders and practitioners to summarise complex and
sometime elusive processes (e.g. sustainability, single market policy, etc.) into a single figure to
benchmark country performance for policy consumption seems likewise irresistible.”
Synthetically the main pros and cons of using composite indicators could be summarized as
follows:
Pros of composite indicators
+ Summarise complex or multi-dimensional issues, in view of supporting decision-makers.
+ Are easier to interpret than trying to find a trend in many separate indicators.
+ Facilitate the task of ranking countries on complex issues in a benchmarking exercise.
+ Assess progress of countries over time on complex issues.
+ Reduce the size of a set of indicators or include more information within the existing size limit.
+ Place issues of countries performance and progress at the centre of the policy arena.
+ Facilitate communication with ordinary citizens and promote accountability.
Cons of composite indicators
- May send misleading policy messages, if they are poorly constructed or misinterpreted.
- May invite drawing simplistic policy conclusions, if not used in combination with the indicators.
- May lend themselves to instrumental use (e.g be built to support the desired policy), if the
various stages (e.g. selection of indicators, choice of model, weights) are not transparent and
based on sound statistical or conceptual principles.
- The selection of indicators and weights could be the target of political challenge.
- May disguise serious failings in some dimensions of the phenomenon, and thus increase the
difficulty in identifying the proper remedial action.
- May lead wrong policies, if dimensions of performance that are difficult to measure are ignored.
7
A composite indicator is the mathematical combination of individual indicators that represent
different dimensions of a concept whose description is the objective of the analysis (see Saisana
and Tarantola, 2002). The construction of composite indicators involves stages where subjective
judgement has to be made: the selection of indicators, the treatment of missing values, the choice
of aggregation model, the weights of the indicators, etc. These subjective choices can be used to
manipulate the results. It is, thus, important to identify the sources of subjective or imprecise
assessment and use uncertainty and sensitivity analysis to gain useful insights during the process
of composite indicators building, including a contribution to the indicators’ quality definition and
an appraisal of the reliability of countries’ ranking.
We would point that composite indicators should never be seen as a goal per se. They should be
seen, instead, as a starting point for initiating discussion and attracting public interest and
concern. The aim of the present document is to provide guidance on how to ascertain that the
process leading to the construction of a composite indicator meets certain quality objectives. The
structure of this document is as follows: Section 2 describes the main issues related with the
construction of composite indicators, which are then treated in detail in the following sections.
Sections 3 to 5 deal with the statistical treatment of the set of indicators: multivariate analysis,
imputation of missing data and normalization techniques aim at supplying a sound and defensible
dataset. Section 6 gives the developers and users of composite indicators an introduction to the
main weighting and aggregation procedures. Section 7 explores the merits of applying uncertainty
and sensitivity analysis to increase transparency and make policy inference more defensible.
Section 8 shows how different visualization strategies of the same composite indicator can
convey different policy messages. The Technology Achievement Index (TAI), a composite
indicator developed by the United Nations (Human Development Report, UN 2001), has been
chosen as example to elucidate the various steps in the construction of a composite indicator and
guide the reader into the different problems that may arise (a detailed description of the
composite indicator is given in the Appendix).
2. Construction of composite indicators
The composite indicators’ controversy can perhaps be put into context if one considers that
indicators, and a fortiori composite indicators, are models, in the mathematical sense of the term.
Models are inspired from systems (natural, biological, social) that one wishes to understand.
Models are themselves systems, formal system at that. The biologist Robert Rosen (1991, Figure
2.1) noted that while a causality entailment structure defines the natural system, and a formal
causality system entails the formal system, no rule of encoding the formal system given the real
system, i.e. to move from perceived reality to model, was ever agreed.
8
Figure 2.1, From Rosen 1991.
The formalization of the system generates an image, the theoretical framework, that is valid
only within a given information space. As result, the model of the system will reflect not only
(some of) the characteristics of the real system but also the choices made by the scientists on how
to observe the reality. When building a model to describe a real-world phenomenon, formal
coherence is a necessary property, yet not sufficient. The model in fact should fit objectives and
intentions of the user, i.e. it must be the most appropriate tool for expressing the set of objectives
that motivated the whole exercise. The choice of which sub-indicators to use, how those are
divided into classes, whether a normalization method has to be used (and which one), the choice
of the weighting method, and how information is aggregated, all these features stem from a
certain perspective on the issue to be modelled. Reflexivity is thus an essential feature of a model
since “the observer and the observation are not separated […] the way human kind approaches
the problem is part of the problem itself.” (Gough at al. 1998).
No matter how subjective and imprecise the theoretical framework is, it implies the recognition of
the multidimensional nature of the phenomenon to be measured and the effort of specifying the
single aspects and their interrelation. Most of the issues described with a composite indicator are
complex problems, think to concepts like welfare, quality of education, or sustainability.
Complexity is reflected by the multi-dimensionality and multi-scale representation of the issue.
The European Commission, for example, recognises the multi-dimensionality in the definition of
sustainability claming that the social, environmental and economic dimensions must be dealt with
together (European Commission, ‘A Sustainable Europe for a Better World: a European Union
Strategy for Sustainable Development’ COM(2001)264 final of 15.05.2001). Defining
sustainability within a multi-dimensional framework entails merging multidisciplinary point of
views, all equally legitimate opinions of what is sustainability and how should be measured.
Then, for each discipline, e.g. economics, sustainability can be measured at different
(hierarchical) levels like economic agents, households, economic sectors, nations, European
Union, or the entire planet. Synergies and conflicts, that would appear when sustainability is
measured on a national or on a wider scale (think to policies related to the climate change), are
likely to disappear at the local level where other aspects prevail. The change in scale might also
produce contradictory implications and remedies all equally justifiable (e.g. windmills are
desirable sources of clean energy at a national level but might produce social disputes in the local
communities where windmills have to be placed).
9
Giampietro et al. (2004) notice that in complex issues the ‘quality’ of the theoretical framework
depends on “ three crucial challenges for the scientific community”:
1. check the feasibility of the effect of the proposed [framework] in relation to different
dimensions (technical, economic, social, political, cultural) and different scales: local
(e.g. technical coefficients), medium (e.g. aggregate characteristics of large units) and
large scales (e.g. trend analysis and benchmarks to compare trajectories of
development)…. (italics added)
2. address several legitimate (and often contrasting) perspectives found among stakeholders
on how to structure the problem….
3. handle in a credible way the unavoidable degree of uncertainty, or even worst, genuine
ignorance associated to any multi-scale, multi-dimensional analysis of complex adaptive
systems.”
If we accept a definition of the theoretical framework requiring the integration of a broad set of
(probably conflicting) points of view and the use of non-equivalent representative tools then the
problem becomes to reduce the complexity in a measurable form. In other terms non-measurable
issues like sustainability need to be replaced by intermediate objectives whose achievement can
be observed and measured. The reduction into parts has limits when crucial properties of the
entire system are lost: often the individual pieces of a puzzle hide the whole picture.
As suggested by Box (1979): ‘all models are wrong, some are useful’. The quality of a
composite indicator is thus in its fitness or function to purpose. This is recognised by A. K. Sen
(1989), Nobel prize winner in 1998, who was initially opposed to composite indicators but was
eventually seduced by their ability to put into practice his concept of ‘Capabilities’ (the range of
things that a person could do and be in her life) in the UN Human Development Index
1
.
Although we cannot tackle here the vast issue of quality of statistical information, there is one
aspect of the quality of composite indicators which we find essential for their use. This is the
existence of a community of peers (be these individuals, regions, countries, facilities of various
nature) willing to accept the composite indicators as their common yardstick based on their
understanding of the issue. In discussing pedigree matrices for statistical information (see Section
2.2) Funtowicz and Ravetz note (in Uncertainty and Quality in Science for Policy, 1990)
“[…] any competent statistician knows that "just collecting numbers" leads to nonsense. The
whole Pedigree matrix is conditioned by the principle that statistical work is (unlike some
traditional lab research) a highly articulated social activity. So in "Definition and Standards" we
put "negotiation" as superior to "science", since those on the job will know special features and
problems of which an expert with only a general training might miss”.
We would add that, however good the scientific basis for a given composite indicator, its
acceptance relies on negotiation.
2.1 Steps towards composite indicators
As first step towards the construction of a composite indicator, one should look at the indicators
as an entity, with a view to investigate its structure. Multivariate statistic is a powerful tool to
1
This Index is defined as a measure of the process of expanding people’s capabilities (or choices)
to function. In this case, composite indicators’ use for advocacy is what makes them valuable.
10
achieve this objective. This type of analysis is, thereafter, of exploratory nature and is helpful in
assessing the suitability of the dataset and providing an understanding of the implications of the
methodological choices (e.g. weighting, aggregation) during the construction phase of the
composite indicator. In the analysis, the statistical information inherent in the indicators’ set can
be dealt with grouping information along the two dimensions of the dataset, i.e. along indicators
and along constituencies (e.g. countries, regions, sectors, etc.), not independently of each other.
Factor Analysis and Reliability/Item Analysis (e.g. Coefficient Cronbach Alpha) can be used to
group the information on the indicators. The aim is to explore whether the different dimensions of
the phenomenon are well balanced -from a statistical viewpoint- in the composite indicator. The
higher the correlation between the indicators, the fewer statistical dimensions will be present in
the dataset. However, if the statistical dimensions do not coincide with the theoretical dimensions
of the dataset, then a revision of the set of the sub-indicators might be considered. Saisana et al.
(2005) phrase that, depending on a school of thought, one may see a high correlation among
indicators as something to correct for, e.g by making the weight for a given indicator inversely
proportional to the arithmetic mean of the coefficients of determination for each bivariate
correlation that includes the given indicator. On the other hand, practitioners of multi-criteria
decision analysis would tend to consider the existence of correlations as a feature of the problem,
not to be corrected for, as correlated indicators may indeed reflect non-compensable different
aspects of the problem.
Cluster Analysis can be applied to group the information on constituencies (e.g. countries) in
terms of their similarity with respect to the different sub-indicators. This type of analysis can
serve multiple purposes, and it can be seen as:
(a) a purely statistical method of aggregation of the indicators,
(b) a diagnostic tool for assessing the impact of the methodological choices made during the
construction phase of the composite indicator,
(c) a method of disseminating the information on the composite indicator, without losing the
information on the dimensions of the indicators,
(d) a method for selecting groups of countries to impute missing data with a view to decrease
the variance of the imputed values.
Clearly the ability of a composite to represent multidimensional concepts largely depends on the
quality and accuracy of its components. Missing data are present in almost all composite
indicators, and they can be missing either in a random or in a non-random fashion. However,
there is often no basis upon which to judge whether data are missing at random or systematically,
whilst most of the methods of imputation require a missing at random mechanism. When there
are reasons to assume a non-random missing pattern, then this pattern must be explicitly modelled
and included in the analysis. This could be very difficult and could imply ad hoc assumptions that
are likely to deeply influence the result of the entire exercise.
Three generic approaches for dealing with missing data can be distinguished, i.e. case deletion,
single imputation or multiple imputation. When an indicator is missing for a country, case
deletion either removes the country from the analysis or the indicator from the analysis. The main
disadvantage of case deletion is that it ignores possible systematic differences between complete
and incomplete sample and may produce biased estimates if removed records are not a random
sub-sample of the original sample. Furthermore, standard errors will, in general be larger in a
reduced sample given that less information is used. The other two approaches see the missing
data as part of the analysis and therefore try to impute values through either Single Imputation
(e.g. Mean/Median/Mode substitution, Regression Imputation, Expectation-Maximisation
11
Imputation, etc.) or Multiple Imputation (e.g. Markov Chain Monte Carlo algorithm). The
advantages of imputation include the minimisation of bias and the use of ‘expensive to collect’
data that would otherwise be discarded. In the words of Dempster and Rubin (1983): “The idea of
imputation is both seductive and dangerous. It is seductive because it can lull the user into the
pleasurable state of believing that the data are complete after all, and it is dangerous because it
lumps together situations where the problem is sufficiently minor that it can legitimately handled
in this way and situations where standard estimators applied to real and imputed data have
substantial bias.”
Whenever indicators in a dataset are incommensurate with each other, and/or have different
measurement units, it is necessary to bring these indicators to the same unit, to avoid adding up
apples and pears. Normalization serves primarily this purpose. There are a number of
normalization methods available, such as ranking, standardization, re-scaling, distance to
reference country, categorical scales, cyclical indicators, balance of opinions. The selection of a
suitable normalization method to apply to the problem at hand is not trivial and deserves special
care. The normalization method should take into account the data properties and the objectives of
the composite indicator. The issues that could guide the selection of the normalization method
include: whether hard or soft data are available, whether exceptional behaviour needs to be
rewarded/penalised, whether information on absolute levels matters, whether benchmarking
against a reference country is requested, whether the variance in the indicators needs to be
accounted for. For example, in the presence of extreme values, normalisation methods that are
based on standard deviation or distance from the mean are preferred. Special care to the type of
the normalisation method used needs to be given if the composite indicator values per country
need to be comparable over time.
There is one further aspect which the normalization method may interfere with. This is the scale
effect, i.e. the different measurement units in which an indicator can be expressed. Ebert and
Welsch (2004) mention that particular attention needs to be placed if the raw data are expressed
in different scales either interval scale (e.g. temperature in Celsius or Fahrenheit) or ratio scale
(e.g. kilograms or pounds). In that case, a proper normalisation method should be applied to
remove the scale effect from all indicators simultaneously. If for example, some indicators in the
dataset are expressed on interval scale, whilst others on a ratio scale, then dividing by a reference
value does not remove the scale effect from those indicators expressed on interval scale.
However, the standardisation method does so.
Two types of transformations that are sometimes applied to the raw data prior to normalisation
are truncation and functional form. The choice of trimming the tails of the indicators’
distributions is supported by the need to avoid having extreme values overly dominate the result
and, partially, to correct for data quality problems in such extreme cases. The functional
transformation is applied to the raw data to represent the significance of marginal changes in its
level. In most cases, the linear functional form is used on all of the variables, de facto. This
approach is suitable if changes in the indicator’s values are important in the same way, regardless
of the level. If changes are more significant at lower levels of the indicator, the functional form
should be concave down (e.g. log or the nth root). If changes are more important at higher levels
of the indicator, the functional form should be concave up (e.g. exponential or power).
Central to the construction of a composite index is the need to combine in a meaningful way the
different dimensions, which implies a decision on the weighting model and the aggregation
procedure. Different weights may be assigned to indicators to reflect their economic significance
(collection costs, coverage, reliability and economic reason), statistical adequacy, cyclical
conformity, speed of available data, etc. Several weighting techniques are available, such as
12
weighting schemes based on statistical models (e.g. factor analysis, data envelopment analysis,
unobserved components models), or on participatory methods (e.g. budget allocation, analytic
hierarchy processes). For example, weights would be determined based on correlation
coefficients or principal components analysis to overcome the “statistical” double counting
problem when two or more indicators partially measure the same behaviour. Weights may also
reflect the statistical quality of the data, thus higher weight could be assigned to statistically
reliable data (data with low percentages of missing values, large coverage, sound values). In this
case the concern is to reward only sub-indicators easy to measure and readily available, punishing
the information that is more problematic to identify and measure. Indicators could also be
weighted based on experts’ opinion, who know policy priorities and theoretical backgrounds, to
reflect the multiplicity of stakeholders’ viewpoints. Weights usually have an important impact on
the results of the composite indicator especially whenever higher weight is assigned to indicators
on which some countries excel or fail. This is why weighting models need to be made explicit and
transparent. Moreover, one should have in mind that, no matter which method is used, weights
are essentially value judgments and have the property to make explicit the objectives underlying
the construction of a composite (Rowena et al., 2004).
The issue of aggregation of the information conveyed by the different dimensions into a
composite index comes together with the weighting. Different aggregation rules are possible.
Sub-indicators could be summed up (e.g. linear aggregation), multiplied (geometric aggregation)
or aggregated using non linear techniques (e.g. multi-criteria analysis). Each technique implies
different assumptions and has specific consequences.
Linear aggregation can be applied when all indicators have the same measurement unit and
further ambiguities related to the scale effects have been neutralized. Furthermore, linear
aggregation implies full (and constant) compensability, i.e. poor performance in some indicators
can be compensated by sufficiently high values of other indicators. Geometric aggregation is
appropriate when strictly positive indicators are expressed in different ratio-scales, and it entails
partial (non constant) compensability, i.e. compensability is lower when the composite indicator
contains indicators with low values. The absence of synergy or conflict effects among the
indicators is a necessary condition to admit either linear or geometric aggregation. Furthermore,
linear aggregations reward sub-indicators proportionally to the weights, while geometric
aggregations reward more those countries with higher scores. In both linear and geometric
aggregations weights express trade-offs between indicators: the idea is that deficits in one
dimension can be offset by surplus in another. However, when different goals are equally
legitimate and important, then a non-compensatory logic may be necessary. This is usually the
case when very different dimensions are involved in the composite, like in the case of
environmental indexes, where physical, social and economic figures must be aggregated. If the
analyst decides that an increase in economic performance can not compensate a loss in social
cohesion or a worsening in environmental sustainability, then neither the linear nor the geometric
aggregation are suitable. Instead, a non-compensatory multicriteria approach will assure non
compensability by formalizing the idea of finding a compromise between two or more legitimate
goals.
Doubts are often raised about the robustness of the results of the composite indicators and about
the significance of the associated policy message. Uncertainty analysis and sensitivity analysis
is a powerful combination of techniques to gain useful insights during the process of composite
indicators building, including a contribution to the indicators’ quality definition and an
assessment of the reliability of countries’ ranking.
13
As often noted, composite indicators may send misleading, non-robust policy messages if they
are poorly constructed or misinterpreted. The construction of composite indicators involves stages
where judgement has to be made. This introduces issues of uncertainty in the construction line of
a composite indicator: selection of data, data quality, data editing (e.g. imputation), data
normalisation, weighting scheme/weights, weights’ values and aggregation method. All these
sources of subjective judgement will affect the message brought by the composite indicator in a
way that deserves analysis and corroboration. For example, changes in weights will almost in all
cases lead to changes in rankings of countries. It is seldom that top performers becomes worse
performance due to changes in weights but a change in ranking from for example ranking 2 to
ranking 4 is not uncommon even in well-constructed composite indicators.
A combination of uncertainty and sensitivity analysis can help to gauge the robustness of the
composite indicator, to increase its transparency and to help framing a debate around it.
Uncertainty analysis (UA) focuses on how uncertainty in the input factors propagates through the
structure of the composite indicator and affects the composite indicator values. Sensitivity
analysis (SA) studies how much each individual source of uncertainty contributes to the output
variance. In the field of building composite indicators, UA is more often adopted than SA
(Jamison and Sandbu, 2001; Freudenberg, 2003) and the two types of analysis are almost always
treated separately. A synergistic use of UA and SA is proven to be more powerful (Saisana et al.,
2005; Tarantola et al., 2000).
The types of questions for which an answer is sought via the application of UA&SA are:
(a) Does the use of one construction strategy versus another in building the composite indicator
provide actually a partial picture of the countries’ performance? In other words, how do the
results of the composite indicator compare to a deterministic approach in building the composite
indicator?
(b) How much do the uncertainties affect the results of a composite indicator with respect to a
deterministic approach used in building the composite indicator?
(c) Which constituents (e.g. countries) have large uncertainty bounds in their rank (volatile
countries) and therefore, if excluded, the stability of the system would increase?
(d) Which are the factors that affect the ranks of the volatile countries?
All things considered, a careful analysis of the uncertainties included in the development of a
composite indicator can render the building of a composite indicator more robust. A plurality of
methods (all with their implications) should be initially considered, because no model
(construction path of the composite indicator) is a priori better than another, provided that internal
coherence is always assured, as each model serves different interests. The composite indicator is
no longer a magic number corresponding to crisp data treatment, weighting set or aggregation
method, but reflects uncertainty and ambiguity in a more transparent and defensible fashion. The
iterative use of uncertainty and sensitivity analysis during the development of a composite
indicator can contribute to its well-structuring, provide information on whether the countries’
ranking measures anything meaningful and could reduce the possibility that the composite
indicator may send misleading or non-robust policy messages.
The way of presenting composite indicators is not a trivial issue. Composite indicators must be
able to communicate the picture to decision-makers and users quickly and accurately. Visual
models of these composite indicators must be able to provide signals, in particular, warning
signals that flag for decision-makers those areas requiring policy intervention. The literature
presents various ways for presenting the composite indicator results, ranging from simple forms,
14
such as tables, bar or line charts, to more sophisticated figures, such as the four-quadrant model
(for sustainability), the Dashboard, etc.
If we were to stress the importance of visualising properly the composite indicators, we would
use the general remark made by Shumpeter 1933:
“…as long as we are unable to put our arguments into figures, the voice of our science, although
occasionally it may help to dispel gross errors, will never be heard by practical men.”
One final suggestion for this introductory section concerns the ‘Transparency’ of the indicator.
It would be very useful, for developers, users and practitioners in general, if composite indicators
could be made available via the web, along with the data, the weights and the documentation of
the methodology. Given that composite indicators can be decomposed or disaggregated so as to
introduce alternative data, weighting, normalisation approaches etc., the components of
composites should be available electronically as to allow users to change variables, weights, etc.
and to replicate sensitivity tests.
2.1 Requirements for quality control
As mentioned above the concept of quality of the composite indicators is not only a function of
the quality of its underlying data (in terms of relevance, accuracy, credibility, etc.) but also of the
quality of the methodological process used to build the composite indicator itself
2
. The safe use
of the composite requires proper evidence that the composite will provide reliable results. If the
user simply does not know, or is not sure about the testing and certification of the composite, then
composite’s quality is low. Up to now, tests for the quality of quantitative information have been
much undeveloped. There are statistical hypothesis tests, and elaborated formal theories of
decision-making, but none of these approaches helps with the simple question that a decision-
maker wants to ask: is this message reliable, can I use it safely?
A notational system called NUSAP (an acronym for five categories: Numeral, Unit, Spread,
Assessment, Pedigree) has been devised to characterise the quality of quantitative information
based in large part on the experience of research work in the matured natural sciences (Funtowicz
and Ravetz, 1990).
The categorical scheme on which NUSAP is based enables providers and users of composite
indicators to communicate their quality. One category of NUSAP, the pedigree, is an evaluative
description of the procedure used to build the composite indicator. The pedigree is expressed by
means of a matrix Each column of the matrix represents one phase of the construction process.
For example, the first phase of the process could be “problem definition and purpose”. A score is
assigned to each phase according to the mode the phase itself has been executed. In the example,
the phase “problem definition and purpose” could be executed in various modes: “result of
negotiation”, “purely science-based”, “based on different subjective interpretations”, “purely
abstract” or “not explored”. In very general terms, the pedigree is laid out as in Table 2.1, where
the top row has grade 4 and the bottom two rows, 0. For a numerical evaluation, average scores of
4 downwards are rated as High, Good, Medium, Low and Poor. All the scores are then elaborated
to provide an assessment of the quality of the process, which in turns suggests recursive actions
for the improvement of the process itself.
2
This chapter is based on text available on www.nusap.net
15
The whole pedigree matrix is conditioned by the principle that statistical work is a highly
articulated social activity. Thus, the pedigree matrix, with its multiplicity of categories, enables a
considerable variety of evaluative descriptions of the composite indicator to be simply scored and
coded. In practical cases, a specific pedigree matrix has to be constructed for each specific
composite indicator. An example of pedigree matrix used to characterise the quality of a set of
statistical indicators of knowledge economy can be found in Sajeva, 2004. The pedigree matrix
builds on a series of interviews made to statisticians, concerning the process they followed for the
development of the indicators (the complete text of one such interview is reported in Sajeva,
2004).
Table 2.1 The Pedigree Matrix for Statistical Information
Grade Definitions &
Standards
Data-collection &
Analysis
Institutional
Culture
Review
4 Negotiation Task-force Dialogue External
3 Science Direct Survey Accommodation Independent
2 Convenience Indirect Survey Obedience Regular
1 Symbolism Educated Guess Evasion Occasional
0 Inertia Fiat No-contact None
0 Unknown Unknown Unknown Unknown
In the following Sections we present a detailed discussion of some of the main steps in the
construction of a composite indicator.
3. Multivariate analysis
The information inherent in a dataset of sub-indicators that measure the performance of several
countries can be studied along two dimensions, i.e. along sub-indicators and along countries, not
independently of each other.
Information on sub-indicators. The analyst must first decide whether the nested structure of the
composite indicator is well defined and if the set of available sub-indicators is sufficient or
appropriate to describe the unknown phenomenon. This decision can be based both on experts’
opinion (e.g. experts in the relevant field will tell which indicators better capture the sustainability
or the quality of the education) and on the statistical structure of the dataset. Factor Analysis and
Reliability/Item Analysis can be used complementarily to explore whether the different
dimensions of the phenomenon are well balanced -from a statistical viewpoint- in the composite
indicator. If this is not true, a revision of the set of the sub-indicators might be considered. For
instance, in the e-business readiness index the human capital factor is clearly understated, whilst
the technological factor is favoured. In the same example, the distinction between “use” and
“adoption” of information and communication technologies is not supported statistically, since
Principal Components Analysis shows that some of the sub-indicators conceptually allocated to
“use” are better associated with the sub-indicators on “adoption”.
Information on countries. The use of cluster analysis to group countries in terms of similarity
between different sub-indicators can serve as:
(e) a purely statistical method of aggregation,
16
(f) a diagnostic tool for assessing the impact of the methodological choices made during the
construction phase of the composite indicator,
(g) a method of disseminating the information on the composite indicator, without losing the
information on the dimensions of the sub-indicators,
(h) a method for selecting groups of countries to impute missing data with a view to decrease
the variance of the imputed values.
Cluster Analysis could, thereafter, be useful in different sections of this document.
The notation that we will adopt throughout this document is the following.
t
c,q
x
: raw value of sub-indicator q for country c at time t, with q=1,…,Q and c=1,…,M
t
c,q
I : normalised value of sub-indicator
q,r
w : weight associated to sub-indicator q, with r=1,…,R
t
c
CI
: value of the composite indicator for country c at time t.
Note that time suffix is present only in Section 5. For reasons of clarity the time suffix has been
dropped out. When no time indication is present, the reader should consider that all variables
have the same time dimension. The rest of the notation will be introduced section by section.
17
3.1 Grouping Information on sub-indicators
3.1.1 Principal Components Analysis
The goal of the Principal Components Analysis (PCA) is to reveal how different variables change
in relation to each other, or how they are associated. This is achieved by transforming correlated
original variables into a new set of uncorrelated variables using the covariance matrix, or its
standardized form – the correlation matrix. The new variables are linear combinations of the
original ones and are sorted into descending order according to the amount of variance they
account for in the original set of variables. Usually correlations among original variables are large
enough so that the first few new variables, termed principal components account for most of the
variance in the dataset. If this holds, no essential insight is lost by further analysis or decision
making, and parsimony and clarity in the structure of the relationships are achieved. A brief
description of the PCA approach is provided in the next paragraphs. For a detailed discussion on
the PCA the reader is referred to Jolliffe (1986), Jackson (1991) and Manly (1994). Social
scientists may also find the shorter monograph by Dunteman (1989) to be helpful.
The technique of PCA was first described by Karl Pearson in 1901. A description of practical
computing methods came much later from Hotelling in 1933. The objective of the analysis is to
take
Q variables
Q21
x, x,x and find linear combinations of these to produce principal
components
Q21
Z, Z,Z that are uncorrelated, following
QQQ22Q11QQ
QQ22221212
QQ12121111
xa xaxaZ
xa xaxaZ
xa xaxaZ
+++=
+++=
+
+
+=
(3.1)
At this point there are still Q principal components, i.e. as many as there are variables. The next
step is to select the first, say P<Q principal components that preserve a “high” amount of the
cumulative variance of the original data.
The lack of correlation in the principal components is a useful property because it means that the
principal components are measuring different “statistical dimensions” in the data. When the
objective of the analysis is to present a huge data set using a few variables then in applying PCA
there is the hope that some degree of economy can be achieved if the variation in the
Q
original
x
variables can be accounted for by a small number of
Z
variables. It must be stressed that PCA
cannot always reduce a large number of original variables to a small number of transformed
variables. Indeed, if the original variables are uncorrelated then the analysis does absolutely
nothing. On the other hand, a significant reduction is obtained when the original variables are
highly correlated, positively or negatively.
The weights
ij
a
applied to the variables
j
x
in Equation (3.1) are chosen so that the principal
components
i
Z satisfy the following conditions:
(i) they are uncorrelated (orthogonal),
(ii) the first principal component accounts for the maximum possible proportion of the variance
of the set of
x
s, the second principal component accounts for the maximum of the remaining
18
variance and so on until the last of the principal component absorbs all the remaining
variance not accounted for by the preceding components, and
3
(iii)
Q, ,2,1i,1
2
iQ
2
2i
2
1i
==+++
ααα
In brief, PCA just involves finding the eigenvalues λ
j
of the sample covariance matrix CM,
=
QQ2Q1Q
Q22221
Q11211
cmcmcm
cmcmcm
cmcmcm
CM
(3.2)
where the diagonal element
ii
cm is the variance of
i
x and
ij
cm is the covariance of variables
i
x and
j
x . The eigenvalues of the matrix CM are the variances of the principal components. There
are
Q eigenvalues, some of which may be negligible. Negative eigenvalues are not possible for a
covariance matrix. An important property of the eigenvalues is that they add up to the sum of the
diagonal elements of CM. This means that the sum of the variances of the principal components
is equal to the sum of the variances of the original variables,
λ
1
+ λ
2
+ + λ
Q
= cm
11
+ cm
22
+ + cm
(3.3)
In order to avoid one variable having an undue influence on the principal components it is
common to standardize the variables
x
s to have zero means and unit variances at the start of the
analysis. The matrix CM then takes the form of the correlation matrix (Table 3.1). For the TAI
example, the highest correlation is found between the sub-indicators ELECTRICITY &
INTERNET with a coefficient of 0.84.
Table 3.1. Correlation matrix for the TAI sub-indicators, n=23. Marked correlations are
statistically significant at p < 0.05.
PATENTS
ROYALTIES
INTERNET
EXPORTS
TELEPHONES
ELECTRICITY
SCHOOLING
ENROLMENT
PATENTS
1.00 0.13 -0.09
0.45
0.28 0.03 0.22 0.08
ROYALTIES
1.00
0.46
0.25
0.56
0.32 0.30 0.06
INTERNET
1.00
-0.45 0.56 0.84 0.63
0.27
EXPORTS
1.00 0.00 -0.36 -0.35 -0.03
TELEPHONES
1.00
0.64
0.30 0.33
ELECTRICITY
1.00
0.65
0.26
SCHOOLING
1.00 0.08
ENROLMENT
1.00
3
For reasons of clarity in this section we substitute the indexing q=1,…Q with the indexing
i=1,…,Q and j=1,…,Q.
19
Table 3.2 gives the eigenvalues of the correlation matrix of the eight sub-indicators
(standardised values) that compose TAI. Note that the sum of the eigenvalues is equal to the
number of sub-indicators (
8=Q ). Figure 3.1 (left) is a graphical presentation of the eigenvalues
in descending order. Given that the correlation matrix rather than the covariance matrix is used in
the PCA, all 8 sub-indicators are assigned equal weights in forming the principal components
(Chatfield and Collins, 1980). The first Principal Component explains the maximum variance in
all the sub-indicators – eigenvalue of 3.3. The second principal component explains the maximum
amount of the remaining variance – a variance of 1.7. The third and fourth principal components
have an eigenvalue close to 1. The last four principal components explain the remaining 12.8% of
the variance in the dataset.
Table 3.2. Eigenvalues of the 8 sub-indicators’ set in TAI (n=23). Extraction method:
Principal Components Analysis
Eigenvalue % of variance Cumulative %
1
3.3 41.9 41.9
2
1.7 21.8 63.7
3
1.0 12.3 76.0
4
0.9 11.1 87.2
5
0.5 6.0 93.2
6
0.3 3.7 96.9
7
0.2 2.2 99.1
8
0.1 0.9 100.0
A drawback of the conventional PCA is that it does not allow for inference on the properties of
the general population. This is because, traditionally, drawing such inferences requires certain
distributional assumptions to be made regarding the population characteristics, and the PCA
techniques are not based upon such assumptions (see below on the “Assumptions of the PCA”).
Furthermore, in a traditional PCA framework, there is no estimation of the statistical precision of
the results, which is essential for relatively small sample sizes as in the present case of the TAI
example. Therefore, the bootstrap method has been proposed to be utilized in conjuction with
PCA to make inferences about the population (Efron and Tibshirani, 1991, 1993). Bootstrap
refers to the process of randomly re-sampling the original data set to generate new data sets.
Estimates of the relevant statistics are made for each bootstrap sample. A very large number of
bootstrap samples will give satisfactory results but the computation may be cumbersome. Various
values have been suggested, ranging from 25 (Efron and Tibshirani, 1991) to as high as 1000
(Efron, 1987; Mehlman et al., 1995).
An issue that arises at this point is whether the TAI data set for the 23 countries can be viewed as
a ‘random’ sample of the entire population as required by the bootstrap procedures (Efron 1987;
Efron and Tibshirani 1993). Several points can be made regarding the issues of randomness and
representativeness of the data. First, it is often difficult to obtain complete information for a data
set in the social sciences because, unlike the natural sciences, controlled experiments are not
always possible, as in the case here. As Efron and Tibshirani (1993) state: ‘in practice the
selection process is seldom this neat […], but the conceptual framework of random sampling is
still useful for understanding statistical inferences.’ Second, the countries included in the
restricted set show no apparent pattern as to whether or not they are predominately developed or
developing countries. In addition, the countries of varying sizes span all the major continents of
the world, ensuring a wide representation of the global state of technological development.
Consequently, the restricted set could be considered as representative of the total population. A
20
third point on the data quality is that a certain amount of measurement error is likely to exist.
While such measurement error can only be controlled at the data collection stage, rather than at
the analytical stage, it is argued that the data represent the best estimates currently available
(United Nations, 2001, p. 46).
Figure 3.1 (right) demonstrates graphically the relationship between the eigenvalues from the
deterministic PCA, their bootstrapped confidence intervals (5
th
and 95
th
percentiles) and the
ranked principal components. These confidence intervals allow one to generalize the conclusions
concerning the small set of the sub-indicators (23 countries) to the entire population (e.g. of 72
countries or even more general), rather than confining the conclusions only to the sample set
being analyzed. Bootstrapping has been performed for 1000 sample sets of size 23 (random
sampling with replacement). It is shown that the values of the eigenvalues drop sharply at the
beginning and then gradually approach zero after a certain point.
Figure 3.1. Eigenvalues for the 8 sub-indicators in the TAI examples (23 countries). Eigenvalues
from traditional Principal Components Analysis - Scree plot (left graph), Bootstrapped
eigenvalues, 1000 samples randomly selected with replacement (right graph).
The correlation coefficients between the principal components
Z
and the variables x are called
component loadings,
)x,Z(r
ij
. In case of uncorrelated variables x, the loadings are equal to the
weights
ij
a given in equation (3.1). Analogous to Pearson's
r
, the squared loading is the percent
of variance in that variable explained by the principal component. The component scores are the
scores of each case (country in our example) on each principal component. The component score
for a given case for a principal component is calculated by taking the case's standardized value on
each variable, multiplying by the corresponding loading of the variable for the given principal
component factor, and summing these products.
Table 3.3 presents the components loadings for the TAI sub-indicators. High and moderate
loadings (>0.50) indicate how the sub-indicators are related to the principal components. It can be
seen that with the exception of PATENTS and ROYALTIES, all the other sub-indicators are
entirely accounted for by one principal component alone and that the high and moderate loadings
are all found in the first four principal components. An undesirable property of these components
is that two sub-indicators are related strongly to two principal components.
0.0
0.5
1.0
1.5
2.0
2.5
3.0
3.5
4.0
4.5
12345678
Principal Component
Eigenvalu
e
0.0
0.5
1.0
1.5
2.0
2.5
3.0
3.5
4.0
4.5
12345678
Principal Component
Eigenvalue
21
Table 3.3. Component loadings for the TAI example (23 countries) of the eight sub-indicators.
Extraction method: principal components. Loadings greater than 0.5 (absolute values) are
highlighted.
1 2 3 4 5 6 7 8
PATENTS
-0.11
-0.75
0.13
0.60
-0.10 -0.12 -0.17 0.05
ROYALTIES
-0.56
-0.48 0.22
-0.54
0.27 -0.17 -0.04 0.10
INTERNET
-0.92
0.21 0.02 -0.10 0.04 0.11 -0.27 -0.13
EXPORTS
0.35
-0.85
0.01 -0.13 0.11 0.35 0.06 -0.08
TELEPHONES
-0.76
-0.39 -0.16 -0.16 -0.41 -0.16 0.16 -0.09
ELECTRICITY
-0.91
0.13 0.01 0.07 -0.19 0.30 0.04 0.16
SCHOOLING
-0.74
0.11 0.37 0.39 0.33 -0.02 0.20 -0.07
ENROLMENT
-0.36 -0.12
-0.87
0.15 0.26 -0.03 0.02 0.02
The question of how many principal components should be retained in the analysis without losing
too much information and how the interpretation of the components might be improved are
addressed without further ado in the following section on Factor Analysis.
3.1.2 Factor Analysis
Factor analysis (FA) has similar aims to PCA. The basic idea is still that it may be possible to
describe a set of Q variables x
1
, x
2
, , x
Q
in terms of a smaller number of m factors, and hence
elucidate the relationship between these variables. There is however, one important difference:
PCA is not based on any particular statistical model, but FA is based on a rather special model
(Spearman, 1904).
In a general form this model is given by:
x
1
= α
11
F
1
+ α
12
F
2
+ + α
1m
F
m
+ e
1
x
2
= α
21
F
1
+ α
22
F
2
+ + α
2m
F
m
+ e
2
x
Q
= α
Q1
F
1
+ α
Q2
F
2
+ + α
Qm
F
m
+ e
Q
(3.4)
where x
i
is a variable with zero mean and unit variance; α
i1
, α
i2
, , α
im
are the factor loadings
related to the variable X
i
; F
1,
F
2
, ,F
m
are m uncorrelated common factors, each with zero mean
and unit variance; and e
i
are the Q specific factors supposed independently and identically
distributed with zero mean. There are several approaches to deal with the model in equation (3.4),
e.g. communalities, maximum likelihood factors, centroid method, principal axis method, etc. All
them giving different values for the factos. The most common is the use of PCA to extract the
first m principal components and consider them as factors and neglect the remaining. Principal
components factor analysis is most preferred in the development of composite indicators (see
Section 6), e.g. Product Market Regulation Index (Nicoletti et al. 2000), as it has the virtue of
simplicity and allows the construction of weights representing the information content of sub-
indicators. Notice however that different extraction methods supply different values for the
factors thus for the weights, influencing the score of the composite and the corresponding country
ranking.
On the issue of how factors should be retained in the analysis without losing too much
information methodologists’ opinions differ. The decision of when to stop extracting factors
basically depends on when there is only very little "random" variability left, and it is rather
arbitrary. However, various guidelines (“stopping rules”) have been developed, and they are
22
reviewed below, roughly in the order of frequency of their use in social science (see Dunteman,
1989: 22-3).
Kaiser criterion. Drop all factors with eigenvalues below 1.0. The simplest justification to
this rule is that it doesn't make sense to add a factor that explains less variance than is
contained in one sub-indicator. According to this rule, 3 factors should be retained in the
analysis of the TAI example, although the 4
th
factor follows closely with an eigenvalues of
0.90 (see Table 3.2).
Scree plot. This method proposed by Cattell plots the successive eigenvalues, which drop off
sharply and then tend to level off. It suggests retaining all eigenvalues in the sharp descent
before the first one on the line where they start to level off. This approach would result in
retaining 3 factors in the TAI example (Figure 3.1).
Variance explained criteria. Some researchers simply use the rule of keeping enough
factors to account for 90% (sometimes 80%) of the variation. The first 4 factors account for
87.2% of the total variance (see Table 3.2).
Joliffe criterion. Drop all factors with eigenvalues under 0.70. This rule may result in twice
as many factors as the Kaiser criterion, and it is less often used. In the present case study, this
criterion would have lead to the selection of 4 factors.
Comprehensibility. Though not a strictly mathematical criterion, there is much to be said for
limiting the number of factors to those whose dimension of meaning is readily
comprehensible. Often this is the first two or three.
A relatively recent method for deciding on the number of factors to retain combines the
bootstrapped eigenvalues and eigenvectors (Jackson 1993, Yu et al. 1998). Based on a
combination of the Kaiser criterion and the bootstrapped eigenvalues, we should consider the
first 4 factors in the TAI example.
In light of the above analysis, we retain the first four principal components as identified by the
bootstrap eigenvalue approach combined with the Kaiser criterion. This choice implies a greater
willingness to overstate the significance of the fourth component and be in line with the idea that
there are four main categories of technology achievement indicators.
After choosing the number of factors to keep, rotation is a standard step performed to enhance
the interpretability of the results (see for instance Kline, 1994). With rotation the sum of
eigenvalues is not affected by rotation, but rotation, changing the axes, will alter the eigenvalues
of particular factors and will change the factor loadings. There are various rotational strategies
that have been proposed. The goal of all of these strategies is to obtain a clear pattern of loadings.
However, different rotations imply different loadings, and thus different meanings of principal
components - a problem some cite as a drawback to the method. The most common rotation
method is the “varimax rotation”.
Table 3.4 presents the factor loadings for the first factors in the TAI example. Note that the
eigenvalues have been affected by the rotation. The variance accounted for by the rotated
components is spread more evenly than for the unrotated components (Table 3.2). The first four
factors account now for 87% of the total variance and are not sorted into descending order
according to the amount of the original’s dataset variance explained. The first factor has high
positive coefficients (loadings) with INTERNET (0.79), ELECTRICITY (0.82) and
SCHOOLING (0.88). Factor 2 is mainly dominated by PATENTS and EXPORTS, whilst
ENROLMENT is exclusively loaded on Factor 3. Finally, Factor 4 is formed by ROYALTIES
and TELEPHONES. Yet, despite the rotation of factors, the sub-indicator of EXPORTS has
23
sizeable loadings in both Factor 1 (negative loading) and Factor 2 (positive loading). A
meaningful interpretation of the factors is not straightforward. Furthermore, the statistical
treatment of the eight sub-indicators results in different groups (factors) than the conceptual ones
(see Table A.1 in Appendix).
Table 3.4. Rotated factor loadings for the TAI example (23 countries) of the eight sub-indicators.
Extraction method: principal components, varimax normalised rotation. Positive loadings
greater than 0.5 are highlighted.
Factor 1 Factor 2 Factor 3 Factor 4
PATENTS
0.07
0.97
0.06 0.06
ROYALTIES
0.13 0.07 -0.07
0.93
INTERNET
0.79
-0.21 0.21 0.42
EXPORTS
-0.64
0.56
-0.04 0.36
TELEPHONES
0.37 0.17 0.38
0.68
ELECTRICITY
0.82
-0.04 0.25 0.35
SCHOOLING
0.88
0.23 -0.09 0.09
ENROLMENT
0.08 0.04
0.96
0.04
Explained variance
2.64 1.39 1.19 1.76
Cumulative variance explained (%)
33 50 65 87
Another method of extracting factors that deals with the uncorrelation issue of the specific factors
would have given different results. Just to give an example, Table 3.5 presents the rotated factor
loadings of the four factors for the TAI case study (extraction method: principal factors maximum
likelihood). For instance, ELECTRICITY and SCHOOLING are not loaded any more both on F1,
but ELECTRICITY is loaded on F4 and SCHOOLING on F3. There is 76% variance that is
common in the sub-indicators set and expressed by the four rotated common factors. In contrast,
the total variance explained in the previous analysis by the four rotated principal components was
much higher (87%).
Table 3.5. Rotated factor loadings for the TAI example (23 countries). Extraction
method: principal factors maximum likelihood, varimax normalised rotation.
Factor 1 Factor 2 Factor 3 Factor 4
PATENTS
0.01 0.11
0.88
0.13
ROYALTIES
0.96
0.14 0.09 0.18
INTERNET
0.31
0.56
-0.29
0.60
EXPORTS
0.29 -0.45
0.58
-0.14
TELEPHONES
0.41 0.13 0.18
0.73
ELECTRICITY
0.13 0.57 -0.13
0.73
SCHOOLING
0.14
0.95
0.10 0.14
ENROLMENT
-0.01 0.03 0.03 0.39
Explained Variance
1.31 1.80 1.27 1.67
Cumulative variance explained (%)
16 39 55 76
To sum up the steps of PCA/FA as exploratory analysis method:
1. Calculate the covariance/correlation matrix: if the correlations between sub-indicators are
small, it is unlikely that they share common factors.
2. Identify the number of factors that are necessary to represent the data and the method for
calculating them.
24
3. Rotate factors to enhance their interpretability (by maximizing loading of sub-indicators
individual factors).
There are several assumptions in the application of PCA/FA, which we are discussed in the box
below. These assumptions are mentioned in almost all textbooks, yet they are often neglected
when composite indicators are developed.
Box: Assumptions in Principal Components Analysis and Factor Analysis
1. Enough number of cases. The question of how many cases (or countries) are necessary to do
PCA/FA has no scientific answer and methodologists’ opinions differ. Alternative arbitrary
rules of thumb in descending order of popularity include those below.
(a) Rule of 10
. There should be at least 10 cases for each variable.
(b) 3:1 ratio
. The cases-to-variables ratio should be no lower than 3 (Grossman et al. 1991).
(c) 5:1 ratio
. The cases-to-variables ratio should be no lower than 5 (Bryant and Yarnold,
1995; Nunnaly 1978, Gorsuch 1983).
(d) Rule of 100
: The number of cases should be the larger between (5 × number of
variables), and 100. (Hatcher, 1994).
(e) Rule of 150
: Hutcheson and Sofroniou (1999) recommend at least 150 - 300 cases, more
toward 150 when there are a few highly correlated variables.
(f) Rule of 200
. There should be at least 200 cases, regardless of the cases-to-variables ratio
(Gorsuch, 1983).
(g) Significance rule
. There should be 51 more cases than the number of variables, to support
chi-square testing (Lawley and Maxwell, 1971)
These rules are not mutually exclusive. Bryant and Yarnold (1995), for instance, endorse both
the cases-to-variables ratio and the Rule of 200. In the TAI example, there are 23:8 cases-to-
variables, therefore the first and the second rule are satisfied.
2. No bias in selecting sub-indicators. The exclusion of relevant sub-indicators and the
inclusion of irrelevant sub-indicators in the correlation matrix being factored will affect, often
substantially, the factors which are uncovered. Although social scientists may be attracted to
factor analysis as a way of exploring data whose structure is unknown, knowing the factorial
structure in advance helps select the sub-indicators to be included and yields the best analysis
of factors. This dilemma creates a chicken-and-egg problem. Note this is not just a matter of
including all relevant sub-indicators. Also, if one deletes sub-indicators arbitrarily in order to
have a "cleaner" factorial solution, erroneous conclusions about the factor structure will result
(see Kim and Mueller, 1978a: 67-8).
3. No outliers. As with most techniques, the presence of outliers can affect interpretations
arising from PCA/FA. One may use Mahalanobis distance to identify cases which are
multivariate outliers and remove them prior to the analysis. Alternatively, one can also create
a dummy variable set to 1 for cases with high Mahalanobis distance, then regress this dummy
on all other variables. If this regression is non-significant (or simply has a low R-squared for
large samples) then the outliers are judged to be at random and there is less danger in
retaining them. The ratio of the regression coefficients indicates which variables are most
associated with the outlier cases.
4. Assumption of interval data. Kim and Mueller (1978b, pp.74-75) note that ordinal data may
be used if it is thought that the assignment of ordinal categories to the data does not seriously
25
distort the underlying metric scaling. Likewise, these authors allow the use of dichotomous
data if the underlying metric correlations between the variables are thought to be moderate
(.7) or lower. The result of using ordinal data is that the factors may be much harder to
interpret. Note that categorical variables with similar splits will necessarily tend to correlate
with each other, regardless of their content (see Gorsuch, 1983). This is particularly apt to
occur when dichotomies are used. The correlation will reflect similarity of "difficulty" for
items in a testing context, hence such correlated variables are called difficulty factors. The
researcher should examine the factor loadings of categorical variables with care to assess
whether common loading reflects a difficulty factor or substantive correlation.
5. Linearity. Principal components factor analysis (PFA), which is the most common variant of
FA, is a linear procedure. Of course, as with multiple linear regression, nonlinear
transformation of selected variables may be a pre-processing step, but this is not common.
The smaller the sample size, the more important it is to screen data for linearity.
6. Multivariate normality of data is required for related significance tests. PCA and PFA have
no distributional assumptions. Note, however, that a variant of factor analysis, maximum
likelihood factor analysis, does assume multivariate normality. The smaller the sample size,
the more important it is to screen data for normality. Moreover, as factor analysis is based on
correlation (or sometimes covariance), both correlation and covariance will be attenuated
when variables come from different underlying distributions (ex., a normal vs. a bimodal
variable will correlate less than 1.0 even when both series are perfectly co-ordered).
7. Underlying dimensions shared by clusters of sub-indicators are assumed. If this assumption
is not met, the "garbage in, garbage out" principle applies. Factor analysis cannot create valid
dimensions (factors) if none exist in the input data. In such cases, factors generated by the
factor analysis algorithm will not be comprehensible. Likewise, the inclusion of multiple
definitionally-similar sub-indicators representing essentially the same data will lead to
tautological results.
8. Strong intercorrelations are not mathematically required, but applying factor analysis to a
correlation matrix with only low intercorrelations will require for solution nearly as many
factors as there are original variables, thereby defeating the data reduction purposes of factor
analysis. On the other hand, too high inter-correlations may indicate a multi-collinearity
problem and collinear terms should be combined or otherwise eliminated prior to factor
analysis.
(a) The Kaiser-Meyer-Olkin (KMO) measure of sampling adequacy is a statistics for
comparing the magnitudes of the observed correlation coefficients to the magnitudes of the
partial correlation coefficients. The concept is that the partial correlations should not be very
large if one is to expect distinct factors to emerge from factor analysis (see Hutcheson and
Sofroniou, 1999, p.224). A KMO statistic is computed for each individual sub-indicator, and
their sum is the KMO overall statistic. KMO varies from 0 to 1.0. A KMO overall should be
.60 or higher to proceed with factor analysis (Kaiser and Rice, 1974), though realistically it
should exceed 0.80 if the results of the principal components analysis are to be reliable. If
not, it is recommended to drop the sub-indicators with the lowest individual KMO statistic
values, until KMO overall rises above .60.
(b) Variance-inflation factor (VIF) is simply the reciprocal of tolerance. A VIF value greater
than 4.0 is an arbitrary but common cut-off criterion for suggesting that there is a multi-