Phân tích tỷ lệ tăng giá thuê tai cac giai đoạn khác nhau trong chu kỳ của thị trường bất động sản "An analysis of rental growth rates RE market cycle"
Bạn đang xem bản rút gọn của tài liệu. Xem và tải ngay bản đầy đủ của tài liệu tại đây (36.24 KB, 8 trang )
An Analysis of Rental Growth Rates
During Different Points in the
Real Estate Market Cycle
by
Glenn R. Mueller, Ph.D.
Real Estate Research Group Head at
Legg Mason Wood Walker, Inc. and
Faculty member of the Berman Real Estate Institute at Johns Hopkins University
internet
and
Anatole Pevnev
Vice President, Real Estate Research
Legg Mason Wood Walker, Inc.
internet
111 S. Calvert Street, P.O. Box 1476
Baltimore, MD 21203-1476
410-539-0000
presented at
The American Real Estate Society Meetings
Sarasota, Florida
April 16-19, 1997
Analysis of Rental Growth Rates During Different Points in the Real Estate Market Cycle
2
Analysis of Rental Growth Rates During Different Points
in the Real Estate Market Cycle
Abstract
Real estate markets go through both physical (demand and supply) cycles and financial cycles (capital flows
and price movements). (Mueller 1995) If asked when a market cycle last peaked, real estate professionals will
give different answers that use demand, supply, vacancy, rental growth or price trends. This lack of standard
definition is confusing and leads to both research and investment problems. A growing body of research
literature on real estate market cycles have examined the potential uses and understanding of real estate
physical and financial cycles. This paper develops a rental growth hypothesis and then examines historic rental
growth and the distribution of rent growth during different physical market cycle phases for 54 office and
industrial markets in the U.S. The data confirms that rental growth rates are quite different in different
physical market cycle phases, yet the distribution of rental growth among markets that are in the same position
in their market cycle can be quite wide. Thus while rental growth rates should be generally predictable during
different cycle phases, the exact amount of rental growth will vary greatly by market. This paper is only a first
step at understanding the localized nature of demand and supply basics and the impacts they have on rental
growth, which is the first step in the complex process of understanding price movements and ultimately
investment returns. This calls for further research as to determinants of rental growth at different points in the
physical market cycle.
Introduction
While vacancy rates indicate the balance between demand and supply in a real estate market, rental growth
helps to determine the profitability of investments in the marketplace over the long term. This article examines
rental growth rates in 54 different markets across the U.S. in both office and industrial properties. This paper
examines rates of gross asking rents in different real estate market cycle phases in a different markets. Asking
rents are the method used by building owners to signal to renters their desired terms. The growth of asking
rents may also help to determine investment pricing over the long run, but history has shown that capital flows
also have a major impact on property pricing and therefore investment returns. This paper does not examine
capital flows or total property returns, as the complex set of interdependencies between the physical markets
and the capital markets is not yet well understood. This paper is only a first step at understanding the localized
nature of demand and supply basics and the impacts they have on rental growth, which is the first step in the
complex process of understanding price movements and ultimately investment returns.
Literature Review
Real estate cycles were first discussed by Homer Hoyte in 1933 in his analysis of the Chicago marketplace, and
received scattered attention over the years. Pritchett (1984) theorized that there is a national real estate market
cycle, but that each property type's cycle was not exactly coincident. He stated that supply growth and decline
always lagged demand growth and decline and that turning points in the top and bottom of any cycle could be
determined when supply and demand growth were moving in opposite directions, however recognition of
turning points was less useful to investors than anticipation of such points. He applied these ideas by stating
that the most advantageous buying opportunities generally exist during late declining, bottom, and early rising
portions of the real estate cycle.
Witten (1987) stated that every city had its own property cycles which will be unique in length of time and
degree of change and this comes from the internal dynamics of each market. He also stated that new supply
while being cyclical is somewhat more volatile than demand, as supply is often determined by the availability of
financing rather than by market need. He also observed that markets seldom move as smoothly as the
classically drawn curves, but instead move in "fits and starts" causing investors to hesitate and wait for clear
signs as to market changes.
Analysis of Rental Growth Rates During Different Points in the Real Estate Market Cycle
3
Brown (1984) described cycle modeling as a simplification of the complexities of reality which hopefully
capture the crucial features of the economic sector or system being studied. He believed that time series should
be used to determine the length and breadth of cycles as it seeks to measure movement over time. Also the
longer the period of time the better the understanding of the movement. A key to cycle credibility is the
identification and removal of trend and seasonal components inherent in time series data. He concluded that if
feasibility analysts, investment advisors, and principals or lenders are to give credibility to cyclical behavior,
much more research needs to be done. There are currently no uniform measurement procedures making it
difficult to agree on the length and breadth of cycle rhythms. Because the downside of cycles creates extreme
economic obsolescence, real estate professionals need to maintain the perspective of cyclical timing.
Wheaton (1987) estimated the national office market cycle to have a length of between 10 and 12 years by
using a sample of 10 cities. He found that these 10 cities had turning points in their own series that are within
one or two years of the combined average series. He studied the causes of market movement that make the
office market cyclical. One of his findings was that the tenure structure of office leases was usually long term
(e.g. 10-15 years). His explanatory model found that expected employment growth has a strong significance in
determining cycle behavior thus creating an adaptive demand model and concluded that supply responds more
readily to the state of the economy (as developers adjust their expectations) than demand and can actually help
curtail the magnitude of the cycle. He concluded that both supply and demand respond to changes in the
economy although supply is definitely more responsive than demand.
Wheaton & Torto (1988) studied rent and vacancy rate cycles and found that there was a market rental
adjustment mechanism that caused real office rents to drop approximately 2% annually for every percentage
point of excess vacancy in the market. They also found that the average office vacancy rate was trending
upward over the 1968 to 1986 time period studied.
Mueller and Laposa (1994 and 1995) discussed the difference between overall market and submarket cycles.
Their research found that submarkets can move differently from the overall market in the short run, but will
typically trend toward market movements as locational advantages get appropriately priced in the marketplace.
Mueller 1995 stratified real estate market cycles into a physical cycle that looked at only the demand and
supply of physical space and a financial cycle that looked at the capital flows into real estate for both existing
properties and new construction. This separation between physical and financial cycles helps to explain the lag
that appears to exist between market movements and real estate prices.
Economic literature addresses price dispersion under various search models. Butters (1977) postulated that
imperfect information on the consumers part alone is insufficient to support price dispersion. Others have
shown that heterogeneity among producers explains price dispersion [Carlson and McAfee (1983), MacMinn
(1980)]. Nitzan and Tzur show that price dispersion can exist even when fully rational economic agents on
both sides are homogeneous. Fershyman and Fishman (1992) present a dynamic search model which accounts
for cyclical patterns of prices and demand. Thus, the behavior, strategies, and expectations of landlords and
search behavior of tenants at various points in the real estate cycle may be explained by search theory models
and price dispersion theory when we examine the rent price distributions in real estate markets.
Cycle Theory
Real estate market cycles can be broken into four distinct phases based upon the combination of supply and
demand characteristics. Markets have a combination of either under or over supply and more or less demand
than necessary for the existing supply. Market equilibrium is defined as that point in the cycle when supply
and demand are in balance (with enough vacant space to accommodate the next tenant move or the next
marginal tenant to enter the marketplace.) The interaction of supply and demand above and below the
equilibrium point is very different. While impossible to pinpoint accurately, this equilibrium point in the cycle
can be most easily identified by a long term average vacancy rate calculated over a number of historic cycles.
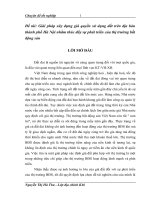
Exhibit 1 helps to identify the supply and demand interaction. Starting with Phase one (recovery) at the bottom
of a cycle, the marketplace is in a state of oversupply due to previous oversupply (new construction) or negative
Analysis of Rental Growth Rates During Different Points in the Real Estate Market Cycle
4
demand growth. At this bottom point vacancy rates hit their peak (or occupancy is at its lowest level in the
cycle). Typically the market bottom is when the excess construction from the previous cycle stops. As the cycle
bottom is passed demand growth begins to slowly absorb the existing oversupply and supply growth is non-
existent or very low. As the excess space is absorbed, vacancy rates fall allowing rental rates in the market to
stabilize and even begin to increase (typically at below inflation levels). As this recovery phase continues,
positive feelings about the market allow landlords to increase rents at a slow pace. Eventually the market
reaches equilibrium where supply and demand are in balance and the only excess space is that which will fulfill
future expected demand.
Graph 1
Market Cycle Quadrants
Declining Vacancy
New Construction
No New Construction
Increasing
Vacancy
Declining Vacancy
Increasing
Vacancy
More Completions
New Construction
Phase 1 - Recovery
Phase 2 - Expansion
Phase 3 - Hypersupply
Phase 4 - Recession
Equilibrium
In Phase two of the cycle (expansion) demand growth continues at increasing levels causing the need for
additional space. As vacancy rates fall below the equilibrium level, signaling that supply is tight in the
marketplace, rents begin to rise rapidly (above inflation levels) until they reach a "cost feasible" level that
allows new construction to commence. In this period of tight supply, rapid rental growth can be experienced
which some observers call rent spikes (as landlords demand higher prices and tenants agree to pay them due to
lack of alternatives in existing supply). Some developers may also begin speculative construction in
anticipation of "cost feasible" rents if they are able to obtain financing at this point in the cycle. Once cost
feasible rents are achieved in the marketplace, demand growth and supply growth may continue at similar rates
for some period of time. Long expansionary periods are possible and many historic real estate cycles show that
the overall up-cycle is a slow uphill climb.
At some point in time the peak in the cycle is reached. This peak can be described as the "inflection point" in
the demand and supply growth curves where the rate of demand growth drops below the rate of supply growth.
At this point the space market is tight and rents are high. The peak is passed when the marginal rate of change
in supply becomes higher than the marginal rate of change in demand.
Phase three of the real estate cycle (hypersuply) commences after the demand/supply inflection point, however
most participants do not recognize this peak as vacancy rates are below equilibrium, thus the market is still in
tight supply and looks good. During phase three supply growth is higher than demand growth and vacancy
rates rise back toward the market equilibrium level. While there is no oversupply during this period, new
supply completion’s compete for tenants in the marketplace and rental growth slows from a high point at the
Analysis of Rental Growth Rates During Different Points in the Real Estate Market Cycle
5
peak of the cycle when space is most difficult to find Eventually market participants realize that the market
has turned and commitments to new construction should slow or stop.
If new supply continues to grow once the equilibrium point is reached, the market will move into phase four.
Phase four begins as the market moves past the equilibrium demand/supply level with high supply growth and
low or negative demand growth. The extent of the market down-cycle will be determined by the difference
(excess) between the market supply growth and demand growth. Massive oversupply coupled with negative
demand growth in the late 1980s sent most U.S. office markets into the largest down-cycle ever experienced.
During this phase landlords realize that they will quickly loose market share if their rental rates are not
competitive and they lowered rents to capture tenants, even if only to cover their building's fixed expenses.
Market liquidity is also low or non-existent in this phase as the bid ask spread in property prices is too wide.
The cycle eventually reaches bottom as new construction and completions cease or as demand growth turns up
and begins to grow at rates higher than any new supply added in the marketplace.
Rental Growth Theory
This theory assumes that asking rent growth is a function of the market’s position in the real estate cycle phase.
Therefore during the recovery phase of the cycle vacancies are at their highest and demand (absorption) is just
beginning to increase, rents will begin at negative levels and increase as the cycle moves toward the
equilibrium point, but still stay below the level of inflation. In the growth phase of the cycle rents will increase
at higher than inflation rates, reaching the highest rate at the market peak (highest occupancy or lowest
vacancy). In the hyper supply phase rents will continue to grow but at declining rates until the market reaches
equilibrium on the way down. In the recession phase rents will continue to decline and growth will be below
inflation levels or even negative as the bottom of the cycle is reached.
The distribution of rental growth rates should also vary during different points in the cycle, being very wide at
the bottom of the cycle and narrowing as the market improves, all the way to the peak of the cycle. This
distribution tightening should be the result of the market becoming more efficient as landlords take control for
the tenants and look to their competition for pricing. As the market goes through a down-cycle the rent
distribution should steadily increase as landlords fight for tenants and tenants are able to demand lower rents.
At different points in the down-cycle some landlords will try to hold out for higher rents while others will drop
their prices to obtain tenants at any cost, causing the distribution of asking rents to widen until the market
reaches the bottom and the cycle. When the market finally bottoms all landlords finally resolve themselves to
the situation and distributions may narrow. Then the cycle starts all over again. Thus the apriori expected
change in rent variance is one of narrowing as the market improves in an up-cycle to the market peak, then
widens in the oversupply and recession phases of the cycle and then potentially consolidates at the bottom of the
cycle.
Data
Market information was used from Torto Wheaton Research including demand, supply, absorption, vacancy
and gross asking rent growth data for 54 office markets and 54 industrial markets. The time period for each
market varies and begins as early as 1967 and concludes with the 4th Quarter of 1995. Each gross asking rental
growth rate is the average rental growth rate for all buildings available in a given market. Thus if one building
has three spaces available at $15, $16, and $ 17 respectively, the average asking rental rate of that building will
be $16 - not size weighted or value weighted.
Methodology
The following steps were completed for each market:
1. An equilibrium vacancy rate was calculated according to the Mueller-Laposa methodology
(1994). Actual vacancy rates for the market were compared to the equilibrium vacancy rate
in order to identify specific time periods corresponding to cyclical phases.
Analysis of Rental Growth Rates During Different Points in the Real Estate Market Cycle
6
2. The market cycle was broken into 16 positions and each year of each market was assigned to
a market cycle position one through sixteen. (Graph 2)
3. Market cycle positions were connected to the growth rates for each year and for each market,
then the aggregate average growth rate for each cycle position was calculated and the
distributions examined.
Graph 2
3
Cycle Position Labels
4
Equilibrium
1
2
5
6
7
11
10
9
8
16
15
14
13
12
Cost Feasible Rents Level
Hypothesis to be tested include:
1. Rental growth rates vary by physical cycle position. Increasing during an up-cycle and
declining during a down-cycle
2. Rental growth distribution varies by cycle position, with distributions narrowing during an
up-cycle and widening during a down-cycle. Then consolidating at the market bottom.
Results
Summary tables, graphs, and general descriptives are presented in Exhibits 1-8.
Office vacancy rates started at a high of 22.8% at the bottom of the cycle (position 1) and the standard deviation
of vacancy rates was 4.8%. (see exhibit 1) Office vacancy rates reached their lowest point of 4.4% at position
11 the peak of the cycle. The standard deviation of vacancy rates steadily declined throughout the up-cycle to a
low of 2.5% although the standard deviation at the peak was 2.9%. Vacancy rates rose during the down-cycle
back to 19.3% in position 16 and standard deviations grew back to 4.3%. Average office absorption also grew
during the up-cycle from a low of 2.2% to a high of 8.7% and then fell during the down-cycle back to 4.4%.
The standard deviation of absorption did increase in the up-cycle and decline in the down-cycle (see exhibit 2).
Office completion rates were high at the bottom of the cycle 7.7% then dropped to 3% on average in position 2
and stayed low through the recovery phase and into the first position of the expansion phase (position 7). From
the cost feasible point, completion rates rose to a peak of 8.9% in position 13 (already over the top and into the
hyper supply phase) and stayed strong through the rest of the down-cycle. (see exhibit 3). Office rental growth
was negative in cycle positions one and two then was low but positive through the rest of the recovery phase of
the cycle. Beginning at the equilibrium level rental growth jumped to 4% (above inflation levels) and increased
to a high of 13.8% in position 10 (just before the cycle peak). Rental growth then steadily declined during the
Analysis of Rental Growth Rates During Different Points in the Real Estate Market Cycle
7
hypersupply and recession phases of the down-cycle . Growth dropped below inflation in the recession phase
and became negative again in position 16. (see exhibit 4).
Industrial vacancy rates started at a high of 13.1% near the bottom of the cycle (position 2) and the standard
deviation of vacancy rates was 4.2%. (see exhibit 5) Industrial vacancy rates reached their lowest point of
4.5% at position 11 the peak of the cycle. The standard deviation of vacancy rates steadily declined throughout
the up-cycle to a low of 1.3% although the standard deviation at the peak was 1.9%. Vacancy rates rose during
the down cycle back to 10.5% in position 16 and standard deviations grew back to 3.1%. Average industrial
absorption also grew during the up-cycle from a low of -0.3% to a high of 3.6% and then fell during the down-
cycle back to 0.1%. The standard deviation of absorption did increase in the up-cycle and decline in the down-
cycle (see exhibit 6). Industrial completion rates were low at the bottom of the cycle 0.9% then dropped more
to 0.3% on average in position 5. From the cost feasible point (position 6), completion rates rose to a peak of
2.9% in position 11 the top of the cycle and stayed strong through the down-cycle. (see exhibit 7). Industrial
rental growth was low but erratic in the recovery phase being positive in cycle positions one and two then
negative in cycle position 3 (due to some strong outliers). Growth became strong and positive in position 5 and
through the rest of the growth cycle peaking in position 10 at 9.8%. Rental growth then steadily declined
during the hypersupply and recession phases of the down-cycle. Growth dropped below inflation in the
recession phase and became negative again in position 16. (see exhibit 8).
Conclusion
Physical market cycles defined by demand and supply variable interaction (which leads to occupancy level
cycles in all markets) are relatively stable in their trends. The dispersion of demand, supply and vacancy levels
does decrease in up-cycle and increase in down-cycles. Market rental growth rates behaved as hypothesized,
being low and negative at the bottom of the physical cycle, improving rapidly above equilibrium and growing at
high rates near the peak of the physical cycle. Rental growth then steadily declined during the hyper-supply
and recession phases of the down cycle. Rental growth dispersion also behaved as expected, narrowing in the
up-cycle and widening in the down-cycle. There did not appear to be consolidation in growth rates at the
bottom of the market cycle though as hypothesized These results point to the continued use of cycle research in
projecting rental growth rates in office markets.
Industrial markets showed similar results in the demand, supply and vacancy levels with slight variations.
Industrial rental growth rates were less homogeneous, being low negative and low positive in the recovery
phase, then going through sporadically increasing rates during the up-cycle and smoother declining rates
during the down-cycle to low and negative rates in the recession phase. Thus industrial rental growth rates
appear to be relatively predictable except during the recovery phase of the cycle.
These results lead to the conclusion that local supply and demand characteristics do play a major role in rental
rate growth in markets. These results can be used for making investment decisions, as more accurate rental
growth rates can now be entered into the discounted cash flow programs used by real estate investors. The next
step in research is to look at the correlation of prices to rental rate growth to see how much influence rental
growth has on prices, followed by research on the capital market factors (interest rates and capital flows)
impacts on prices.
Analysis of Rental Growth Rates During Different Points in the Real Estate Market Cycle
8
References
Brown, Gordon T., "Real Estate Cycles Alter the Valuation Perspective," Appraisal Journal, 52(4): 539-549,
1984.
Butters, G. R. “Equilibrium Distribution of Sales and Advertising Prices,” Review of Economic Studies 44
(1977) 487-491.
Carlson, J.A. and McAfee, R.D., “Discrete Equilibrium Price Dispersion,” Journal of Political Economy (1983)
91, 480-493
Fershtman, Chaim and Fishman, Arthur, “Price Cycles and Booms: Dynamic Search Equilibrium”, The
American Economic Review (1992) Vol 82, No. 5, 1221-1233.
Hosier, Amy L. W. “A New Look at Rental-Price Adjustment in Office Markets: Do Vacancy Rates Really
Matter?”, Real Estate Research Institute.
MacMinn, R. D. “Search and Market Equilibrium,” Journal of Political Economy (1980) 88, 308-315.
Mueller, Glenn R., “Understanding Real Estate’s Physical and Financial Market Cycles”, Real Estate Finance,
Spring 1995 12, 1.
Mueller, Glenn R., Laposa Steven P., Evaluating Real Estate Markets Using Cycle Analysis, paper presented at
the 1994 American Real Estate Society Meetings in Santa Barbara, CA
Mueller, Glenn R., Laposa Steven P., Real Estate Market Evaluation Using Cycle Analysis, paper presented at
the 1995 International Real Estate Society Conference, Stockholm, Sweden.
Mueller, Glenn R., Laposa Steven P., Submarket Cycle Analysis- A Case study of submarkets in Philadelphia,
Seattle and Salt Lake, paper presented at the 1994 American Real Estate Society Meetings in Santa Barbara,
CA
Nitzan, Shmuel, and Tzur, Joseph, “Costly Diagnosis and Price Dispersion” Economics Letters 36 (1991) 245-
251.
Pritchett, Clayton P., "Forecasting the Impact of Real Estate Cycles on Investments," Real Estate Review,
13(4): 85-89, 1984.
Wheaton, William C., "The Cyclic Behavior of the National Office Market," AREUEA Journal 15(4): 281-
299, 1987.
Wheaton, William C. and R. G. Torto, "Vacancy Rates and the Future of Office Rents," AREUEA Journal
16(4): 430-455, 1988.
Wheaton, William C., Torto, Raymond G., Southard, Jon A. “Flight To or From Quality” paper presented at
the 1995 ARES meeting
Witten, Ronald G., "Riding the Real Estate Cycle," Real Estate Today, 42-48, August 1987.