Astm f 2869 10 (2016)
Bạn đang xem bản rút gọn của tài liệu. Xem và tải ngay bản đầy đủ của tài liệu tại đây (466.62 KB, 8 trang )
Designation: F2869 − 10 (Reapproved 2016)
Standard Practice for
Radial Light Truck Tires to Establish Equivalent Test
Severity Between a 1.707-m (67.23-in.) Diameter Rotating
Roadwheel and a Flat Surface1
This standard is issued under the fixed designation F2869; the number immediately following the designation indicates the year of
original adoption or, in the case of revision, the year of last revision. A number in parentheses indicates the year of last reapproval. A
superscript epsilon (´) indicates an editorial change since the last revision or reapproval.
typical radial light truck (LT) tires. See Section 7 and the
research report2 for more details.
1.2.1 For users viewing the standard on CD-ROM or PDF,
with an active and working internet connection, the profilers
can be accessed on the ASTM website by clicking on the links
in 7.5 and 7.6.
1.2.2 For users viewing the standard in a printed format, the
profilers can be accessed by entering the links to the ASTM
website in 7.5 and 7.6 into their internet browsers.
1. Scope
1.1 This practice describes the procedure to identify equivalent test severity conditions between a 1.707-m diameter
laboratory roadwheel surface and a flat or highway surface for
radial pneumatic light truck (LT) tires.
1.1.1 Tire operational severity, as defined as the running or
operational temperature for certain specified internal tire
locations, is not the same for these two test conditions. It is
typically higher for the laboratory roadwheel at equal load,
speed and inflation pressure conditions due to the curvature
effect.
1.1.2 The practice applies to specific operating conditions of
light truck tires up through load range E for such tires used on
vehicles having a gross vehicle weight rating (GVWR) ≤4536
kg (10000 lb).
1.1.3 The specific operating conditions under which the
procedures of the practice are valid and useful are completely
outlined in Section 6, (Limitations) of this standard.
1.1.4 It is important to note that this standard is composed of
two distinct formats:
1.1.4.1 The usual text format as published in this volume of
the Book of Standards (Vol. 09.02).
1.1.4.2 A special interactive electronic format that uses a
special software tool, designated as prediction profilers or
profilers. This special profiler may be used to determine
laboratory test conditions that provide equivalent tire internal
temperatures for the belt edge region for the two operational
conditions, that is, the curved laboratory roadwheel and flat
highway test surfaces.
1.3 For this standard, SI units shall be used, except where
indicated.
1.4 This standard does not purport to address all of the
safety concerns, if any, associated with its use. It is the
responsibility of the user of this standard to establish appropriate safety and health practices and determine the applicability of regulatory limitations prior to use.
2. Referenced Documents
1.2 The prediction profilers are based on empirically developed linear regression models obtained from the analysis of a
large database that was obtained from a comprehensive experimental test program for roadwheel and flat surface testing of
2.1 ASTM Standards:3
F414 Test Method for Energy Absorbed by a Tire When
Deformed by Slow-Moving Plunger
F538 Terminology Relating to the Characteristics and Performance of Tires
F551 Practice for Using a 67.23-in. (1.707-m) Diameter
Laboratory Test Roadwheel in Testing Tires
F1922 Test Method for Tires, Pneumatic, Vehicular, Highway
F2779 Practice for Commercial Radial Truck-Bus Tires to
Establish Equivalent Test Severity Between a 1.707-m
(67.23-in.) Diameter Roadwheel and a Flat Surface
IEEE/ASTM SI 10 American National Standard for Use of
the International System of Units (SI): The Modern Metric
System
1
This practice is under the jurisdiction of ASTM Committee F09 on Tires and is
the direct responsibility of Subcommittee F09.30 on Laboratory (Non-Vehicular)
Testing.
Current edition approved Oct. 1, 2016. Published October 2016. Originally
approved in 2010. Last previous edition approved in 2010 as F2869 – 10. DOI:
10.1520/F2869-10R16.
2
Supporting data have been filed at ASTM International Headquarters and may
be obtained by requesting Research Report RR: F09-1002.
3
For referenced ASTM standards, visit the ASTM website, www.astm.org, or
contact ASTM Customer Service at For Annual Book of ASTM
Standards volume information, refer to the standard’s Document Summary page on
the ASTM website.
Copyright © ASTM International, 100 Barr Harbor Drive, PO Box C700, West Conshohocken, PA 19428-2959. United States
1
F2869 − 10 (2016)
3. Terminology
3.1.15 tire, pneumatic, n—a hollow tire that becomes loadbearing upon inflation with air, or other gas, to a pressure
F538
above atmospheric.
3.1.16 tire, radial, n—a pneumatic tire in which the ply
cords that extend to the beads are laid substantially at 90° to the
center line of the tread, the tire being stabilized by a belt. F538
3.1.17 tire speed rating, n—the maximum speed for which
the use of the tire is rated under certain conditions as
designated by the speed symbol marked on the tire sidewall or
maximum speed rating as determined by the manufacturer.
3.1.18 tire test speed, n—the tangential speed at the point of
contact with the road curved surface of a rotating tire for
evaluation purposes.
3.1 Definitions:
3.1.1 belt edge (BE) temperature, n— in the cross section of
a radial tire, the temperature at the edge of the stabilizer plies
or belts, for example, in the rubber region of the two belt edges.
3.1.2 contained air temperature, n—the temperature of the
air contained within the tire cavity when the tire is mounted
and inflated on the proper rim.
3.1.3 curved equivalent test severity, n—in tire testing, the
test conditions (load, rotational speed, tire inflation pressure)
on the flat or highway surface that will provide equivalent
internal tire temperatures, for example, at the belt edge, to a
known set of curved 1.707-m roadwheel surface test conditions.
4. Summary of Practice
3.1.4 endurance, n—of a tire, the ability of a tire to perform
as designed in its intended usage conditions such as load,
inflation pressure, speed, time, and environmental conditions.
4.1 This practice provides a procedure to determine the
1.707-m diameter roadwheel tire test conditions (speed, load,
and inflation pressure) for flat surface equivalent test severity.
It also enables the user to determine the 1.707-m diameter
roadwheel test conditions for a specific increase or decrease in
severity with respect to flat surface test severity. The converse
is also true, determining the flat surface test conditions that
provide equal test severity to a selected set of 1.707-m
diameter roadwheel test conditions.
3.1.5 high speed performance, n—of a tire, the rotational
speed capability of a tire to perform as designed in its intended
usage conditions such as load, inflation pressure, speed, time,
and environmental conditions.
3.1.6 highway equivalent test severity, n—in tire testing, the
test conditions (load, rotational speed, tire inflation pressure)
on the 1.707-m roadwheel that will provide equivalent internal
tire temperatures, for example, at the belt edge, to a known set
of highway or flat surface conditions.
4.2 This practice provides a prediction profiler procedure
(see Section 7 and Annex A1) to establish equivalent test
severity between a 1.707-m diameter rotating wheel (Practice
F551) and a flat surface, by adjusting test speed, load and
inflation pressure. The prediction profiler provides the ability
to identify numerous test conditions and resultant belt edge
temperature differentials within the confines of this practice as
described in Section 6.
3.1.7 light truck tire, n—a tire that has a LT prefix or suffix
in the tire size description: this indicates that the tire was
primarily intended for service on light trucks with gross vehicle
weights (GVWR) ≤4536 kg.
3.1.8 load range, n—of a light truck tire, a letter designation
(B, C, D, E) used to identify a given size tire with its load and
inflation limits when used in a specific type of service. F414,
F1922
4.3 Equivalent test severity is defined as the set of test
conditions (load, speed, and tire inflation pressure) that provide
equivalent steady state tire internal operating temperatures at
the belt edge (BE) for: (1) a conversion from flat surface
conditions to a 1.707-m diameter roadwheel conditions or (2)
a conversion from a 1.707-m diameter roadwheel conditions to
a flat surface conditions.2
3.1.9 maximum rated load, n—the load corresponding to a
maximum tire load capacity at the rated inflation pressure in
accordance with the publications of tire and rim standards
current at the time of manufacture.
3.1.10 measured inflation pressure, n—gauge pressure of a
tire measured at a given time under ambient temperature and
F538
barometric pressure.
5. Significance and Use
5.1 Historically, tires have been tested for endurance by a
variety of test methods. Some typical testing protocols have
been: (1) proving grounds or highway testing over a range of
speeds, loads, and inflations, (2) testing on fleets of vehicles for
extended periods of time, and (3) indoor (laboratory) testing of
tires loaded on a rotating 1.707-m diameter roadwheel;
however, the curved surface of a 1.707-m diameter roadwheel
results in a significantly different tire behavior from that
observed on a flat or highway surface.
5.1.1 This practice addresses the need for providing equivalent test severity over a range of typical tire operating conditions between a 1.707-m diameter roadwheel surface (Practice
F551) and a flat surface. There are different deformations of the
tire footprint on curved versus flat surfaces resulting in
different footprint mechanics, stress/strain cycles, and significantly different internal operating temperatures for the two
3.1.11 rated inflation pressure, n—the minimum cold inflation pressure specified at the maximum rated load of a tire in
accordance with the publications of tire and rim standards
current at the time of manufacture.
3.1.12 rim, n—specially shaped circular periphery to which
a tire may be mounted with appropriate bead fitment. F538
3.1.13 test inflation pressure, n—specified gauge pressure of
a tire mounted on a rim, measured at a given time under
ambient temperature and barometric pressure for evaluation
purposes.
3.1.14 test load, n—the force applied to a tire through the
rim; it is normal to the metal loading plate onto which the tire
F538
is loaded.
2
F2869 − 10 (2016)
running on a flat surface, that is, the targeted operating
difference in temperature between the roadwheel and highway
condition. By first identifying the desired “delta
temperature(s),” the user will be able to identify (via the
profilers) roadwheel test conditions to achieve the temperature
“delta(s).” The equivalency determination is based upon a
“delta” in rotational speed (km/h), % load, and/or % inflation
from the known highway operating conditions within the
limitations specified in Section 6.
7.1.2 The converse also applies for equivalent highway test
conditions that can be identified from specified roadwheel test
conditions by use of the curved-to-flat (CTF) prediction
profilers.
types of contact surface. Since tire internal temperatures are
key parameters influencing tire endurance or operating characteristics under typical use conditions, it is important to be
able to calculate internal temperature differentials between
curved and flat surfaces for a range of loads, inflation pressures
and rotational velocities (speeds).
5.2 Data from lab and road tire temperature measurement
trials were combined, statistically analyzed, and tire temperature prediction models derived.2
5.2.1 The fit of the models to the data is shown as the
coefficient of determination, R2, for the critical belt edge:
R2 = 0.90
Two Standard Deviations (2-sigma) = 3.2°C
(that is, 95 % of the variation from the means
is within 63.2°C)
5.2.2 These prediction models were used to develop the
prediction profilers outlined in Section 7 and Annex A1.
7.2 When using either the ‘FTC (or CTF) Delta DegC’
prediction profilers, three variables are available for interactive
modification:
Delta 1.7 m Dia RW KPH
6. Limitations
1.7 m Dia RW % Flat Surface
Inflation
6.1 The procedures as given are valid for radial pneumatic
LT tires up through load range E for the following ranges of
test speed, tire inflation pressure and test load, for flat test
surfaces and a 1.707-m diameter roadwheels:
6.1.1 Tire test speed in the range of 80 to 137 km/h (flat and
curved surface).
6.1.2 Tire test inflation pressure in the range of 50 to 110 %
of the inflation pressure associated with the maximum load
capacity of the tire, for example, sidewall stamped.
6.1.3 Tire test load in the range of 41 to 143 % of the
maximum load capacity of the tire, for example, sidewallstamped maximum rated load.
1.7 m Dia RW % Flat Surface
Load
The change in tire rotational speed
for the roadwheel relative to the
highway speed in km/h.
The percent change in roadwheel
tire inflation relative to the
highway tire inflation.
The percent change in roadwheel
tire load relative to the
highway tire load.
7.2.1 These variables appear along the x-axis of the prediction profiler and can be changed by clicking and dragging.
Effects of changing these variables can be viewed as temperature changes in the belt edge region identified on the y-axis as:
“LT BE Flat Surface to 1.7 m Dia RW Delta DegC”
7.3 The curved-to-flat (CTF) prediction y-axis is labeled
“LT BE 1.7 m Dia RW to Flat Surface Delta DegC” while the
x-axis are labeled from the perspective of identifying the
required changes from roadwheel conditions to flat conditions
in order to achieve the targeted severity levels on the flat
surface.
6.2 The procedures described in Section 7 determine
equivalent operating conditions between a flat surface and a
1.707-m diameter roadwheel by using empirical models to
match tire internal belt edge temperatures. These empirical
models are derived from a wide variety of tires tested within
the above ranges and can be used to interpolate at any
conditions within the constraints listed above. It is not recommended that the procedures be used for extrapolation beyond
the constraints listed above.
7.4 See Annex A1 for examples of prediction profilers
outputs.
7.5 Flat-to-Curved (FTC) Prediction Profiler – Macro Button (available on electronic copy or ASTM F09 site):
/>
7. Procedure
7.6 Curved-to-Flat Surface (CTF) Prediction Profiler –
Macro Button (available on electronic copy or ASTM F09
site):
/>
7.1 Equivalent Test Severity Prediction Profilers:
7.1.1 The flat-to-curved (FTC) prediction profilers are SAS
JMP interactive displays based on algorithms developed from
laboratory and highway tire temperature measurements. They
provide 1.707-m diameter roadwheel tire test (rotational)
speed, tire test load, and tire test inflation pressure conditions
for equivalent test severity (as well as for lesser or more severe
test severity) based upon the belt edge region temperatures.
Before using the profilers, the user will have targeted a
roadwheel “delta temperature” amount in degrees C for the tire
8. Keywords
8.1 curved to flat surface; endurance; equivalency; flat to
curved surface; high speed temperature; LT metric; highway
equivalent; radial light truck tire; roadwheel; roadwheel testing; test severity; tire; tire temperature; 67.23-in.; 1.707-m
3
F2869 − 10 (2016)
ANNEX
(Mandatory Information)
A1. PROCESS TO PREDICT EQUIVALENT TEST CONDITIONS AND PREDICTION PROFILER EXAMPLES
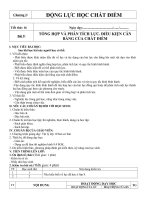
A1.2.3 Step 3—Move the load bar to the left to decrease the
belt edge temperature (y-axis) differential to approximately
zero.
A1.1 To obtain highway equivalent test severity on a
1.70.7-m diameter roadwheel based upon the operational
factors of tire rotational speed, tire load, and tire inflation
pressure:
A1.2.4 Step 4—For Equivalent Test Severity, it is desired to
have the belt edge temperature difference to be approximately
zero between the flat surface and the 1.707-m diameter
roadwheel. While keeping speed and inflation pressure equal to
the flat surface speed and inflation pressure, a reduction in load
of approximately 12.3 % from the flat surface load is required
to maintain equal belt edge temperatures in the transition from
a flat surface to the 1.707-m diameter roadwheel.
A1.1.1 A targeted severity level is first identified for the tire
on the curved surface, that is, tire internal temperature delta(s)
with respect to the same tire operated on a flat surface. For the
first example that follows, the targeted test severity level is for
the belt edge temperature as “equal to” (that is, Delta Deg C =
0). The prediction profilers have the capability to target a
specific “Deg C delta” increase or decrease as well. The
targeted severity level is based upon a known set of flat surface
operating conditions (tire load, tire rotational speed, tire
inflation pressure)
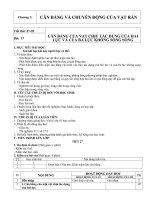
A1.3 Example #2—For any LT tire up through load range E
with a specified set of 1.707-m diameter roadwheel operating
conditions, predict the required flat surface inflation pressure
adjustment required for equivalent belt edge temperature while
keeping speed and load equal to the 1.707-m diameter roadwheel speed and load. The CTF prediction profiler yields the
following results. See Fig. A1.2.
A1.1.2 For the targeted severity level (for example, “equal
to”) based upon the known highway (flat) conditions, the
prediction profiler can determine the 1.707-m diameter road
wheel test conditions of tire test load, tire test rotational speed,
and tire test inflation pressure.
A1.1.3 This can be an iterative procedure to identify the
required 1.707-m diameter road wheel test conditions of tire
test load, tire test rotational speed, and tire test inflation
pressure by specifying two of the three variables and using the
profilers to identify the third, subject to the limitations specified in Section 6.
A1.3.1 Step 1—You will not move the speed bar because
you want to maintain the same speed on the flat surface that
you have on the 1.707-m diameter roadwheel, therefore, the
differential should be zero.
A1.3.2 Step 2—You will not move the load bar because you
want to maintain the same load on the flat surface that you have
on the 1.707-m diameter roadwheel, therefore, the differential
should be zero.
A1.2 Example #1—For any LT tire up through load range E
with a specified set of flat surface operating conditions, predict
the required 1.707-m diameter roadwheel load for equivalent
belt edge temperature while keeping speed and inflation
pressure equal to the flat surface speed and inflation pressure.
The FTC prediction profiler yields the following results. See
Fig. A1.1.
A1.3.3 Step 3—Move the inflation pressure bar to the left to
decrease the belt edge temperature (y-axis) differential to
approximately zero.
A1.3.4 Step 4—For Equivalent Test Severity, it is desired to
have the belt edge temperature difference to be approximately
zero between the 1.707-m diameter roadwheel and the flat
surface. While keeping speed and load equal to the 1.707-m
surface speed and load, a reduction in inflation pressure of
approximately 23.8 % from the 1.707-m surface inflation
pressure is required to maintain equal belt edge temperatures in
the transition from curved to flat
A1.2.1 Step 1—You will not move the speed bar because
you want to maintain the same speed on the 1.707-m diameter
roadwheel that you have on the flat surface, therefore, the
differential should be zero.
A1.2.2 Step 2—You will not move the inflation pressure bar
because you want to maintain the same inflation pressure on
the 1.707-m diameter roadwheel that you have on the flat
surface, therefore, the differential should be zero.
4
F2869 − 10 (2016)
FIG. A1.1 Flat-to-Curved Prediction Profiler Results
FIG. A1.2 Curved-to-Flat Prediction Profiler Results
5
F2869 − 10 (2016)
APPENDIXES
(Nonmandatory Information)
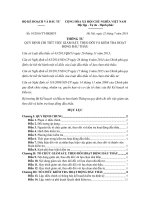
X1. MEASURED TIRE TEMPERATURE LOCATIONS
X1.1 Measured Tire Temperature Locations—As defined in
Section 3 (Terminology), the belt edge temperatures were
measured (and predicted when using the developed model(s))
at the locations as shown within the tire cross section in Fig.
X1.1.
NOTE X1.1—Shoulder and bead filler (at the top of rim flange) locations
were also included in the analysis. Of all of the internal tire temperature
locations, the belt edge consistently had the highest measured temperatures for all of the conditions tested after thermal equilibrium was
established.
FIG. X1.1 Thermocouple Locations for Internal Tire Temperature
Measurements
6
F2869 − 10 (2016)
X2. RATIONALE
tire performance and service life may be negatively impacted.
A properly maintained and operated tire will have temperatures
that do not result in significant thermal changes in the tire
material properties.
X2.1 A standard practice is needed to provide an industry
standard for radial light truck tire laboratory temperature
algorithms that equilibrate with highway (flat surface) operating temperatures and to determine equivalency for road versus
laboratory operating conditions. Users of the new standard are
expected to be government agencies, independent tire testing
labs, and tire manufacturers.
X2.5.5 Therefore, endurance testing is done by the tire
manufacturer as part of the evaluation of tire performance.
X2.5.6 Testing for endurance, like many other tire tests, is
usually performed in the laboratory on a 1.707-m diameter
rotating roadwheel. The tire is rotated under load and speed on
a surface that has a relatively high curvature compared to the
highway, where the surface is nearly flat. Due to this difference
in curvature between a flat surface and the roadwheel, several
tire effects are created and must be considered:
X2.5.6.1 A foreshortening of the tire contact patch (or
“footprint”) resulting in higher overall footprint contact pressures and tire stresses.
X2.5.6.2 A change in shape of the footprint itself; that is,
different from its optimal, flat surface shape that results
increases in the centerline contact pressure and tire stresses.
X2.5.6.3 An overdeflection of the tire sidewall due to the
reverse curvature of the footprint.
X2.5.6.4 An increase in the flex cycle severity.
X2.2 Therefore, it was necessary to develop the ASTM
standard practice so that radial light truck tire performance can
be evaluated through a standard industry method based upon
internal tire temperatures that have been predicted using the
algorithms developed by the radial light truck test development
task groups of ASTM F09 Tire Committee.
X2.3 This practice describes the process to identify equivalent test severity, 1.707-m diameter laboratory, roadwheel test
conditions for specific road operating conditions of load range
radial light truck (LT) through load range E used on vehicles
having a gross vehicle weight rating (GVWR) of ≤4536 kg.
X2.4 The standard refers to prediction profilers to determine
laboratory test conditions that provide equivalent tire temperatures for the belt edge region between curved (laboratory) and
flat (highway) test surfaces. The profilers are empiricallybased, linear-regression-modeling tools that are included
within this standard.2
X2.5.7 As a result, local heat generation rates increase and
tire temperature will often be significantly higher when the tire
is tested on the roadwheel compared to a tire used on the road
at the same load, inflation pressure and rotational speed.
X2.5 Radial Light Truck Tire Endurance Performance:
X2.5.8 Consequently, laboratory test conditions that are
equal to road conditions can result in end-of-test (EOT) events
that are not representative of typical highway tire removal
conditions. For example, thermal reversion manifested as tread
chunking, can be a laboratory EOT condition which is a
consequence of the testing method. In such cases, the test
termination does not correspond to what could have taken
place during normal on-vehicle use. Occurrence of such
non-representative EOT events effectively nullifies the validity
of the test and prevents an evaluation of the endurance issues
that may exist for the tire. Furthermore, if the test is required
for compliance qualifications, tires that may have excellent
endurance performance on the road can be removed prior to the
required test completion as a result of the non-representative
EOT event.
X2.5.1 Tire endurance performance is not only dependent
on the tire’s design but also on certain operating conditions
such as load, inflation pressure, and speed as well as the
environment in which the tire operates.
X2.5.2 In service, tires are subjected to a variety of conditions:
X2.5.2.1 Ambient temperatures can range from –20ºC to
over 40ºC.
X2.5.2.2 Highway speeds can rang fro 90 to 120 km/h.
X2.5.2.3 Vehicle tire loads can vary with respect to its gross
vehicle weight rating.
X2.5.2.4 Inflation pressure can range from the vehicle
manufacturer’s recommended inflation pressure, to the
sidewall-stamped inflation pressure, to a fleet service pressure,
or to something less due to service related conditions.
X2.5.9 Therefore, due to the significance of the tire operating conditions, e.g. speed, inflation pressure, and load on tire
performance, and the increased severity of testing on a curved
surface, it is critical to conduct laboratory roadwheel tire tests
using test conditions that reflect temperature equivalency to
specific road (flat surface) operating conditions if a meaningful
measure of tire endurance is to be achieved.
X2.5.3 Certain combinations of these operating conditions
can result in tires experiencing elevated temperatures when
operated under high loads, high speed or low inflation pressure
and have a bearing on tire performance and service life (1).4
X2.5.4 At highly elevated tire operating temperatures, thermally driven changes in tire material properties can occur and
X2.6 This standard practice describes the procedures of
using the flat-to-curved (FTC) prediction profiler to identify the
equivalent test severity conditions on a 1.707-m diameter
4
The boldface numbers in parentheses refer to the list of references at the end of
this standard.
7
F2869 − 10 (2016)
laboratory roadwheel from specific flat or highway operating
conditions for radial pneumatic light truck (LT) tires up
through load range E tires used on vehicles having a gross
vehicle weight rating (GVWR) of ≤4536 kg.
X2.7 The practice is applicable to the converse, as well, that
is, highway test conditions can be identified from specific
roadwheel test conditions by the curved-to-flat (CTF) prediction profiler.
REFERENCES
(1) Bennett, R. D. V., Ceato, H., Lake, G. J., Rollason, R. M., and
Pittman, G. A., “ Mechanisms of Heat Build-Up Failure in Tyres,”
International Rubber Conference, Kuala Lumpur, 1975, pp. 1–20.
(2) The Rubber Association of Canada, 2003 Tire Inflation and Maintenance Study Executive Summary.
(3) Laclair, T. and Zarak, C., “Truck tire Operating Temperatures on Flat
and Curved Test Surfaces,” Tire Science and Technology, Volume 33,
Issue 3, pp. 156–178, July 2004.
(4) Ruip, T., Walenga, G., Bokar, J., Spadone, L., “ASTM Truck Tire
Operating Temperatures–Curved vs. Flat Surfaces, ASTM Committee
F09 on Tires Truck/Bus Tire Test Development Task Group Phase I
Results,” SAE Commercial Vehicle Engineering Congress &
Exhibition, Chicago, IL, Oct. 31-Nov. 2, 2006.
(5) Bokar, J., “ Large Passenger and Light Truck Tire Operating Temperatures on Curved and Flat Endurance Testing Surfaces,” SAE
World congress & Exhibition, April 2006.
(6) Robinson, T., “ ASTM F09.30 Light Vehicle Equivalent Severity
Roadwheel Task Group,” 170th Technical Meeting of the Rubber
Division, American Chemical Society, Cincinnati, OH 2006, Paper
No. 19.
(7) Ruip, T., “ ASTM Truck/Bus Tire Test Development Task Group
Phase I Final Report,” DOT/NHTSA Docket–NHTSA-2002-1370710, September 2006 .
(8) Bokar, J. and Spadone, L., “Flat vs Curved Contact Surfaces Effect on
Consumer P-Metric-LT Tire Operating Temperatures”, Tire Society,
September 2007.
(9) The Tire and Rim Association Year Book (T&RA), The Tire and Rim
Association, Inc., 175 Montrose West Ave., Suite 150, Copley, OH
44321.
(10) E.T.R.T.O Standards Manual, The European Tyre and rim Technical
Organization, 32.2, Avenue Brugmann–B-106 Brussels, Belgium.
ASTM International takes no position respecting the validity of any patent rights asserted in connection with any item mentioned
in this standard. Users of this standard are expressly advised that determination of the validity of any such patent rights, and the risk
of infringement of such rights, are entirely their own responsibility.
This standard is subject to revision at any time by the responsible technical committee and must be reviewed every five years and
if not revised, either reapproved or withdrawn. Your comments are invited either for revision of this standard or for additional standards
and should be addressed to ASTM International Headquarters. Your comments will receive careful consideration at a meeting of the
responsible technical committee, which you may attend. If you feel that your comments have not received a fair hearing you should
make your views known to the ASTM Committee on Standards, at the address shown below.
This standard is copyrighted by ASTM International, 100 Barr Harbor Drive, PO Box C700, West Conshohocken, PA 19428-2959,
United States. Individual reprints (single or multiple copies) of this standard may be obtained by contacting ASTM at the above
address or at 610-832-9585 (phone), 610-832-9555 (fax), or (e-mail); or through the ASTM website
(www.astm.org). Permission rights to photocopy the standard may also be secured from the Copyright Clearance Center, 222
Rosewood Drive, Danvers, MA 01923, Tel: (978) 646-2600; />
8