Supermarket pricing
Bạn đang xem bản rút gọn của tài liệu. Xem và tải ngay bản đầy đủ của tài liệu tại đây (833.26 KB, 18 trang )
Vol. 27, No. 5, September–October 2008, pp. 811–828
issn 0732-2399 eissn 1526-548X 08 2705 0811
inf
orms
®
doi 10.1287/mksc.1080.0398
©2008 INFORMS
Supermarket Pricing Strategies
Paul B. Ellickson
Department of Economics, Duke University, Durham, North Carolina 27708,
Sanjog Misra
William E. Simon School of Business Administration, University of Rochester,
Rochester, New York 14627,
M
ost supermarket firms choose to position themselves by offering either everyday low prices (EDLP) across
several items or offering temporary price reductions (promotions) on a limited range of items. While
this choice has been addressed from a theoretical perspective in both the marketing and economic literature,
relatively little is known about how these decisions are made in practice, especially within a competitive envi-
ronment. This paper exploits a unique store level data set consisting of every supermarket operating in the
United States in 1998. For each of these stores, we observe the pricing strategy the firm has chosen to follow,
as reported by the firm itself. Using a system of simultaneous discrete choice models, we estimate each store’s
choice of pricing strategy as a static discrete game of incomplete information. In contrast to the predictions of
the theoretical literature, we find strong evidence that firms cluster by strategy by choosing actions that agree
with those of its rivals. We also find a significant impact of various demographic and store/chain characteristics,
providing some qualified support for several specific predictions from marketing theory.
Key words: EDLP; promotional pricing; positioning strategies; supermarkets; discrete games
History: Received: March 22, 2006; accepted: February 27, 2008; processed by David Bell.
1. Introduction
While firms compete along many dimensions, pricing
strategy is clearly one of the most important. In many
retail industries, pricing strategy can be characterized
as a choice between offering relatively stable prices
across a wide range of products (often called every-
day low pricing) or emphasizing deep and frequent
discounts on a smaller set of goods (referred to as
promotional or PROMO pricing). Although Wal-Mart
did not invent the concept of everyday low pricing,
the successful use of everyday low pricing (EDLP)
was a primary factor in their rapid rise to the top
of the Fortune 500, spawning a legion of followers
selling everything from toys (Toys
R
Us) to building
supplies (Home Depot). In the 1980s, it appeared that
the success and rapid diffusion of the EDLP strategy
could spell the end of promotions throughout much
of retail. However, by the late 1990s, the penetration
of EDLP had slowed, leaving a healthy mix of firms
following both strategies, and several others employ-
ing a mixture of the two.
Not surprisingly, pricing strategy has proven to be
a fruitful area of research for marketers. Marketing
scientists have provided both theoretical predictions
and empirical evidence concerning the types of con-
sumers that different pricing policies are likely to
attract (e.g. Lal and Rao 1997, Bell and Lattin 1998).
While we now know quite a bit about where a person
is likely to shop, we know relatively little about how
pricing strategies are chosen by retailers. There are
two primary reasons for this. First, these decisions
are quite complex: managers must balance the pref-
erences of their customers and their firm’s own capa-
bilities against the expected actions of their rivals.
Empirically modeling these actions (and reactions)
requires formulating and then estimating a complex
discrete game, an exercise which has only recently
become computationally feasible. The second is the
lack of appropriate data. While scanner data sets
have proven useful for analyzing consumer behavior,
they typically lack the breadth necessary for tack-
ling the complex mechanics of inter-store competi-
tion.
1
The goal of this paper is to combine newly
developed methods for estimating static games with
a rich, national data set on store level pricing poli-
cies to identify the primary factors that drive pricing
behavior in the supermarket industry.
Exploiting the game theoretic structure of our
approach, we aim to answer three questions that
have not been fully addressed in the existing liter-
ature. First, to what extent do supermarket chains
tailor their pricing strategies to local market condi-
tions? Second, do certain types of chains or stores
1
Typical scanner data usually reflect decisions made by only a few
stores in a limited number of markets.
811
Ellickson and Misra: Supermarket Pricing Strategies
812
Marketing Science 27(5), pp. 811–828, ©2008 INFORMS
have advantages when it comes to particular pricing
strategies? Finally, how do firms react to the expected
actions of their rivals? We address each of these ques-
tions in detail.
The first question naturally invites a market pull
driven explanation in which consumer demographics
play a key role in determining which pricing strategy
firms choose. In answering this question, we also
aim to provide additional empirical evidence that will
inform the growing theoretical literature on pricing
related games. Since we are able to assess the impact
of local demographics at a much broader level than
previous studies, our results provide more conclusive
evidence regarding their empirical relevance.
The second question concerns the match between
a firm’s strategy and its chain-specific capabilities.
In particular, we examine whether particular pricing
strategies (e.g., EDLP) are more profitable when firms
make complementary investments (e.g. larger stores
and more sophisticated distribution systems). The
empirical evidence on this matter is scant—this is the
first paper to address this issue on a broad scale. Fur-
thermore, because our data set includes all existing
supermarkets, we are able to exploit variation both
within and across chains to assess the impact of store
and chain level differences on the choice of pricing
strategy.
Finally, we address the role of competition posed
in our third question by analyzing firms’ reactions
to the expected choices of their rivals. In particular,
we ask whether firms face incentives to distinguish
themselves from their competitors (as in most models
of product differentiation) or instead face pressures
to conform (as in network or switching cost mod-
els)? This question is the primary focus of our paper
and the feature that most distinguishes it from earlier
work.
Our results shed light on all three questions. First,
we find that consumer demographics play a signifi-
cant role in the choice of local pricing strategies: firms
choose the policy that their consumers demand. Fur-
thermore, the impact of these demographic factors
is consistent with both the existing marketing liter-
ature and conventional wisdom. For example, EDLP
is favored in low income, racially diverse markets,
while PROMO clearly targets the rich. However, a key
implication of our analysis is that these demographic
factors act as a coordinating device for rival firms,
helping shape the pricing landscape by defining an
equilibrium correspondence. Second, we find that
complementary investments are key: larger stores
and vertically integrated chains are significantly more
likely to adopt EDLP. Finally, and most surprisingly,
we find that stores competing in a given market have
incentives to coordinate their actions. Rather than
choosing a pricing strategy that distinguishes them
from their rivals, stores choose strategies that match.
This finding is in direct contrast to existing theoretical
models that view pricing strategy as a form of dif-
ferentiation, providing a clear comparative static that
future pricing models must address.
Our paper makes both substantive and method-
ological contributions to the marketing literature. On
the substantive front, our results offer an in-depth
look at the supermarket industry’s pricing practices,
delineating the role of three key factors (demand,
supply, and competition) on the choice of pricing
strategy. We provide novel, producer-side empiri-
cal evidence that complements various consumer-side
models of pricing strategy. In particular, we find qual-
ified support for several claims from the literature
on pricing demographics, including Bell and Lattin’s
(1998) model of basket size and Lal and Rao’s (1997)
positioning framework, while at the same time high-
lighting the advantages of chain level investment.
Our focus on competition also provides a structural
complement to Shankar and Bolton’s (2004) descrip-
tive study of price variation in supermarket scanner
data, which emphasized the role of rival actions. Our
most significant contribution, however, is demonstrat-
ing that stores in a particular market do not use pric-
ing strategy as a differentiation device but instead
coordinate their actions. This result provides a direct
challenge to the conventional view of retail compe-
tition, opening up new and intriguing avenues for
future theoretical research. Our econometric imple-
mentation also contributes to the growing literature in
marketing and economics on the estimation of static
discrete games, as well as the growing literature on
social interactions.
2
In particular, our incorporation of
multiple sources of private information and our con-
struction of competitive beliefs are novel additions to
these emerging literatures.
The rest of the paper is organized as follows. Sec-
tion 2 provides an overview of the pricing landscape,
explicitly defining each strategy and illustrating the
importance of local factors in determining store level
decisions. Section 3 introduces our formal model of
pricing strategy and briefly outlines our estimation
approach. Section 4 describes the data set. Section 5
provides the details of how we implement the model,
including the construction of distinct geographic mar-
kets, the selection of covariates, our two-step estima-
tion method, and our identification strategy. Section 6
2
Recent applications of static games include technology adop-
tion by internet service providers (Augereau et al. 2006), prod-
uct variety in retail eyewear (Watson 2005), location of ATM
branches (Gowrisankaran and Krainer 2004), and spatial differenti-
ation among supermarkets (Orhun 2005), discount stores (Zhu et al.
2005), and video stores (Seim 2006). Structural estimation of social
interactions is the focus of papers by Brock and Durlauf (2002),
Bayer and Timmins (2006), and Bajari et al. (2005).
Ellickson and Misra: Supermarket Pricing Strategies
Marketing Science 27(5), pp. 811–828, ©2008 INFORMS
813
provides our main empirical results and discusses
their implications. Section 7 concludes with directions
for future research.
2. The Supermarket Pricing
Landscape
2.1. Pricing Strategy Choices
Competition in the supermarket industry is a complex
phenomenon. Firms compete across the entire retail
and marketing mix, enticing customers with an attrac-
tive set of products, competitive prices, convenient
locations, and a host of other services, features, and
promotional activities. In equilibrium, firms choose
the bundle of services and features that maximize
profits, conditional on the types of consumers they
expect to serve and their beliefs about the actions of
their rivals. A supermarket’s pricing strategy is a key
element in this multidimensional bundle.
The majority of both marketers and practitioners
frame a store’s pricing decision as a choice between
offering everyday low prices or deep but tempo-
rary discounts, labeling the first strategy EDLP and
the second PROMO (Table 1).
3 4
Not surprisingly,
the simple EDLP-PROMO dichotomy is too narrow
to adequately capture the full range of firm behav-
ior. In practice, firms can choose a mixture of EDLP
and PROMO, varying either the number of categories
they put on sale or changing the frequency of sales
across some or all categories of products. Practitioners
have coined a term for these practices—hybrid pric-
ing. What constitutes HYBRID pricing is necessarily
subjective, depending on an individual’s own beliefs
regarding how much price variation constitutes a
departure from pure EDLP. Both the data and defini-
tions used in this paper are based on a specific store
level survey conducted by Trade Dimensions in 1998,
3
This is clearly a simplification—a supermarket’s pricing policy
is closely tied to its overall positioning strategy. Pricing strategies
are typically chosen to leverage particular operational advantages
and often have implications for other aspects of the retail mix. For
example, successful implementation of EDLP may involve offering
a deeper and narrower product line than PROMO, allowing firms
to exploit scale economies (in particular categories), reduce their
inventory carrying costs, and lower their advertising expenses. On
the other hand, PROMO pricing gives firms greater flexibility in
clearing overstock, allows them to quickly capitalize on deep man-
ufacturer discounts, and facilitates the use of consumer loyalty pro-
grams (e.g. frequent shopper cards). In other words, the choice of
pricing strategy is more than just how prices are set: it reflects the
overall positioning of the store. This paper focuses on the pricing
dimension alone, taking the other aspects of the retail mix as given.
While this is limiting, modeling the entire retail mix is beyond the
scope of this paper.
4
Note that we focus on the choice of pricing strategy and abstract
away from issues related to more tactical decisions about how prices
are (or should be) set (see e.g., Kumar and Rao 2006).
Table 1 Descriptive Statistics
Variable Obs Mean Std. dev. Min. Max
Strategy
EDLP 17388 028 045 0 1
HYBRID 17388 038 048 0 1
PROMO 17388 034 047 0 1
MSA characteristics
Size (sq. miles) 333 186831 194399 4640 112296
Density (pop ’000 333 1042 962 091 4906
per sq. mile)
Avg. food expenditure 333 66364 120137 1604 958209
($ ’000)
Market variables
Median household size 8000 266 035 132 569
Median HH income 8000 3525559 975395 1810960 8195460
Proportion Black 8000 008 014 000 097
Proportion Hispanic 8000 006 013 000 098
Median vehicles in HH 8000 212 033 056 337
Chain/store characteristics
Vertically integrated 17388 051 050 000 100
Store size (sqft ’000) 17388 2899 1634 200 25000
Independent store 17388 023 042 000 100
Number of stores 804 39015 47845 100 139900
in chain
which asked individual store managers to choose
which of the following categories best described their
store’s pricing policy:
• Everyday LowPrice (EDLP): Little reliance on
promotional pricing strategies such as temporary
price cuts. Prices are consistently low across the
board, throughout all packaged food departments.
• Promotional (Hi-Lo) Pricing: Heavy use of spe-
cials, usually through manufacturer price breaks or
special deals.
• Hybrid EDLP/Hi-Lo: Combination of EDLP and
Hi-Lo pricing strategies.
According to Trade Dimensions, the survey was
designed to allow for a broad interpretation of the
HYBRID strategy, as they wanted it to capture devia-
tions along either the temporal (i.e., number of sales
per year) or category based dimensions (i.e., number
of categories on deal). We believe that pricing strat-
egy is best viewed as a continuum, with pure EDLP
(i.e., constant margins across all categories) on one
end and pure PROMO (i.e. frequent sales on all cate-
gories) at the other. This data set represents a coarse
discretization of that continuum.
2.2. Supermarket Pricing: A Closer Look
Without observing data on individual stores, it might
be tempting to conclude that all pricing strategies are
determined at the level of the chain. While there are
certainly incentives to choose a consistent policy, the
data reveals a remarkable degree of local heterogene-
ity. To examine the issue more closely, we focus in on
a single chain in a single market: the Pathmark chain
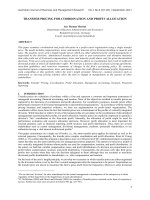
in New Jersey. Figure 1 shows the spatial locations of
Ellickson and Misra: Supermarket Pricing Strategies
814
Marketing Science 27(5), pp. 811–828, ©2008 INFORMS
Figure 1 Pathmark Stores in New Jersey
41.0
40.5
39.5
39.0
–75.5 –75.0 –74.5 –74.0
EDLP
HYBRID
PROMO
40.0
every Pathmark store in New Jersey, along with its
pricing strategy. Two features of the data are worth
emphasizing. We address them in sequence.
First, Pathmark does not follow a single strategy
across its stores: 42% of the stores use PROMO pric-
ing, 33% follow EDLP, and the remaining 25% use
HYBRID. The heterogeneity in pricing strategy
observed in the Pathmark case is not specific to this
particular chain. Table 2 shows the store level strate-
gies chosen by the top 15 U.S. supermarkets (by
total volume) along with their total store counts. As
with Pathmark, the major chains are also surprisingly
heterogeneous. While some firms do have a clear
focus (e.g. Wal-Mart, H.E. Butt, Stop & Shop), oth-
ers are more evenly split (e.g. Lucky, Cub Foods).
This pattern extends to the full set of firms. Table 3
shows the pricing strategies chosen by large and
Table 2 Pricing Strategies of the Top 15 Supermarkets
Firm Stores % PROMO % HYBRID % EDLP
Kroger 1399 47 40 13
Safeway 1165 52 43 5
Albertson’s 922 11 41 48
Winn-Dixie 1174 3 30 67
Lucky 813 35 38 27
Giant 711 29 60 11
Fred Meyer 821 22 60 18
Wal-Mart 487 1 26 73
Publix 581 13 71 16
Food Lion 1186 2 12 86
A&P 698 55 30 15
H.E. Butt 250 1 3 96
Stop & Shop 189 50 43 7
Cub foods 375 26 34 40
Pathmark 135 42 25 33
Table 3Pricing Strategy by Firm Type
% EDLP % HYBRID % PROMO
“Large” firms:
Chain 33 37 30
Vertically integrated 35 36 29
Large store size 32 38 30
Many checkouts 31 39 30
“Small” firms:
Independent 22 28 50
Not vertically integrated 21 32 47
Small store size 23 26 52
Few checkouts 22 26 52
small chains, using four alternative definitions of
“large” and small.
5
While large chains seem evenly
distributed across the strategies and “small” chains
seem to favor PROMO, firm size is not the primary
determinant of pricing strategy.
The second noteworthy feature of the Pathmark
data is that even geographically proximate stores
adopt quite different pricing strategies. While there is
some clustering at the broader spatial level (e.g. north
versus south New Jersey), the extent to which these
strategies are interlaced is striking. Again, looking
beyond Pathmark and New Jersey confirms that this
within-chain spatial heterogeneity is not unique to
this particular example: while some chains clearly
favor a consistent strategy, others appear quite
responsive to local factors. Broadly speaking, the
data reveal only a weak relationship between geog-
raphy and pricing strategy. While southern chains
such as Food Lion are widely perceived to favor
EDLP and Northeastern chains like Stop & Shop are
thought to prefer PROMO, regional variation does
not capture the full story. Table 4 shows the per-
cent of stores that choose either EDLP, HYBRID, or
PROMO pricing in eight geographic regions of the
United States. While PROMO pricing is most popular
in the Northeast, Great Lakes, and central Southern
regions, it is far from dominant, as both the EDLP and
HYBRID strategies enjoy healthy shares there as well.
EDLP is certainly favored in the South and Southeast,
but PROMO still draws double digit shares in both
regions. This heterogeneity in pricing strategy can
be illustrated using the spatial structure of our data
set. Figure 2 plots the geographic location of every
store in the United States, along with their pricing
5
The four definitions of firm size are: chain/independent, vertically
integrated and not, large/small store, and many/few checkouts.
A chain is defined as having 11 or more stores, while an indepen-
dent has 10 of fewer. Vertically integrated means the firm operates
its own distribution centers. Large versus small store size and many
versus few checkouts are defined by the upper and lower quartiles
of the full store level census.
Ellickson and Misra: Supermarket Pricing Strategies
Marketing Science 27(5), pp. 811–828, ©2008 INFORMS
815
Table 4 Pricing Strategies by Region
Region % PROMO % HYBRID % EDLP
West Coast 39 39 22
Northwest 32 51 17
South West 20 48 32
South 32 25 43
Southern Central 45 27 28
Great Lakes 54 29 17
North East 40 37 23
South East 23 37 40
strategy. As is clear from the three panels correspond-
ing to each pricing strategy, there is no obvious pat-
tern: all three strategies exhibit quite uniform cover-
age. Taken together, these observations suggest look-
ing elsewhere for the primary determinants of pricing
Figure 2 Spatial Distribution of Store Pricing Strategy
HYBRID stores
EDLP stores
PROMO stores
Table 5 Local Factors
EDLP HYBRID PROMO
Local demographics
Median household 284 (0.331) 281 (0.337) 280 (0.329)
size
Median household 34,247 (14,121) 36,194 (15,121) 36,560 (16,401)
income
Median vehicles 212 (0.302) 213 (0.303) 209 (0.373)
in HH
Median age 354 (4.59) 358 (4.98) 357 (4.25)
Proportion Black 0128 (0.182) 0092 (0.158) 0110 (0.185)
Proportion Hispanic 0078 (0.159) 0073 (0.137) 0070 (0.135)
Strategies of rivals
Percent of rivals using 49 (31) 49 (25) 52 (23)
same strategy
Note. The main numbers in each cell are means, standard deviations are in
parentheses.
strategy. We turn next to the role of market demo-
graphics and then to the nature and degree of com-
petition.
Table 5 contains the average demographic char-
acteristics of the local market served by stores of
each type.
6
PROMO pricing is associated with smaller
households, higher income, fewer automobiles per
capita, and less racial diversity, providing some ini-
tial support for Bell and Lattin’s (1998) influen-
tial model of basket size.
7
However, the differences
in demography, while intuitive, are not especially
strong. This does not mean that demographics are
irrelevant, but rather that the aggregate level patterns
linking pricing strategy and demographics are not
overwhelming. Isolating the pure impact of demo-
graphic factors will require a formal model, which we
provide below.
The final row of Table 5 contains the share of rival
stores in the competing market that employ the same
strategy as the store being analyzed. Here we find a
striking result: 50% of a store’s rivals in a given loca-
tion employ the same pricing strategy as the focal
store. Competitor factors also played a lead role in
the work of Shankar and Bolton (2004), which ana-
lyzed pricing variability in supermarket scanner data.
In particular, they note that “what is most striking,
however, is that the competitor factors are the most
dominant determinants of retailer pricing in a broad
framework that included several other factors” (p. 43).
Even at this rather coarse level of analysis, the data
6
Roughly corresponding to areas the size of a ZipCode, these “local
markets” are defined explicitly in §5.2.
7
Bell and Lattin (1998) find that the most important features of
shopping behavior can be captured by two interrelated choices:
basket size (how much you buy) and shopping frequency (how
often you go). They suggest that large or fixed basket shoppers
(i.e. those who buy more and shop less) will more sensitive to
the overall basket price than those who shop frequently and will
therefore prefer EDLP pricing to PROMO. They present empirical
evidence that is consistent with this prediction.
Ellickson and Misra: Supermarket Pricing Strategies
816
Marketing Science 27(5), pp. 811–828, ©2008 INFORMS
reveal that most stores choose similar pricing strate-
gies to their rivals. This pattern clearly warrants a
more detailed investigation and is the focus of our
structural model.
Stepping back, three key findings emerge. First, su-
permarket chains often adopt heterogeneous pricing
strategies, suggesting that demand related forces can
sometimes outweigh the advantages of chain level
specialization. Second, local market factors play a key
role in shaping demand characteristics. Finally, any
empirical analysis of pricing strategy must address
the role of competition. While investigating the role
of market demographics and firm characteristics is
not conceptually difficult, quantifying the structural
impact of rival pricing strategies on firm behavior
requires a formal game theoretic model of pricing
behavior that accounts for the simultaneity of choices.
In the following section, we embed pricing strategy
in a discrete game that accommodates both local
demographics and the strategies of rival firms. We
then estimate this model using the two-step approach
developed by Bajari et al. (2005).
3. A Strategic Model of
Supermarket Pricing
A supermarket’s choice of pricing strategy is natu-
rally framed as a discrete game between a finite set
of players. Each firm’s optimal choice is determined
by the underlying market conditions, its own charac-
teristics and relative strengths, as well as its expecta-
tions regarding the actions of its rivals. Ignoring strate-
gic expectations, pricing strategy could be modeled as
a straightforward discrete choice problem. However,
since firms condition their strategies on their beliefs
regarding rivals’ actions, this discrete choice must be
modeled as a system of simultaneous equations. In
our framework, firms (i.e., supermarket chains
8
) make
a discrete choice of pricing strategy, selecting among
three alternatives: everyday low pricing, promotional
pricing, and a hybrid strategy. While there is clearly
a role for dynamics in determining an optimal pric-
ing policy, we assume that firms act simultaneously in
a static environment, taking entry decisions as given.
This static treatment of competition is not altogether
unrealistic since these pricing strategies involve sub-
stantial store level investments in communication and
positioning related costs that are not easily reversed.
9
We assume that competition takes place in “local”
markets, each contained in a global market (here, an
8
Henceforth, we will use chains and firms interchangeably.
9
As discussed above, pricing decisions are relatively sunk, due to
the positioning costs associated with conveying a consistent store-
level message to a group of repeat customers. Furthermore, since
this is not an entry game, we are not particularly concerned about
the possibility of ex post regret that can sometimes arise in static
games (Einav 2003).
MSA). Before proceeding further, we must introduce
some additional notation. Stores belonging to a given
chain c = 1C, that are located in a local mar-
ket l
m
= 1L
m
,inanMSAm = 1M, will be
indexed using i
l
m
c
= 1N
l
m
c
. The total number
of stores in a particular chain in a given MSA is
N
m
c
=
L
m
l
m
=1
N
l
m
c
, while the total number of stores
in that chain across all MSAs is N
c
=
M
m=1
N
m
c
.In
each local market, chains select a pricing strategy
(action) a from the three element set K = EHP,
where E ≡ EDLP, H ≡ HYBRID, and P ≡ PROMO.
If we observe a market l
m
containing N
l
m
=
C
c=1
N
l
m
c
players for example, the set of possible action pro-
files is then A
l
m
= EHP
N
l
m
c
with generic element
a
l
m
= a
1
a
2
a
i
l
m
c
a
N
l
m
c
. The vector of actions of
store i
l
m
c
’s competitors is denoted a
−i
l
m
c
= a
1
a
i
l
m
c
−1
a
i
l
m
c
+1
a
N
l
m
c
.
In a given market, a particular chain’s state vec-
tor is denoted s
m
c
∈ S
m
c
, while the state vector for the
market as a whole is s
m
= s
m
1
s
m
N
c
∈
N
m
c
c=1
S
m
c
. The
state vector s
m
is known to all firms and observed by
the econometrician. It describes features of the mar-
ket and characteristics of the firms that we assume
are determined exogenously. For each firm, there are
also three unobserved state variables (corresponding
to the three pricing strategies) that are treated as
private information of the firm. These unobserved
state variables are denoted
i
l
m
c
a
i
l
m
c
, or more com-
pactly
i
l
m
c
, and represent firm specific shocks to the
profitability of each strategy. The private informa-
tion assumption makes this a game of incomplete
or asymmetric information (e.g. Harsanyi 1973) and
the appropriate equilibrium concept one of Bayesian
Nash Equilibrium (BNE). For any given market, the
i
l
m
c
’s are assumed to be i.i.d. across firms and actions,
and drawn from a distribution f
i
l
m
c
that is known
to everyone, including the econometrician.
Firms maximize store-level profits, choose pricing
strategies independently across stores. In market l
m
,
the profit earned by store i
c
is given by
i
l
m
c
=
i
l
m
c
s
m
a
i
l
m
c
a
−i
l
m
c
+
i
l
m
c
(1)
where
i
l
m
c
is a known and deterministic function of
states and actions (both own and rival’s). Since the
’s are private information, each firm’s decision rule
a
i
l
m
c
= d
i
l
m
c
s
m
i
l
m
c
is a function of the common state
vector and its own , but not the private information
of its rivals. From the perspective of both its rivals
and the econometrician, the probability that a given
firm chooses action k conditional on the common state
vector is then given by
P
i
l
m
c
a
i
l
m
c
= k
=
1
d
i
l
m
c
s
m
i
l
m
c
= k
f
i
l
m
c
d
i
l
m
c
(2)
where 1d
i
l
m
c
s
i
l
m
c
= k is an indicator function equal
to 1 if store i
l
m
c
chooses action k and 0 otherwise.
Ellickson and Misra: Supermarket Pricing Strategies
Marketing Science 27(5), pp. 811–828, ©2008 INFORMS
817
We let P
l
m
denote the set of these probabilities for a
given local market. Since the firm does not observe its
competitors actions prior to choosing its own action,
it makes decisions based on its expectations. The
expected profit for firm i
l
m
c
from choosing action a
i
l
m
c
is then
i
l
m
c
a
i
l
m
c
s
m
i
P
l
m
=
i
l
m
c
a
i
l
m
c
s
m
+
i
l
m
c
(3)
=
a
−i
l
m
c
i
l
m
c
s
m
a
i
l
m
c
a
−i
l
m
c
P
−i
l
m
c
+
i
l
m
c
(4)
where P
−i
l
m
c
=
j=i
l
m
c
P
j
a
j
s
m
. Given these expected
profits, the optimal action for a store is then
i
l
m
c
= Pr
i
l
m
c
a
i
l
m
c
s
m
+
i
l
m
c
a
i
l
m
c
>
i
l
m
c
a
i
l
m
c
s
m
+
i
l
m
c
a
i
l
m
c
∀ a
i
l
m
c
= a
i
l
m
c
(5)
which is the system of equations that define the (pure
strategy) BNE of the game. Because a firm’s optimal
action is unique by construction, there is no need to
consider mixed strategies.
If the ’s are drawn from a Type I Extreme Value
distribution, this BNE must satisfy a system of logit
equations (i.e. best response probability functions).
The general framework described above has been
applied in several economic settings and its properties
are well understood. Existence of equilibrium follows
directly from Brouwer’s fixed point theorem.
To proceed further, we need to choose a particular
specification for the expected profit functions. We will
assume that the profit that accrues to store i
l
m
c
from
choosing strategy k in location l
m
is given by
i
l
m
c
a
i
l
m
c
=ks
m
i
P
l
m
= s
m
k
+
E
−i
l
m
c
k1
+
P
−i
l
m
c
k2
+
m
c
k+
c
k+
i
l
m
c
k (6)
where s
m
is the common state vector of both market
(local and MSA) and firm characteristics (chain and
store level). The
E
−i
l
m
c
and
P
−i
l
m
c
terms represent the
expected proportion of a store’s competitors in mar-
ket l
m
that choose EDLP and PROMO strategies,
respectively
k
−i
l
m
c
=
1
N
l
m
j=i
l
m
c
P
j
a
j
= k
Note that we have assumed that payoffs are a lin-
ear function of the share of stores that choose EDLP
and PROMO, which simplifies the estimation prob-
lem and eliminates the need to consider the share
who choose HYBRID H. We further normalize the
average profit from the PROMO strategy to zero, one
of three assumptions required for identification (we
discuss our identification strategy in detail in §5.7).
In addition, we have assumed that the private infor-
mation available to store i
l
m
c
(i.e.
i
l
m
c
) can be decom-
posed into three additive stochastic components
i
l
m
c
k =
m
c
k +
c
k +
i
l
m
c
k (7)
where
i
l
m
c
k represents local market level private
information,
m
c
k is the private information that
a chain possesses about a particular global market
(MSA), and
c
k is a nonspatial component of pri-
vate information that is chain specific. Following our
earlier discussion, we assume that
i
l
m
c
k is an i.i.d.
Gumbel error. We further assume that the two remain-
ing components are jointly distributed with distribu-
tion function F
m
c
k
c
k , where is a set of
parameters associated with F . Denoting the parameter
vector = and letting
i
l
m
c
k be an indicator
function such that
i
l
m
c
k =
1ifa
i
l
m
c
= k
0ifa
i
l
m
c
= k
(8)
the optimal choice probabilities (conditional on
m
c
k
c
k) for a given store can be written as
i
l
m
c
a
i
l
m
c
=k P
l
m
X
m
c
k
c
k
=
exp
s
m
k
+
E
−i
l
m
c
k1
+
P
−i
l
m
c
k2
+
m
c
k+
c
k
k
∈EHP
exp
s
m
k
+
E
−i
l
m
c
k
1
+
P
−i
l
m
c
k
2
+
m
c
k
+
c
k
(9)
while the likelihood can be constructed as
c∈C
c
k
m∈M
m
c
k
l
m
∈L
m
i
l
m
c
∈N
l
m
c
i
l
m
c
a
i
l
m
c
= k P
l
m
s
m
c
k
c
k
i
l
m
c
k
dF
m
c
k
c
k
s.t. P
l
m
=
l
m
P
l
m
s
m
c
k
c
k
(10)
Note that the construction of the likelihood involves
a system of discrete choice equations that must sat-
isfy a fixed point constraint P
l
m
=
l
m
. There are two
main approaches for dealing with the recursive struc-
ture of this system, both based on methods originally
applied to dynamic discrete choice problems. The first,
based on Rust’s (1987) Nested Fixed Point (NFXP)
algorithm, involves solving for the fixed point of the
system at every candidate parameter vector and then
using these fixed point probabilities to evaluate the
likelihood. However, the NFXP approach is both com-
putationally demanding and straightforward to apply