analysis services data mining _ môn data mining
Bạn đang xem bản rút gọn của tài liệu. Xem và tải ngay bản đầy đủ của tài liệu tại đây (1.32 MB, 215 trang )
SQL Server 2012 Tutorials:
Analysis Services - Data Mining
SQL Server 2012 Books Online
Summary: Microsoft SQL Server Analysis Services makes it easy to create sophisticated
data mining solutions. The step-by-step tutorials in the following list will help you learn
how to get the most out of Analysis Services, so that you can perform advanced analysis
to solve business problems that are beyond the reach of traditional business intelligence
methods.
Category: Step-by-Step
Applies to: SQL Server 2012
Source: SQL Server Books Online (link to source content)
E-book publication date: June 2012
Copyright © 2012 by Microsoft Corporation
All rights reserved. No part of the contents of this book may be reproduced or transmitted in any form or by any means
without the written permission of the publisher.
Microsoft and the trademarks listed at
are trademarks of the
Microsoft group of companies. All other marks are property of their respective owners.
The example companies, organizations, products, domain names, email addresses, logos, people, places, and events
depicted herein are fictitious. No association with any real company, organization, product, domain name, email address,
logo, person, place, or event is intended or should be inferred.
This book expresses the author’s views and opinions. The information contained in this book is provided without any
express, statutory, or implied warranties. Neither the authors, Microsoft Corporation, nor its resellers, or distributors will
be held liable for any damages caused or alleged to be caused either directly or indirectly by this book.
Contents
Data Mining Tutorials (Analysis Services) 5
Basic Data Mining Tutorial 6
Lesson 1: Preparing the Analysis Services Database (Basic Data Mining Tutorial) 8
Creating an Analysis Services Project (Basic Data Mining Tutorial) 9
Creating a Data Source (Basic Data Mining Tutorial) 10
Creating a Data Source View (Basic Data Mining Tutorial) 11
Lesson 2: Building a Targeted Mailing Structure (Basic Data Mining Tutorial) 12
Creating a Targeted Mailing Mining Model Structure (Basic Data Mining Tutorial) 13
Specifying the Data Type and Content Type (Basic Data Mining Tutorial) 16
Specifying a Testing Data Set for the Structure (Basic Data Mining Tutorial) 17
Lesson 3: Adding and Processing Models 18
Adding New Models to the Targeted Mailing Structure (Basic Data Mining Tutorial) 19
Processing Models in the Targeted Mailing Structure (Basic Data Mining Tutorial) 20
Lesson 4: Exploring the Targeted Mailing Models (Basic Data Mining Tutorial) 22
Exploring the Decision Tree Model (Basic Data Mining Tutorial) 23
Exploring the Clustering Model (Basic Data Mining Tutorial) 25
Exploring the Naive Bayes Model (Basic Data Mining Tutorial) 28
Lesson 5: Testing Models (Basic Data Mining Tutorial) 30
Testing Accuracy with Lift Charts (Basic Data Mining Tutorial) 31
Testing a Filtered Model (Basic Data Mining Tutorial) 33
Lesson 6: Creating and Working with Predictions (Basic Data Mining Tutorial) 36
Creating Predictions (Basic Data Mining Tutorial) 36
Using Drillthrough on Structure Data (Basic Data Mining Tutorial) 40
Intermediate Data Mining Tutorial (Analysis Services - Data Mining) 42
Lesson 1: Creating the Intermediate Data Mining Solution (Intermediate Data Mining Tutorial)
44
Creating a Solution and Data Source (Intermediate Data Mining Tutorial) 44
Lesson 2: Building a Forecasting Scenario (Intermediate Data Mining Tutorial) 47
Adding a Data Source View for Forecasting (Intermediate Data Mining Tutorial) 48
Understanding the Requirements for a Time Series Model (Intermediate Data Mining
Tutorial) 49
Creating a Forecasting Structure and Model (Intermediate Data Mining Tutorial) 52
Modifying the Forecasting Structure (Intermediate Data Mining Tutorial) 53
Customizing and Processing the Forecasting Model (Intermediate Data Mining Tutorial) 54
Exploring the Forecasting Model (Intermediate Data Mining Tutorial) 57
Creating Time Series Predictions (Intermediate Data Mining Tutorial) 62
Advanced Time Series Predictions (Intermediate Data Mining Tutorial) 67
Time Series Predictions using Updated Data (Intermediate Data Mining Tutorial) 71
Time Series Predictions using Replacement Data (Intermediate Data Mining Tutorial) 73
Comparing Predictions for Forecasting Models (Intermediate Data Mining Tutorial) 77
Lesson 3: Building a Market Basket Scenario (Intermediate Data Mining Tutorial) 80
Adding a Data Source View with Nested Tables (Intermediate Data Mining Tutorial) 81
Creating a Market Basket Structure and Model (Intermediate Data Mining Tutorial) 83
Modifying and Processing the Market Basket Model (Intermediate Data Mining Tutorial) 86
Exploring the Market Basket Models (Intermediate Data Mining Tutorial) 87
Filtering a Nested Table in a Mining Model (Intermediate Data Mining Tutorial) 92
Predicting Associations (Intermediate Data Mining Tutorial) 95
Lesson 4: Building a Sequence Clustering Scenario (Intermediate Data Mining Tutorial) 100
Creating a Sequence Clustering Mining Model Structure (Intermediate Data Mining Tutorial)
101
Processing the Sequence Clustering Model 104
Exploring the Sequence Clustering Model (Intermediate Data Mining Tutorial) 104
Creating a Related Sequence Clustering Model (Intermediate Data Mining Tutorial) 112
Creating Predictions on a Sequence Clustering Model (Intermediate Data Mining Tutorial)
113
Lesson 5: Building Neural Network and Logistic Regression Models (Intermediate Data Mining
Tutorial) 119
Adding a Data Source View for Call Center Data (Intermediate Data Mining Tutorial) 120
Creating a Neural Network Structure and Model (Intermediate Data Mining Tutorial) 123
Exploring the Call Center Model (Intermediate Data Mining Tutorial) 133
Adding a Logistic Regression Model to the Call Center Structure (Intermediate Data Mining
Tutorial) 138
Creating Predictions for the Call Center Models (Intermediate Data Mining Tutorial) 140
Creating and Querying Data Mining Models with DMX: Tutorials (Analysis Services - Data
Mining) 145
Bike Buyer DMX Tutorial 147
Lesson 1: Creating the Bike Buyer Mining Structure 150
Lesson 2: Adding Mining Models to the Bike Buyer Mining Structure 154
Lesson 3: Processing the Bike Buyer Mining Structure 158
Lesson 4: Browsing the Bike Buyer Mining Models 162
Lesson 5: Executing Prediction Queries 166
Market Basket DMX Tutorial 173
Lesson 1: Creating the Market Basket Mining Structure 176
Lesson 2: Adding Mining Models to the Market Basket Mining Structure 179
Lesson 3: Processing the Market Basket Mining Structure 185
Lesson 4: Executing Market Basket Predictions 189
Time Series Prediction DMX Tutorial 194
Lesson 1: Creating a Time Series Mining Model and Mining Structure 195
Lesson 2: Adding Mining Models to the Time Series Mining Structure 199
Lesson 3: Processing the Time Series Structure and Models 203
Lesson 4: Creating Time Series Predictions Using DMX 206
Lesson 5: Extending the Time Series Model 208
5
Data Mining Tutorials (Analysis Services)
Microsoft SQL Server Analysis Services makes it easy to create sophisticated data mining
solutions. The tools in Analysis Services help you design, create, and manage data
mining models that use either relational or cube data. You can manage client access to
data mining models and create prediction queries from multiple clients.
The step-by-step tutorials in the following list will help you learn how to get the most
out of Analysis Services, so that you can perform advanced analysis to solve business
problems that are beyond the reach of traditional business intelligence methods.
In this Section
• Basic Data Mining Tutorial
This tutorial walks you through a targeted mailing scenario. It demonstrates how to
use the data mining algorithms, mining model viewers, and data mining tools that
are included in Analysis Services. You will build three data mining models to answer
practical business questions while learning data mining concepts and tools.
•
Intermediate Data Mining Tutorial (Analysis Services - Data Mining)
This tutorial contains a collection of lessons that introduce more advanced data
mining concepts and techniques. The scenarios include these model types:
• forecasting
• market basket analysis
• neural networks and logistic regression
• sequence clustering
The lessons are independent and can be done in any order, but you should have a
basic knowledge of how to build data sources.
Advanced concepts covered in these lessons include the use of nested tables, cross-
prediction, custom data source views and named queries, and filtering in data mining
queries. You will also gain proficiency in using the prediction query tools that are
included in Analysis Services.
Reference
Data Mining Algorithms (Analysis Services - Data Mining)
Data Mining Extensions (DMX) Reference
Related Sections
Using the Data Mining Tools
Logical Architecture (Analysis Services - Data Mining)
6
Logical Architecture (Analysis Services - Multidimensional Data)
Designing and Implementing (Analysis Services - Data Mining)
See Also
Working with Data Mining
Microsoft SQL Server Data Mining resources
Creating and Querying Data Mining Models with DMX: Tutorials (Analysis Services - Data
Mining)
Basic Data Mining Tutorial
Welcome to the Microsoft Analysis Services Basic Data Mining Tutorial. Microsoft SQL
Server provides an integrated environment for creating and working with data mining
models. In this tutorial, you will complete a scenario for a targeted mailing campaign in
which you create models for analyzing and predicting customer purchasing behavior and
for targeting potential buyers. The tutorial demonstrates how to use three of the most
important data mining algorithms, how to analyze your findings using the mining model
viewers, create predictions and accuracy charts, using the data mining tools that are
included in Microsoft SQL Server Analysis Services. The fictitious company, Adventure
Works Cycles, is used for all examples.
When you are comfortable using the data mining tools, we recommend that you also
complete the Intermediate Data Mining Tutorial, which demonstrates how to use
forecasting, market basket analysis, time series, association models, nested tables, and
sequence clustering.
Tutorial Scenario
In this tutorial, you are an employee of Adventure Works Cycles who has been tasked
with learning more about the company's customers based on historical purchases, and
then using that historical data to make predictions that can be used in marketing. The
company has never done data mining before, so you must create a new database
specifically for data mining and set up several data mining models.
What You Will Learn
This tutorial teaches you how to create and work with several different types of data
mining models. It also teaches you how to create a copy of a mining model, and apply a
filter to the mining model. You then process the new model and evaluate the model
using a lift chart. After the model is complete, you use drillthrough to retrieve additional
data from the underlying mining structure.
7
Microsoft Analysis Services Data Mining includes the following features that help you
easily develop and compare multiple predictive models and then take actions on the
results :
• Holdout Test Sets - When you create a mining structure, you can now divide the data
in the mining structure into training and testing sets. This lets you test models on
similar data sets, and compare the accuracy of related models.
• Mining model filters - You can now attach filters to a mining model, and apply the
filter during both training and testing. This lets you easily build related models on
different subsets of the data.
• Drillthrough to Structure Cases and Structure Columns - You can now easily move
from the general patterns in the mining model to actionable detail in the data
source.
This tutorial is divided into the following lessons:
Lesson 1: Preparing the Analysis Services Database
In this lesson, you will learn how to create a new Analysis Services database, add a data
source and data source view, and prepare the new database to be used with data
mining.
Lesson 2: Building the Targeted Mailing Scenario
In this lesson, you will learn how to create a mining model structure that can be used as
part of a targeted mailing scenario.
Lesson 3: Adding and Processing Models
In this lesson you will learn how to add models to a structure. The models you create are
built with the following algorithms:
• Microsoft Decision Trees
• Microsoft Clustering
• Microsoft Naive Bayes
Lesson 4: Exploring the Targeted Mailing Models (Basic Data Mining
Tutorial)
In this lesson you will learn how to explore and interpret the findings of each model
using the Viewers.
Lesson 5: Testing Models (Basic Data Mining Tutorial)
In this lesson, you make a copy of one of the targeted mailing models, add a mining
model filter to restrict the training data to a particular set of customers, and then assess
the viability of the model.
Lesson 6: Creating and Working with Predictions (Basic Data Mining
Tutorial)
In this final lesson of the Basic Data Mining Tutorial, you use the model to predict which
8
customers are most likely to purchase a bike. You then drill through to the underlying
cases to obtain contact information.
Requirements
Make sure that the following are installed:
• Microsoft SQL Server 2012
• Microsoft SQL Server Analysis Services in multidimensional mode
• The database.
To enhance security, the sample databases are not installed with SQL Server. To install
the official databases for Microsoft SQL Server, visit the
Microsoft SQL Sample Databases
page and select SQL Server 2012.
When you are working through a tutorial, you might find it easier to move back
and forth between the steps if you add the Next topic and Previous topic
buttons to the document viewer toolbar. For more information, see
Adding Next
and Previous Buttons to Help.
See Also
Working with Data Mining
Mining Models Tab: How-to Topics
Creating and Querying Data Mining Models with DMX: Tutorials (Analysis Services - Data
Mining)
Lesson 1: Preparing the Analysis Services Database
(Basic Data Mining Tutorial)
You are a new employee of Adventure Works Cycles who has been tasked with designing
a business intelligence application in SQL Server 2012. Adventure Works Cycles hopes to
leverage your Analysis Services data mining experience to discover interesting and
actionable information about people who have purchased bicycles. They then want you
to predict which prospective customers are most likely to purchase a bicycle in the
future.
Designing this application in SQL Server starts with the creation in SQL Server Data Tools
(SSDT) of a SQL Server Analysis Services project based on the Analysis Services project
template for multidimensional modeling and data mining. After you create an Analysis
Services project, you define one or more data sources. Then, you define a view of the
metadata, called a data source view, from selected tables and views from the data
sources.
Note
9
In this lesson, you will create an Analysis Services project, define a single data source,
and add a subset of tables to a data source view. This lesson includes the following tasks:
Creating an Analysis Services Project (Basic Data Mining Tutorial)
Creating a Data Source (Basic Data Mining Tutorial)
Creating a Data Source View (Basic Data Mining Tutorial)
First Task in Lesson
Creating an Analysis Services Project (Basic Data Mining Tutorial)
Next Lesson
Lesson 2: Building a Targeted Mailing Scenario (Basic Data Mining)
See Also
Designing Data Source Views (Analysis Services)
Defining Data Sources (Analysis Services)
Building Analysis Services Projects
Creating an Analysis Services Project
Creating an Analysis Services Project (Basic Data Mining Tutorial)
Each Microsoft SQL Server Analysis Services project defines the schema for the objects in
a single Analysis Services database. An Analysis Services database contains mining
structures and mining models, multidimensional models (cubes), and supporting objects
such as data sources and data source views. In this tutorial you will be using the
database as a data source. You will deploy the data mining objects to an Analysis
Services database named BasicDataMining.
By default, Analysis Services uses the localhost instance for new projects. If you are using
a named instance or a different server, you must first create and open the project and
then change the instance name.
For more information about Analysis Services projects, see
Creating an Analysis Services
Project.
Procedures
1. Open SQL Server Data Tools (SSDT).
2. On the File menu, point to New, and then select Project.
3. Verify that Business Intelligence Projects is selected in the Project types pane.
4. In the Templates pane, select Analysis Services Multidimensional and Data
Mining Project.
5. In the Name box, name the new project BasicDataMining.
To create an Analysis Services project
10
6. Click .
1. In SQL Server Data Tools (SSDT), on the Project menu, select Properties.
2. On the left side of the Property Pages pane, under Configuration Properties,
click Deployment.
3. On the right side of the Property Pages pane, under Target, verify that the
Server name is localhost. If you are using a different instance, type the name of
the instance. Click .
Next Task in Lesson
Creating a Data Source (Data Mining Tutorial)
See Also
Building Analysis Services Projects
Defining an Analysis Services Project
How to: Build and Deploy an Analysis Services Project
Creating a Data Source (Basic Data Mining Tutorial)
A data source is a data connection that is saved and managed in your project and
deployed to your Microsoft SQL Server Analysis Services database. The data source
contains the names of the server and database where your source data resides, in
addition to any other required connection properties.
The name of the database is . If you have not already installed this database,
see the
Microsoft SQL Sample Databases page.
Procedures
1. In Solution Explorer, right-click the Data Sources folder and select New Data
Source.
2. On the Welcome to the Data Source Wizard page, click Next.
3. On the Select how to define the connection page, click New to add a
connection to the database.
4. In the Provider list in Connection Manager, select Native OLE DB\SQL Server
Native Client 11.0.
5. In the Server name box, type or select the name of the server on which you
installed .
For example, type localhost if the database is hosted on the local server.
To change the instance where data mining objects are stored
Important
To create a data source
11
6. In the
Log onto the server
group, select
Use Windows Authentication
.
Important
Whenever possible, implementers should use Windows Authentication, as
it provides a more secure authentication method than SQL Server
Authentication. However, SQL Server Authentication is provided for
backward compatibility. For more information about authentication
methods, see
Database Engine Configuration - Account Provisioning.
7. In the Select or enter a database name list, select and then click OK.
8. Click Next.
9. On the Impersonation Information page, click Use the service account, and
then click Next.
On the Completing the Wizard page, notice that, by default, the data source is
named Adventure Works DW 2012.
10. Click Finish.
The new data source, Adventure Works DW 2012, appears in the Data Sources
folder in Solution Explorer.
Next Task in Lesson
Creating a Data Source View (Data Mining Tutorial)
Previous Task in Lesson
Creating an Analysis Services Project (Basic Data Mining Tutorial)
See Also
Defining a Data Source Using the Data Source Wizard (Analysis Services)
Creating Data Sources How-to Topics
Defining a Data Source
Impersonation Information Dialog Box (Analysis Services - Multidimensional Data)
Creating a Data Source View (Basic Data Mining Tutorial)
A data source view is built on a data source and defines a subset of the data, which you
can then use in your mining structures. You can also use the data source view to add
columns, create calculated columns and aggregates, and add named views. By using
data source views, you can select the data that relates to your project, establish
relationships between tables, and modify the structure of the data, without modifying
the original data source. For more information, see
Designing Data Source Views
(Analysis Services).
Procedures
To create a data source view
12
1. In Solution Explorer, right-click Data Source Views, and select New Data
Source View.
2. On the Welcome to the Data Source View Wizard page, click Next.
3. On the Select a Data Source page, under Relational data sources, select the
Adventure Works DW 2012 data source that you created in the last task. Click
Next.
Note
If you want to create a data source, right-click Data Sources and then
click New Data Source to start the Data Source Wizard.
4. On the Select Tables and Views page, select the following objects, and then
click the right arrow to include them in the new data source view:
• ProspectiveBuyer (dbo) - table of prospective bike buyers
• vTargetMail (dbo) - view of historical data about past bike buyers
5. Click Next.
6. On the Completing the Wizard page, by default the data source view is named
Adventure Works DW 2012. Change the name to Targeted Mailing, and then
click Finish.
The new data source view opens in the Targeted Mailing.dsv [Design] tab.
Previous Task in Lesson
Creating a Data Source (Basic Data Mining Tutorial)
Next Lesson
Lesson 2: Building a Targeted Mailing Scenario (Basic Data Mining Tutorial)
See Also
Defining a Data Source View (Analysis Services)
How to: Define a Data Source View Using the Data Source View Wizard (Analysis
Services)
Lesson 2: Building a Targeted Mailing Structure
(Basic Data Mining Tutorial)
The Marketing department of Adventure Works Cycles wants to increase sales by
targeting specific customers for a mailing campaign. The company's database, ,
contains a list of past customers and a list of potential new customers. By investigating
the attributes of previous bike buyers, the company hopes to discover patterns that they
can then apply to potential customers. They hope to use the discovered patterns to
predict which potential customers are most likely to purchase a bike from Adventure
Works Cycles.
13
In this lesson you will use the Data Mining Wizard to create the targeted mailing
structure. After you complete the tasks in this lesson, you will have a mining structure
with a single model. Because there are many steps and important concepts involved in
creating a structure, we have separated this process into the following three tasks:
Creating a Targeted Mailing Mining Model Structure (Basic Data Mining Tutorial)
Specifying the Data Type and Content Type (Basic Data Mining Tutorial)
Specifying a Testing Data Set for the Structure (Basic Data Mining Tutorial)
First Task in Lesson
Creating a Targeted Mailing Mining Model Structure (Basic Data Mining Tutorial)
Previous Lesson
Lesson 1: Preparing the Analysis Services Database (Basic Data Mining Tutorial)
Next Lesson
Lesson 3: Adding and Processing Models (Basic Data Mining Tutorial)
See Also
Create the Data Mining Structure (Data Mining Wizard)
Creating a New Mining Structure
Creating a Targeted Mailing Mining Model Structure (Basic Data
Mining Tutorial)
The first step in creating a targeted mailing scenario is to use the Data Mining Wizard in
SQL Server Data Tools (SSDT) to create a new mining structure and decision tree mining
model.
In this task you will set up a new mining structure, and add an initial mining model based
on the Microsoft Decision Trees algorithm. To create the structure, you will first select
tables and views and then identify which columns will be used for training and which for
testing.
Procedures
1. In Solution Explorer, right-click Mining Structures and select New Mining
Structure to start the Data Mining Wizard.
2. On the Welcome to the Data Mining Wizard page, click Next.
3. On the Select the Definition Method page, verify that
From existing relational
database or data warehouse is selected, and then click Next.
4. On the Create the Data Mining Structure page, under Which data mining
technique do you want to use?, select Microsoft Decision Trees.
To create a mining structure for the targeted mailing scenario
14
Note
If you get a warning that no data mining algorithms can be found, the
project properties might not be configured correctly. This warning occurs
when the project attempts to retrieve a list of data mining algorithms
from the Analysis Services server and cannot find the server. By default,
SQL Server Data Tools will use localhost as the server. If you are using a
different instance, or a named instance, you must change the project
properties. For more information, see
Creating an Analysis Services Project
(Basic Data Mining Tutorial).
5. Click Next.
6. On the Select Data Source View page, in the Available data source views
pane,
select Targeted Mailing. You can click Browse to view the tables in the data
source view and then click Close to return to the wizard.
7. Click Next.
8. On the Specify Table Types page, select the check box in the Case column for
vTargetMail to use it as the case table, and then click Next. You will use the
ProspectiveBuyer table later for testing; ignore it for now.
9. On the Specify the Training Data
page, you will identify at least one predictable
column, one key column, and one input column for your model. Select the check
box in the Predictable column in the BikeBuyer row.
Note
Notice the warning at the bottom of the window. You will not be able to
navigate to the next page until you select at least one Input and one
Predictable column.
10. Click Suggest to open the Suggest Related Columns dialog box.
The Suggest button is enabled whenever at least one predictable attribute has
been selected. The Suggest Related Columns dialog box lists the columns that
are most closely related to the predictable column, and orders the attributes by
their correlation with the predictable attribute. Columns with a significant
correlation (confidence greater than 95%) are automatically selected to be
included in the model.
Review the suggestions, and then click Cancel to ignore the suggestions.
Note
If you click OK, all listed suggestions will be marked as input columns in
the wizard. If you agree with only some of the suggestions, you must
change the values manually.
11. Verify that the check box in the Key column is selected in the CustomerKey row.
Note
15
If the source table from the data source view indicates a key, the Data
Mining Wizard automatically chooses that column as a key for the model.
12. Select the check boxes in the Input column in the following rows. You can check
multiple columns by highlighting a range of cells and pressing CTRL while
selecting a check box.
• Age
• CommuteDistance
• EnglishEducation
• EnglishOccupation
• Gender
• GeographyKey
• HouseOwnerFlag
• MaritalStatus
• NumberCarsOwned
• NumberChildrenAtHome
• Region
• TotalChildren
• YearlyIncome
13. On the far left column of the page, select the check boxes in the following rows.
• AddressLine1
• AddressLine2
• DateFirstPurchase
• EmailAddress
• FirstName
• LastName
Ensure that these rows have checks only in the left column. These columns will be
added to your structure but will not be included in the model. However, after the
model is built, they will be available for drillthrough and testing. For more
information about drillthrough, see
Using Drill through on Mining Models and
Mining Structures (Analysis Services - Data Mining).
14. Click Next.
Next Task in Lesson
Specifying the Columns used in the Mining Structure (Basic Data Mining Tutorial)
See Also
Specify Table Types (Data Mining Wizard)
Data Mining Designer
16
Microsoft Decision Trees Algorithm
Specifying the Data Type and Content Type (Basic Data Mining
Tutorial)
Now that you have selected which columns to use for building your structure and
training your models, make any necessary changes to the default data and content types
that are set by the wizard.
1. On the Specify Columns' Content and Data Type page, click Detect to run an
algorithm that determines the default data and content types for each column.
2. Review the entries in the Content Type and Data Type columns and change
them if necessary, to make sure that the settings are the same as those listed in
the following table.
Typically, the wizard will detect numbers and assign an appropriate numeric data
type, but there are many scenarios where you might want to handle a number as
text instead. For example, the GeographyKey
should be handled as text, because
it would be inappropriate to perform mathematical operations on this identifier.
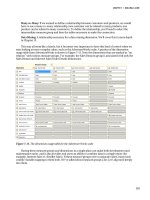
Column Content Type Data Type
Address Line1 Discrete Text
Address Line2 Discrete Text
Age Continuous Long
Bike Buyer Discrete Long
Commute Distance Discrete Text
CustomerKey Key Long
DateLastPurchase Continuous Date
Email Address Discrete Text
English Education Discrete Text
English Occupation Discrete Text
FirstName Discrete Text
Gender Discrete Text
Geography Key Discrete Text
Review and modify content type and data type for each column
17
House Owner Flag Discrete Text
Last Name Discrete Text
Marital Status Discrete Text
Number Cars Owned Discrete Long
Number Children At Home Discrete Long
Region Discrete Text
Total Children Discrete Long
Yearly Income Continuous Double
3. Click Next.
Next Task in Lesson
Specifying a Testing Data Set for the Structure (Basic Data Mining Tutorial)
Previous Task in Lesson
Creating a Targeted Mailing Mining Model Structure (Basic Data Mining Tutorial)
See Also
Content Types (Data Mining)
Data Types (Data Mining)
Specifying a Testing Data Set for the Structure (Basic Data Mining
Tutorial)
In the final few screens of the Data Mining Wizard you will split your data into a testing
set and a training set. You will then name your structure and enable drillthrough on the
model.
Specifying a Testing Set
Separating data into training and testing sets when you create a mining structure makes
it possible to easily assess the accuracy of the mining models that you create later. For
more information on testing sets, see
Partitioning Data into Training and Testing Sets
(Analysis Services - Data Mining).
1. On the Create Testing Set page, for Percentage of data for testing, leave the
default value of 30.
2. For Maximum number of cases in testing data set, type 1000.
3. Click Next.
T
o specify the testing set
18
Specifying Drillthrough
Drillthrough can be enabled on models and on structures. The checkbox in this dialog
box enables drillthrough on the named model. After the model has been processed, you
will be able to retrieve detailed information from the training data that were used to
create the model.
If the underlying mining structure has also been configured to allow drillthrough, you
can retrieve detailed information from both the model cases and the mining structure,
including columns that were not included in the mining model. For more information,
see
Using Drillthrough on Mining Models and Mining Structures (Analysis Services - Data
Mining).
1. On the Completing the Wizard page, in Mining structure name, type
Targeted
Mailing.
2. In Mining model name, type TM_Decision_Tree.
3. Select the Allow drill through check box.
4. Review the Preview pane. Notice that only those columns selected as Key, Input
or Predictable are shown. The other columns you selected (e.g., AddressLine1)
are not used for building the model but will be available in the underlying
structure, and can be queried after the model is processed and deployed.
5. Click Finish.
Previous Task in Lesson
Specifying the Columns used in the Mining Structure (Basic Data Mining Tutorial)
Next Lesson
Lesson 3: Adding and Processing Models
See Also
How to: Enable Drillthrough for a Mining Model
Using Drillthrough on Mining Models and Mining Structures (Analysis Services - Data
Mining)
Specify the Training Data (Data Mining Wizard)
Lesson 3: Adding and Processing Models
The mining structure that you created in the previous lesson contains a single mining
model that is based on the Microsoft Decision Trees algorithm. You can use this model
to identify customers for the targeted mailing campaign. However, to ensure that your
analysis is thorough, it is a common practice to create related models using different
algorithms and compare their results. That way you can get different insights as well.
Therefore, you will create two additional models, then process and deploy the models.
To name the model and structure and specify drillthrough
19
In this lesson, you will create a set of mining models that will suggest the most likely
customers from a list of potential customers.
To complete the tasks in this lesson, you will use the
Microsoft Clustering Algorithm and
the
Microsoft Naive Bayes Algorithm.
This lesson contains the following tasks:
Adding New Models to the Targeted Mailing Structure (Basic Data Mining Tutorial)
Processing Models in the Targeted Mailing Structure (Baisc Data Mining Tutorial)
First Task in Lesson
Adding New Models to the Targeted Mailing Structure (Basic Data Mining Tutorial)
Previous Lesson
Lesson 2: Building a Targeted Mailing Scenario (Basic Data Mining Tutorial)
Next Lesson
Lesson 4: Exploring the Targeted Mailing Models (Basic Data Mining Tutorial)
See Also
Adding Mining Models to a Structure (Analysis Services - Data Mining)
Adding New Models to the Targeted Mailing Structure (Basic
Data Mining Tutorial)
In this task, you will define two additional models by using the Mining Models tab of
Data Mining Designer. You will use the Microsoft Clustering and Microsoft Naive Bayes
algorithms to create the models. These two algorithms are selected because of their
ability to predict a discrete value (i.e., bike purchase). For more information about these
algorithms, see
Microsoft Clustering Algorithm (Analysis Services- Data Mining) and
Microsoft Naive Bayes Algorithm
1. Switch to the Mining Models tab in Data Mining Designer in SQL Server Data
Tools (SSDT).
Notice that the designer displays two columns, one for the mining structure and
one for the TM_Decision_Tree mining model, which you created in the previous
lesson.
2. Right-click the Structure column and select New Mining Model.
3. In the New Mining Model dialog box, in Model name, type TM_Clustering.
4. In Algorithm name, select Microsoft Clustering.
5. Click .
To create a clustering mining model
20
The new model now appears in the Mining Models tab of Data Mining Designer. This
model, built with the Microsoft Clustering algorithm, groups customers with similar
characteristics into clusters and predicts bike buying for each cluster. Although you can
modify the column usage and properties for the new model, no changes to the
TM_Clustering model are necessary for this tutorial.
1. In the Mining Models tab of Data Mining Designer, right-click the Structure
column, and select New Mining Model.
2. In the New Mining Model dialog box, under Model name, type
TM_NaiveBayes.
3. In Algorithm name, select Microsoft Naive Bayes, then click OK.
A message appears stating that the Microsoft Naive Bayes algorithm does not
support the Age and Yearly Income columns, which are continuous.
4. Click Yes to acknowledge the message and continue.
A new model appears in the Mining Models tab of Data Mining Designer. Although you
can modify the column usage and properties for all the models in this tab, no changes to
the TM_NaiveBayes model are necessary for this tutorial.
Next Task in Lesson
Processing Models in the Targeted Mailing Structure (Baisc Data Mining Tutorial)
See Also
Adding Mining Models to a Structure (Analysis Services - Data Mining)
Exploring the Targeted Mailing Models (Data Mining Tutorial)
Managing Mining Models in Data Mining Designer
Processing Models in the Targeted Mailing Structure (Basic Data
Mining Tutorial)
Before you can browse or work with the mining models that you have created, you must
deploy the Analysis Services project and process the mining structure and mining
models. Deploying sends the project to a server and creates any objects in that project
on the server. Processing is the step, or series of steps, that populates Analysis Services
objects with data from relational data sources. Models cannot be used until they have
been deployed and processed.
Ensuring Consistency with HoldoutSeed
When you deploy a project and process the structure and models, individual rows in your
data structure are randomly assigned to the training and testing set based on a random
number seed. Typically, the random number seed is computed based on attributes of the
data structure. For the purposes of this tutorial, in order to ensure that your results are
To create a Naive Bayes mining model
21
the same as described here, we will arbitrarily assign a fixed holdout seed of 12. The
holdout seed is used to initialize random sampling and ensures that the data is
partitioned in roughly the same way for all mining structures and their models.
This value does not affect the number of cases in the training set; instead, it ensures that
the partition can be repeated.
For more information on holdout seed, see
Partitioning Data into Training and Testing
Sets (Analysis Services - Data Mining).
1. Click on the Mining Structure tab or the Mining Models tab in Data Mining
Designer in SQL Server Data Tools (SSDT).
Targeted Mailing MiningStructure displays in the Properties pane.
2. Ensure that the Properties pane is open by pressing F4.
3. Ensure that CacheMode is set to KeepTrainingCases.
4. Enter 12 for HoldoutSeed.
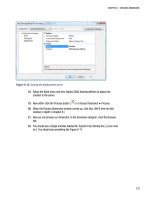
Deploying and Processing the Models
In Data Mining Designer, you can process a mining structure, a specific mining model
that is associated with a mining structure, or the structure and all the models that are
associated with that structure. For this task, we will process the structure and all the
models at the same time.
1. In the Mining Model menu, select Process Mining Structure and All Models.
If you made changes to the structure, you will be prompted to build and deploy
the project before processing the models. Click Yes.
2. Click Run in the Processing Mining Structure - Targeted Mailing dialog box.
The Process Progress dialog box opens to display the details of model
processing. Model processing might take some time, depending on your
computer.
3. Click Close in the Process Progress dialog box after the models have completed
processing.
4. Click Close in the Processing Mining Structure - <structure> dialog box.
There are multiple ways to process a model and structure. For more information, see the
following topics:
•
How to: Process a Mining Model
•
How to: Process a mining structure
Previous Task in Lesson
To set the Holdout Seed
To deploy the project and process all the mining models
22
Adding New Models to the Targeted Mailing Structure (Basic Data Mining Tutorial)
Next Lesson
Exploring the Targeted Mailing Models (Basic Data Mining Tutorial)
See Also
Processing Data Mining Objects
Lesson 4: Exploring the Targeted Mailing Models
(Basic Data Mining Tutorial)
After the models in your project are processed, you can explore them to look for
interesting trends. Because the results of mining models are complex and can be difficult
to understand in a raw format, visually investigating the data is often the easiest way to
understand the rules and relationships that the algorithms have discovered within the
data. Exploring also helps you to understand the behavior of the model and discover
which model performs best before you deploy it.
When you use SQL Server Data Tools (SSDT) to explore your models, each model you
created is listed in the Mining Model Viewer tab in Data Mining Designer. You can use
the viewers to explore the models. These viewers are also available in SQL Server
Management Studio.
Each algorithm that you used to build a model in Analysis Services returns a different
type of result. Therefore, Analysis Services provides a separate viewer for each algorithm.
Analysis Services also provides a generic viewer that works for all model types. The
Generic Content Tree Viewer displays detailed content from the mode. The model
content varies depending on the algorithm that was used. For more information, see
Viewing Model Details with the Microsoft Generic Content Tree Viewer.
In this lesson you will look at the same data using your three models. Each model type is
based on a different algorithm and provides different insights into the data. The Decision
Tree model tells you about factors that influence bike buying. The Clustering model
groups your customers by attributes that include their bike buying behavior and other
selected attributes. The Naive Bayes model enables you to explore the relationship
between different attributes. Finally, the Generic Content Tree Viewer reveals the
structure of the model and provides richer detail including formulas, patterns that were
extracted, and a count of cases in a cluster or a particular tree.
Click on the following topics to explore the mining model viewers.
•
Exploring the Decision Tree Model (Basic Data Mining Tutorial)
•
Exploring the Clustering Model (Basic Data Mining Tutorial)
•
Exploring the Naive Bayes Model (Basic Data Mining Tutorial)
First Task in Lesson
Exploring the Decision Tree Model (Basic Data Mining Tutorial)
23
Previous Lesson
Lesson 3: Adding and Processing Models (Basic Data Mining Tutorial)
Next Lesson
Lesson 5: Testing Models (Basic Data Mining Tutorial)
See Also
Mining Model Viewer Tab: How-to Topics
Viewing a Data Mining Model
Exploring the Decision Tree Model (Basic Data Mining Tutorial)
The Microsoft Decision Trees algorithm predicts which columns influence the decision to
purchase a bike based upon the remaining columns in the training set.
The Microsoft Decision Tree Viewer provides the following tabs for use in exploring
decision tree mining models:
Decision Tree
Dependency Network
The following sections describe how to select the appropriate viewer and explore the
other mining models.
•
Exploring the Clustering Model
•
Exploring the Naive Bayes Model
Decision Tree Tab
On the Decision Tree tab, you can examine all the tree models that make up a mining
model.
Because the targeted mailing model in this tutorial project contains only a single
predictable attribute, Bike Buyer, there is only one tree to view. If there were more trees,
you could use the Tree box to choose another tree.
Reviewing the TM_Decision_Tree model in the Decision Tree viewer reveals that age is
the single most important factor in predicting bike buying. Interestingly, once you group
the customers by age, the next branch of the tree is different for each age node. By
exploring the Decision Tree tab we can conclude that purchasers age 34 to 40 with one
or no cars are very likely to purchase a bike, and that single, younger customers who live
in the Pacific region and have one or no cars are also very likely to purchase a bike.
1. Select the Mining Model Viewer tab in Data Mining Designer.
By default, the designer opens to the first model that was added to the structure
in this case, TM_Decision_Tree.
2. Use the magnifying glass buttons to adjust the size of the tree display.
To explore the model in the Decision Tree tab
24
By default, the Microsoft Tree Viewer shows only the first three levels of the tree.
If the tree contains fewer than three levels, the viewer shows only the existing
levels. You can view more levels by using the Show Level slider or the Default
Expansion list.
3. Slide Show Level to the fourth bar.
4. Change the Background value to 1.
By changing the Background setting, you can quickly see
the number of cases in
each node that have the target value of 1 for [Bike Buyer]. Remember that in this
particular scenario, each case represents a customer. The value 1 indicates that
the customer previously purchased a bike; the value 0 indicates that
the customer
has not purchased a bike. The darker the shading of the node, the higher the
percentage of cases in the node that have the target value.
5. Place your cursor over the node labeled All. An tooltip will display the following
information:
• Total number of cases
• Number of non bike buyer cases
• Number of bike buyer cases
• Number of cases with missing values for [Bike Buyer]
Alternately, place your cursor over any node in the tree to see the condition that
is required to reach that node from the node that comes before it. You can also
view this same information in the Mining Legend.
6. Click on the node for Age >=34 and < 41. The histogram is displayed as a thin
horizontal bar across the node and represents the distribution of customers in
this age range who previously did (pink) and did not (blue) purchase a bike. The
Viewer shows us that customers between the ages of 34 and 40 with one or no
cars are likely to purchase a bike. Taking it one step further, we find that the
likelihood to purchase a bike increases if the customer is actually age 38 to 40.
Because you enabled drillthrough when you created the structure and model, you can
retrieve detailed information from the model cases and mining structure, including those
columns that were not included in the mining model (e.g., emailAddress, FirstName).
For more information, see
Using Drillthrough on Mining Models and Mining Structures
(Analysis Services - Data Mining).
1. Right-click a node, and select Drill Through then Model Columns Only.
The details for each training case are displayed in spreadsheet format. These
details come from the vTargetMail view that you selected as the case table when
building the mining structure.
2. Right-click a node, and select Drill Through then Model and Structure
To drill through to case data