Cs224W 2018 6
Bạn đang xem bản rút gọn của tài liệu. Xem và tải ngay bản đầy đủ của tài liệu tại đây (5.4 MB, 9 trang )
Mapping Hong Kong-Philippine Domestic Employment Networks
Miguel Ayala
Stanford University
December
10, 2018
Abstract
Aspiring
Domestic
This paper looks at the domestic worker placement industry operating in both the Philippines and Hong Kong. Using original data scraped from government websites and
collected from domestic workers, sxploratory studies are
performed on the Hong Kong and Philippine domestic
worker industries. These studies illustrate how the industry features a high level of collaboration and collusion and
among players. Initial findings indicate that this might be
suspicious activity. International placement collaboration
data is then used to link the 2 industries. Centrality measures are employed to find out which agencies have the
most influence across these 2 regions. While these results are not groundbreaking, it does provide a way forward. The initial data collection and pre-processing are
complete. The information on placement collaboration
between HK agencies and PH agencies is lacking, but now
there is a pipeline for this type of data. This data is completely new and is ready to be interpreted with the latest
cutting edge network analysis techniques.
1
Introduction
1.1
HK Domestic Workers
domestic
workers
[5].
Most
Philippine
Employment
Agency
of these
domestic
workers are women who come from countries like the
Philippines.
Though the work is largely unskilled,
the promise of earning a monthly income of 15,000
)
‘
Hong Kong
fi
{Philippine
\
`
`
Consulate
y
/
|
HK Employment
Agency
The Philippines
027
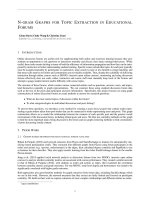
Figure 1: Major Players in the Philippine-HK Domestic
Worker Industry
HKD (approximately equal to 2,000 USD) [8] is enough
to lure university graduates from their home countries [7].
Unfortunately, many of these workers
terrible working conditions, emotional or
and civil disenfranchisement. The third
alarming because the agencies that source
women are often the cause.
1.2
In Hong Kong, there is high demand for workers
who perform menial tasks in domestic households.
In 2006, over 8% of households in Hong Kong hired
foreign
Worker
are subject to
physical abuse
is particularly
and place these
Employment Agencies
Employment agencies are major actors in this industry
(Figure 1).
When an employer from Hong Kong wishes to hire a
domestic worker from the Philippines, they contact a HK
employment agency. In the meantime, a Philippine employment agency finds a woman who wishes to work in
Hong Kong as a domestic helper. Both agencies come to-
gether and match the domestic worker with the potential
employer and make the necessary arrangements with the
consulate.
Even though legislation in Hong Kong stipulates that
employment agencies cannot charge placement fees in excess of 10% of a domestic worker’s annual salary, these
vulnerable women are often charged far more. And when
they cannot pay, they are forced to get loans from moneylenders charging exorbitant rates. Ending up in these
dangerous debt cycles can be more harmful than any other
form of abuse.
Most efforts to improve the lives of these women focus
on the cases of physical and emotional abuse. What has
not been tackled is the systemic manipulation of individuals who are unaware of their rights. The main issue is
that there is very little structured data about this type of
activity.
The domestic worker industry is a complex web of interconnected individuals and organizations in the public
and private sectors that operate in both Hong Kong and
the domestic worker’s home nations. It is believed that
over 70% of agencies currently engage in illegal operations [1], however there is not much evidence that can be
used to prosecute bad-acting agencies let alone a systematic way of identifying suspicious agencies to investigate
further.
2
2.1
Related Work
An Overview
While the lack of information in this area certainly contributes to the lack of effective response, this alone cannot be the sole cause. More harmful is the inability to
analyze available material objectively [2]. There is information about the domestic worker employment system
that has just not been examined through a scientific lens.
One framework that might be applicable to the problem
of domestic workers is Social Network Analysis (SNA).
This is the scientific, perhaps even ’structuralist’, inter-
pretation of complex social systems through the relations
of its various actors[6].
Rather than understand
a prob-
lem from the perspective of the individual, this approach
emphasizes the role of the interconnected environment on
shaping the individual’s behavior [4].
This is in direct contrast with current approaches that
treat the symptoms rather than the causes of domestic
helper abuse. While working on a case to case basis
can alleviate some of the symptoms of the issue, they do
not attack, or even identify, the root causes. Very little
is known about the domestic worker placement industry.
SNA can elucidate key features about roles and mechanisms; who is in power and who is dependent.
Similar ecosystems without traditional forms of data
have been dissected thoroughly. Many of the most interesting applications of SNA tend to be focused on
social structures in illicit areas. With only alternative
data streams, SNA has yielded fascinating insights in the
realms of drug trafficking rings [13] [12], street gangs [14]
and terrorist groups [10].
The approach of three SNA studies seem highly applicable to the issue of domestic workers in Hong Kong.
2.2
Case Study 1: Nigerian Madams
The first study by Mancuso et. al studies a sex-trafficking
network operating between Nigeria and Italy [11]. Nigeria and Italy are the two most prominent countries in the
West Africa - Europe human trafficking route; Nigeria is
the source and Italy is the sink. The main aim of the
paper was to analyze the importance of madams in the
human trafficking network. Madams are former prostitutes from Nigeria who source more girls to be trafficked.
They are widely believed to be the main actors in sextrafficking groups because they are largely responsible for
the recruitment of new victims. The data for this study
comes from a 2 year police investigation (2006-2008) in
which 67 members of three different crime organizations
associated with sex-trafficking were wire tapped. The
study aims to measure the centrality and controlling role
of madams through their known relationships with other
members in the network.
2.3
Case Study 2: Child Sex Trafficking
This paper used SNA to study internal child sex trafficking (ICST) rings in the UK [3]. The data consists of 25
offenders and 36 victims in total, drawn from two ma-
jor police investigations: Operations X and Y. The data
used were typical of police investigations: victim records
of video interviews (ROVIs), offender ROVIs, MGS
case
summaries, text messages and video footage from offenders’ and victims’ mobile telephones, formal charge list
interesting to see if these techniques withstand the change
in conditions.
(Operation X) and court visits (Operation X).
2.4
Case Study 3: Terrorist Rings
The paper uses SNA to describe how terrorist organisations have evolved since 9/11. Specifically, since 9/11
terrorist networks have changed from a more hierarchical structure to a scale-free “hub-and-spoke” system that
is much more resilient to disruption. Further, terrorist organizations have become more self-organized, local and
decentralized.
2.5
Case Study Conclusions
These papers were useful for us because there are many
parallels in the issues encountered. The first two cases
dealt with forms of human trafficking, which to some extent resembles the placement of Filipino domestic workers in Hong Kong. At a glance, it would seem that the
domestic worker network is structurally similar to the sex
worker trade in Nigeria and Italy with its transnational
collaboration.
Secondly, the cases have shown us that even with limited data (ie. a small network), insightful patterns can
be detected by SNA. This is especially exciting given the
dearth of data in the domestic worker space.
Because the networks and data constraints seem to be
analogous, we believe we can use some of the techniques
and algorithms employed by these studies. Specifically,
paper | had a cross-border analysis of the ego-networks of
each Madam, which is definitely a technique we will utilize. Furthermore, we will lean heavily on the measures of
centrality explored in all three papers. Moreover, the first
paper had interesting individual analysis of ego-networks.
This seems to be very interesting in our context.
Nevertheless, these cases also showed us that we may
have trouble with our own dataset. Their networks were
generally strongly connected. Our data may not be comprehensive enough to create a strongly connected graph,
which may mean that we will not be as successful as the
studies were.
We do think that we can also build on these papers
though. We will be testing their methods on a much bigger
network with weighted edges and directionality. It will be
3
Our Study
The primary aim of our study, is to find the agencies that
are most central to the network in both the Philippines and
Hong Kong. The most central agencies will not necessarily be involved in illegal activity, yet it is still important to
understand who drives the industry. They have the most
influence and their practices will resonate throughout the
network.
We also want to see what nodes share resources. If multiple agencies, both dormant and active, share common
resources like telephone numbers, addresses and employees, then they are probably more likely to be involved in
illicit activity. When unscrupulous firms are closed down
by law enforcement agencies, they have been known to
re-purpose their existing assets to form new companies
that operate in the same way. If we see what nodes share
resources and what nodes they interact with, we might be
able to have a good idea of who the bad actors are in both
the Philippines and Hong Kong.
4
4.1
Representation
Shared Resource Graphs
We want to create a multigraph where edges are based on
shared resources (telephone number, fax number, address,
etc). Shared resources between agencies is incredibly suspicious and should not exist in an ethical and competitive
industry. The relational information we wish to extract
can be expressed into a matrix. Matrix S: A weighted
adjacency matrix, S', where S'(7, 7) represents the link between two actors (agency or moneylender). If 7 is an entity
and j is another entity, where 7 # j, and c is the number
of resources shared by i and j, then S(i,7) = c.
4.2
Philippine-HK Graph
We want to create a multigraph where the nodes may be
HK agencies or Philippine agencies. There will be an
edge between a HK agency and a Philippine agency if
there is some domestic worker that was hired by these two
agencies. The relational information we wish to extract
can be expressed as a matrix. Matrix T: A weighted adjency matrix, T’, where T'(i, 7) represents the link between
a HK and PH agency. If 7 is a Philippine agency and 7 is a
HK agency and z is the number of domestic workers who
were hired under both i and 7, then 7 (2, 7) = #.
5
Dataset
5.1
Hong Kong Agencies
The Hong Kong government’s labour department has an
online portal that lists every single active employment
agency.
Using BeautifulSoup4, we scraped the Hong
Kong Labour Department Employment Agencies Portal
to collect data on employment agencies in Hong Kong.
Each digital record has the following information about
each operating agency:
6
6.1
Shared Resource Graphs
HK
Once we pre-processed our Hong Kong agency dataset,
we Started to explore its network structure.
The first step was to build our shared resource graph,
Six, for HK Agencies. We used geocoding libraries and
fuzzy logic to find agencies with very similar addresses,
phone numbers, emails and fax numbers. If 2 agencies
had a shared resource in common, they would have an
edge in Sux. There were 851 edges among the 1,448
agencies. We visualized this graph with graphviz-js.
e Name, Address, Telephone No., Fax No., Email
After filtering out agencies not involved in the domestic
worker industry, we found 1,448 agencies.
5.2
Philippine Agencies
To get information about Philippine Employment Agencies, we scraped the Philippine Overseas Employment
Administration website to collect data on all employment
agencies in the Philippines. Each digital record has the
following information about each agency:
e Name, Address, Telephone No., Email
We found 3,657 agencies.
5.3
Inter-Agency Links
To find links between Hong Kong and Philippine Agencies we have created Google Forms that ask current domestic workers to list their Hong Kong Agency and their
Philippine Agency. Using some of our contacts in welfare
groups and in the industry, we have found several Facebook groups that facilitate domestic worker placements.
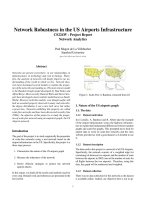
Figure 2: Visualization of HK Agencies.
Edges indicate
shared resources (Email, Phone and Address)
From Figure 2, we can see that the HK Agency network is largely disconnected but there seem to be many
large cartels operating in the space. There seem to be a
variety of different motif structures present in the graph.
What is concerning is that this graph does not merely
show a casual relationship between these agencies and
moneylenders,
but in fact direct collaboration
between
various entities.
We also extended our graph S7% by adding moneylender entities with shared resources. Part of the abuse
Proportion of Nodes with a Given Degree (log)
Degree Distribution of Erdos Renyi and HK Agency Network
—
---
10-2 4
10°
|
HK
agencies
(blue)
and
moneylenders
(red),
while
the
edges represent shared information between agencies e.g.
shared telephone,
fax, email,
address and bounding
ad-
dress. The graph shows that there is a close link between
employment agencies in Hong Kong. This is tangential
to the main issue of agency-agency collaboration, but it is
perhaps even more concerning that this type of collaboration exists.
In addition, to this graph visualization, we employed
a litany of simple network analysis techniques to glean
more insight into the graph structure. We compared our
results against a Erdos-Renyi graph with 1,448 nodes and
851 edges. The results of the analysis are presented below:
! Agencies will overcharge domestic workers who cannot pay. The
domestic workers do not usually have the right credit to get traditional
loans. The agencies will then refer these domestic workers to money
lenders, who will levy exorbitant interest rates
Node Degree (log)
[|
HK
101
|
ER
|
Clustering Coefficient | 0.16348 | 0.00149
Max Degree
20
6
Diameter
2
59
Triads
1332
1
Max Centrality
0.013822 | 0.004147
Figure 3: Visualization of Hong Kong Agencies and
Money Lenders. Blue nodes are agencies and red nodes
are moneylenders. Edges indicate shared resources.
that domestic workers in Hong Kong face is the illegal
debt cycles promoted by agencies and suspicious money
lenders '. The nodes in the graph (Figure 3) represent
Erdos Renyi Network
HK Agency Network
Comparing with the Erdos-Renyi graph, it is clear that
our HK Agency Network tends to cluster much more than
random. This is not surprising for a real life network however. Also significant is that there seems to be a large concentration of resource sharing among a few nodes. The
max degree and max centrality in the HK Agency graph
are much higher than those of the Erdos-Renyi graph. It
is interesting that the same agency has the highest degree and the highest centrality score. It turns out to be
an agency called the Further Creation Employment Centre. Once the links to Philippine Agencies is established,
it will be interesting to see if this agency plays a similarly
pivotal role.
6.2
PH
The shared resource graph of Philippine Agencies, Spx
has also been built. The resources that we compared were
address, email and telephone number.
In total, we found
292 pairs of agencies with shared resources. Very simple
analysis has been performed on this:
|
PH
|
ER
|
Clustering Coefficient | 0.028338 | 0.003127
Max Degree
6
5
Diameter
1
0
Triads
110
0
Max Centrality
0.001641 | 0.000821
Once again, we see that the shared resource network
in the Philippines has many more nodes that have high
degree than does an Erdos Renyi graph with the same dimensions. This graph is far less connected than the HK
graph, but it still seems to be more clustered than random.
Degree Distribution of Erdos Renyi and PH Agency Network
—
---
Proportion of Nodes with a Given Degree (log)
10° 4
Erdos Renyi Network
PH Agency Network
Figure 4:
Visualization of Philippine Agencies.
Edges
indicate shared resources (Email, Phone and Address)
7
r
10°
2x10⁹
3x10°
4x10⁹
6x10°
Node Degree (log)
The visualization, Figure 4, confirms this. While there
are a few triads and clusters, most of the nodes are disconnected from the rest.
Philippine-HK Graph
A Google form was sent out in late October to several
Facebook groups composed of Filipino domestic workers
in Hong Kong. It had 2 very simple questions: 1. ’What
is the name of your Hong Kong Agency’ and 2. ’What
is the name of your Philippine Agency’. Initially, respondents were able to type their responses. This was a key
mistake. Many responses were malformed. Answers did
not match up with the existing agencies. This may indicate the activity of illegal agencies. The more likely
answer is that the respondents did not clearly remember
their agencies. Some respondents also left certain fields
blank or left answers like ”I don’t remember”. Concerning answers like “I do not have an employment agency
in HK” were also present. Using fuzzy logic as a first
pass and manual checking for the remainder, we ended up
with only 205 actionable data points from our top funnel
of 600+ responses. We eventually created a drop-down
survey but this was only released late October. Not many
responses were collected partially due to fatigue and timing.
With the well-formed relational data from our survey
we created our Philippine-HK Graph. The 205 data points
revolved around 153 agencies from Hong Kong and the
Philippines. This graph was not very interesting, so we
decided to reconcile our 3 graphs into 1. Edges between
Hong Kong agencies indicate shared resources. Similarly, edges between Philippine agencies indicate shared
resources. Edges between Philippine and Hong Kong
agencies indicate placement collaboration. Disconnected
nodes were removed from this graph. In the end, the graph
has 906 nodes and 782 edges. This graph is shown in Figure 5.
ence in the industry. Below is each metric and the 5 most
central agencies according to that metric.
Degree centrality is simply the fraction of nodes that
it is connected to. There are a lot of repeated scores
because these nodes probably belong to the same clique.
Degree Centrality
Angelex Allied Agency: 0.0124869927159
Filscan Shipping Incorporated: 0.00624349635796
Jebsens Maritime Inc: 0.00624349635796
Leader
Employment
Company
Limited:
0.00624349635796
Baguio Benguet International Recruitment Agency:
0.00624349635796
Betweenness centrality is the sum of the fraction of
the shortest paths that pass through a given node over all
pairs of nodes in a graph:
Betweenness Degree Centrality
Angelex Allied Agency: 0.000663371488033
Sunlight Employment Agency: 0.000550641692681
Light
Hope
Overseas
Employment
Agency:
0.000446583420049
Baguio Benguet International Recruitment Agency:
0.00038 1546999653
Lakas Tao Contract Services: 0.000238466874783
Figure 5: Visualization of Philippine (blue) and Hong
Kong (red) Agencies. Green edges represent links between HK and PH agencies while other edges are shared
resource edges.
At first glance, the graph seems to suggest that nodes
with a lot of international collaboration seem to have a lot
of domestic collaboration as well.
Logically, however, a
more comprehensive dataset of international agency links
will make this graph far more connected. These HK agencies could only exist if they are doing business with PH
agencies. Nevertheless, the graph in its current state does
allow for some interesting analysis.
3 different measures of centrality were used to determine which agencies seem to be at the center of the network. High centrality among the shared resource and
placement collaboration edges may indicate high influ-
Eigenvector centrality uses the eigenvector of the
graph’s adjacency matrix to determine a measure of a
node’s centrality by ‘looking’ at the node’s neighbors’
centralities.
Eigenvector Centrality
New Wish Employment Agency: 0.70578 1660805
Luzern
International
Manpower
Services:
0.60700337755
Gerdin International Manpower: 0.352175309491
New Forsee Employment Agency: 0.0867147682215
Professional Employment Agency: 0.0432694727446
There does not seem to be any one agency that dominates these rankings outright. Angelex Allied Agency
seems to be pretty central according to the first two rankings.
However,
with such limited data, it is unclear how
significant this is.
One interesting trend is that most of
these very central agencies are PH agencies. Maybe this
is just an anomaly resulting from a small sample. It could
be something worth exploring, though. PH agencies may
have more influence because the laws in that country are
more flexible and may allow agencies more room to operate.
8
Next
Betweenness centrality used here is the standard algorithm that searches for the shortest path among all pairs of
nodes. What would be more compelling in this problem
space is an algorithm that only examines shortest paths
between agencies from different countries. Then, the cen-
trality metric would be a measure of how key an agency
is in connecting the 2 regions. This would not be a huge
modification to the algorithm and it would yield very topical results.
In the same vein, bridge analysis would be very exciting to perform on this merged network. It would be interesting to rank nodes or edges in terms of priority to
remove. This is a vital measure because it is unrealistic
to assume that law enforcement can remove all cut-points
in the network (as paper | suggested). Law enforcement’s
time is better spent focusing on apprehending one linchpin entity that effectively destroys the network.
While these results are not groundbreaking, it does provide a way forward. The initial data collection and preprocessing are complete. The information on placement
collaboration between HK agencies and PH agencies is
lacking, but now there is a pipeline for this type of data.
This data is completely new. It did not exist before the
study. New algorithms do not necessarily have to be invented. All the data can be parsed with the cutting edge
of network analysis. It is very exciting to imagine what
can be done on this data in the future.
9
Acknowledgements
Special thanks to Jure Leskovec and the CS224W Fall
2018 team for algorithmic help and project guidance.
Credit should also go to Jaime Deverall, Ted Ford and
Jonah Bolotin for helping with the collection and management of raw data.
10
Github
/>
References
[1]
Raquel Carvalho. “Study finds Hong Kong domestic helpers subjected to employment terms
abuse by more than 70 per cent of agencies”.
In: (2017). URL: https : / / www. scmp .
com / news / hong - kong / law- crime /
article/2093836/study-finds-hongkong-domestic-—helpers-—subjected-—
employment.
[2]
Robert M Clark. Intelligence analysis:
centric approach. CQ press, 2016.
[3]
E. Cockbain, H. Brayley, and G. Laycock. “Exploring Internal Child Sex Trafficking Networks
Using Social Network Analysis”. In: Policing 5.2
(2011), pp. 144-157. Dol: 10 .1093/police/
par025. URL: https: //doi.org/10.
1093/police/par025.
a target-
[4]
James
[5]
Patricia Cortes and Jessica Pan. “Outsourcing
household production: Foreign domestic workers
and native labor supply in Hong Kong”. In: Journal
of Labor Economics 31.2 (2013), pp. 327-371.
[6]
Mustafa Emirbayer and Jeff Goodwin. “Network
analysis, culture, and the problem of agency”.
In: American journal of sociology 99.6 (1994),
pp. 1411-1454.
[7]
Katherine Gibson, Lisa Law, and Deirdre McKay.
S Coleman.
Renée C van der Hulst. “Terrorist networks: the
threat of connectivity”. In: The SAGE handbook of
social network analysis (2011), pp. 256-270.
[11]
Marina Mancuso. “Not all madams have a central role: analysis of a Nigerian sex trafficking
network”. In: Trends in Organized Crime 17.1-2
(2014), pp. 66-88.
[12]
Carlo Morselli and Katia Petit. “Law-enforcement
disruption of a drug importation network”. In:
Global Crime 8.2 (2007), pp. 109-130.
[13]
Mangai Natarajan. “Understanding the structure of
a drug trafficking organization: a conversational
analysis”. In: Crime Prevention Studies 11 (2000),
pp. 273-298.
[14]
“Social theory, social research,
and a theory of action”. In: American journal of
Sociology 91.6 (1986), pp. 1309-1335.
“Beyond heroes and victims: Filipina contract migrants, economic activism and class transformations”. In: International Feminist Journal of Poli-
tics 3.3 (2001), pp. 365-386.
[8]
The Government of Hong Kong Special Administrative Region Immigration Department. “Quick
Guide for the Employment of Domestic Helpers
from Abroad (ID 989)”. In: (2008).
[9]
Renee C Van der Hulst. “Introduction to Social Network Analysis (SNA) as an investigative
tool”. In: Trends in Organized Crime
pp. 101-121.
[10]
12.2 (2009),
[15]
Steven
M
Radil, Colin Flint, and George
E Tita.
“Spatializing social networks: Using social network analysis to investigate geographies of gang
rivalry, territoriality, and violence in Los Angeles”.
In: Annals of the Association of American Geographers 100.2 (2010), pp. 307-326.
Stanley Wasserman and Katherine Faust. Social network analysis: Methods and applications.
Vol. 8. Cambridge university press, 1994.