Cs224W 2018 20
Bạn đang xem bản rút gọn của tài liệu. Xem và tải ngay bản đầy đủ của tài liệu tại đây (9.11 MB, 11 trang )
CS224W Project Milestone:
Analysis and Prediction of Ride-Sharing and Public
‘Transportation Traffic
Krishna Patel
Christine Phan
‘Trevor Tsue
kpatel7
cxphan
ttsue
9 December
2018
Abstract
We analyze the Uber Movement Dataset for San
Francisco along with the General Transit Feed Spec-
ification (GTFS)
Railway (MUNI)
for the San Francisco Municipal
to examine the spatial and tem-
poral organization of transportation in cities and to
further identify disparities between road and public
transit networks. By identifying important nodes in
each network by utilizing measures such as betweenness centrality, closeness centrality and degree, we
attempt to examine the interactions and commonalities between these sets of key nodes. We conclude
that the Uber Movement Dataset reflects demand for
travel services while the MUNI’s schedule reflects a
more uniform distribution, and that the MUNI data
reflects city travel while the Uber Movement Dataset
also includes long distance travel.
1
Introduction
Understanding how urban landscapes shape travel
patterns and vice versa has been an ongoing
research topic in the fields of transportation and
urban planning. With the advent of readily available GPS and mobile phone data, information
regarding transportation data has become more
accessible and useful than ever. Some of this data
is owned by private companies such as Uber, a
mobile-phone directed ride sharing company. Some
other domains have open data on various modes of
transportation — Transitland and Google have open
public transportation data, while the New York
City Open Data Project has provided researchers
with taxi data which helps them investigate traffic
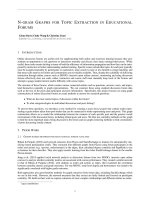
Figure 1: Time of travel from a single point near the
Bay Bridge in northeast SF
flow.
Transportation data cannot solely be modeled off
static information such as street patterns, because
its behavior and demand are always fluctuating.
Public transportation routes and stops shift in order
to respond to travel needs, and traffic flow models
rely on dynamic behavior and large spans of time.
Uber Movement provides data associated with Uber
trips taken in several major cities, including San
Francisco.
With the resource of open real-time
traffic data from Uber Movement, we are able to
assess travel patterns via rideshare and compare
it to routes in a key public transit agency in San
Francisco — the MUNI run by the San Francisco
Municipal Transit Agency.
Defining and understanding the relationship
between public transit and private vehicles is key
to seeing how different modes of transportation
interact with one another.
Ridesharing vehicles
serve individuals who do not use their own personal
vehicle — as a result, these two data sources are serving the same population with similar transportation
needs — individuals without personal vehicles.
Furthermore, because public transportation entails
scheduled departure times to and from set locations,
when comparing models of MUNI to the Uber Movement Dataset, we can utilize the passenger travel
within the Uber Movement Dataset as an ideal.
Uber allows for flexibility in timing, start location
and end location, and therefore, when compared to
the more rigidly scheduled public transportation
systems, informs us the travel demands of passenger
both temporally and spatially. In the city of San
Francisco, we model both Uber Movement’s traffic
data and GTFS data for the MUNI in order to
compare transportation need and utilization.
We then analyze, in all of these networks, the
key nodes that lead to heavy traffic in order to
understand the disparities between car and public
transportation.
Understanding the key nodes
and disparities among transportation allow urban
planners to find ways to not only identify the
nodes of the crucial to the transportation but also
alleviate traffic in the city and optimize commute
times for both private and public transportation.
Also, understanding the key nodes with traffic
elucidates the key nodes that have reduced traffic,
providing insights to paths with shorter travel
times. Additionally, after understanding the nodes
in the network, we examine the edges of the Uber
Movement Dataset and utilize them to determine
the extent of public transportation coverage in San
Francisco.
2
Related
work
Throughout the process of researching this network
project, we identified three key papers that assisted
us in providing further context on the importance
of certain nodes in a network, and key components
in being able to visualize transportation networks
in a graph setting, with nodes and vectors — both
for roads / private transportation and public transportation.
2.1
Identifying Important
Nodes
We used the paper “Identifying Important Nodes in
Weighted Covert Networks using Generalized Cen-
trality Measures”
[3] in order to understand more
about what key nodes were, and why they were relevant in a networking context. In order to understand key actors in a crime network, it was necessary
to understand the relationships between nodes — or
“actors” in this network to see who had the most influence. This idea of key nodes is highly relevant in
transportation — in order to efficiently move freight,
passengers and vehicles, it is important to see key
bottlenecks or major nodes in which many pathways
pass through.
In this paper, Memon incorporates a weighted network in their calculation of key nodes.
Here, it
is valuable to understand which nodes were most
key or central in this network in the context of including both the number of edges, and the weight
of those edges. Memon defined “node centrality”
through three characteristics: degree, closeness, and
betweenness. Each of these centrality measures were
first explored in a non-weighted graph, and then
further extended by combining both the number of
edges linked to a node, and the weights itself. While
this technical concept is applied to a different realworld network than transportation, the technique
used to incorporate centrality and identify key nodes
in a weighted graph is still important to flag here.
While the graph network here presents a viable
method of determining what “key” nodes are the
definition of “key nodes” was left more ambiguous
here, leaving the reader to determine if this calculation is a viable method for their own real world
graph.
The “key nodes” was left defined as simply “in
the thick of the network”. However, different methods used to define nodes of relevance would not provide the same information, and might not be useful
for other networking instances, like transportation.
For our project, our challenge will be adapting this
idea of node importance to transportation, where the
travel time (weights of edges) shows the importance
of various locations in the traffic network.
In [4] Traffic Flow Analysis Using Uber Movement
Data, Pearson, Sagastuy and Samaniego incorporate
various key characteristics in order to pinpoint important nodes. Each of these features reveal a different feature in real life regarding transportation.
By comparing the nodes that share these characteristics across the three graphs, we can begin to
understand travel patterns between public transit
and ride-sharing. These features are in-degree, outdegree, betweenness centrality, closeness centrality,
PageRank, hubs and authorities, and community detection.
2.2
Road
Networks
and Key
Nodes
The paper “Identification of Key Nodes in a Road
Network Using the Fusion of Nodes with Degree
Traffic Characteristics and LISH Model” [6] explored
further concepts on the construction of a road network and key evaluation indices used to understand
how transportation networks can be visualized. It
acknowledges that road networks exhibit characteristics of a complex network and therefore, much can
be derived from analyzing them in a graph based
context. This research provides two useful contexts
— the design of a spatial and traffic based network
for road transportation, and the extended definition
of key nodes.
The LISH model, before being combined with traffic characteristics considers the road topology only at
first, including the structural and geographical features of a space network. However, in this paper,
further additions are included to the LISH model by
incorporating potential traffic characteristics.
The adapted version of the LISH model in this
paper, while it does incorporate more elements of
roads that can contribute to traffic, still does not
completely visualize the actual flow of people. Road
grade and road section length do capture hypothetical throughput of vehicles on a road — however, it
does not reflect the movement and travel demand of
real people heading from Point A to Point B. Examining the LISH model incorporating edge weight will
help us understand traffic flow and, consequently,
node importance.
In [1], Understanding
Furthermore,
3
3.1
[2], Revealing travel
Algorithms
Degree
All of our graphs are directed, therefore,
sured both in degree and out degree.
3.2
we mea-
PageRank
In order to gain more insight into the most important zones of the Uber Movement Dataset, we ran
PageRank to understand the importance of certain
nodes based on how many edges are connected to
that node from neighbors.
3.3.
Clustering
Coefficient
The clustering coefficient measures how closely
nodes cluster together. The clustering coefficient of
node 2 with degree k; and e; number of edges between
the neighbors of node 7 is calculated with
urban traffic-flow charac-
teristics:a rethinking of betweenness centrality, Gao,
Wang, Gao and Liu also emphasize the importance
of understanding why temporal and spatial factors
both play a large part in being able to visualize key
nodes in a road network. They stress that although
roads are outlined spatially on a map, it is the relationship between human behavior over time and
these roads that ultimately determine which nodes
are ”key” In transportation.
in exploring
patterns and city structure with taxi trip data, we
examine how the city structure beneath the complex travel-flow system shows the inherent connection patterns within the city, on the basis of massive taxi trip data of Shanghai. Here, Liu, Gong,
Gong and Liu overlaid traffic analysis data (obtained
through taxi trip data) with the spatial layout of a
city to understand how the two interacted with one
another. Their further explorations on these subnetwork structures and how they interacted with one
another demonstrated the relationship between urban and suburban centers and how they influence
local traffic. By incorporating the land use of centers from the travel pattern perspective, they were
able to investigate sub-regions within the city.
2e;
C, = —*
k;(k; —
3.4
Betweenness
1)
Centrality
Betweenness centrality measures the probability
that a random shortest path passes through a given
node or edge. With o,, equal to the number of shortest paths going from y to z and o,,(x) equal to the
number of such paths that also pass through x, we
Algorithm 1: PageRank Algorithm
Input: Graph G = (V, F), parameter (
Output: PageRanke vector r
t=1
Vj:r =1/N
do
indicates a node’s quality as an expert, and an authority score typically indicates quality as a content
provider. In our context, however, authorities can
be taken as locations where traffic commonly flows
through. We use the following equations
Cour (2) = » Chub(9)
for all nodes7 do
if 7 in-degree = 0 then
Yor
i rÐ=0
j
else
i re = »=
Br
Chub(X) = »
fd;
Cau (9)
xy
for all nodes 7 do
| 8=3,nrj =r/”+(1~ 8)/N
t=i+
1
°
while ồ),|r;ˆ
retUrn
t
— r;(f — 1)| > 6
7
GTFS
`
U,ZZ#,Øụz
Closeness
Øy;()
z0
Ống;
Centrality
Closeness centrality examines which nodes are more
central by examining which have the smaller distances, assuming that the more central nodes have
smaller distances.
With d(y,x) equal to the length
of the shortest path from y to x, we use the equation
Celos (z)
Harmonic
1
diy Uy, 2)
Centrality
Harmonic centrality is a measure closely related to
closeness centrality, in that they both measure which
nodes act as bridges within the network. Harmonic
centrality, however harmonic centrality can be applied to graphs that aren’t strongly connected:
Char(%)
3.7
HITS
data
(General
Transit
Feed
Specification)
and Uber Movement for the city of San Francisco.
For the GTFS, we utilized the standard files,
Cụe¿(£) =
3.6
Data
We gathered data from the San Francisco Municipal
Transportation (MUNI) through publicly available
use the equation
3.5
4
—
>
dặu,z)
(y, 2)
Centrality
HITS Centrality assigns each node in a graph a hub
score and an authority score. A hub score typically
stops.txt
and
stop_times.txt
to
represent
nodes
and time intervals.
stops.txt contains familiar
names along with longitude and latitude coordinates for each stop within the MUNI system,
while stop_times.txt contains entire routes, labeled
with arrival times, departure times, unique stop
ids, and route ids, and stop number (within a route).
In order to utilize this GTFS data to create a network, we developed a python script to process these
two files, assigning each unique stop to a node, and
weighted edges between each of those nodes with the
average time difference between the different stops.
Therefore, an edge between two given nodes represents the average scheduled time of travel between
two stops. For the MUNI networks, this is the scheduled interval of time on a transit route. The SF
MUNI graph was created in the manner of L-space
graphs, as L-space graphs have been shown to provide unique insights regarding transportation and
provide the most cohesive representation of trans-
portation routes.|[5].
The Uber Movement data for the San Francisco
area provided the source ID, destination ID and
geometric mean travel time between the two ID
locations.
The sourceIDs and destinationIDs correspond to arbitrarily drawn census tracts of San
Francisco. An edge between two given nodes (source
ID to destination ID) here represents the average
travel time between spatially adjacent census tracts.
from different areas wanted to travel to this location.
In the city of San Francisco, the highest demand
occurs on the eastern side of the city, extending
from the southeast part to the northeast part. This
roughly corresponds with the commercial and prime
office space regions in San Francisco.
Since San
Francisco is a key urban area, this data makes sense
logically — less private vehicle ownership means
more individuals are taking alternative transportation to get to commercial areas or their place of
employment. Besides SFO, (the international San
Francisco Bay Area Airport), which has the highest
in-degree of 1398, an intersection near the Bay
Bridge in northeast SF had the largest in degree of
In order to effectively look at travel demands
throughout the day, we divided the data for MUNI
and Uber Movement into specific time sections.
These time intervals were as follows (in military or
24 hour time)
e Early:
0-5
e To Work:
e Midday:
6 - 11
12 - 17
e From Work:
18 - 23
1198.
5
5.1
Results
We contrast this with the MUNI system. Instead
of directly representing ridership demand
and
request as Uber Movement does, the MUNI bus
system data shows the major areas supported
ou by the official San Francisco bus system.
When
i
normalized,
the
MUNI
system
has
a
seemingly
more
¬
uniform distribution across the city than that of the
- Uber dataset, with nodes with higher in-degrees on
__ the northeast corner of the San Francisco city limits.
This corresponds roughly to the high-travel demand
in Market Street and Embarcadero, locations that
are travel-heavy for tourists and residents alike.
The node with the highest in-degree of 5 is at an
- intersection near Market Street in Northeast San
Degree
25-58
sparen alg,
:
Francisco.
zi
The characteristics of the in-degree between these
two datasets represent both travel demand and
relative coverage. The Uber Movement in-degree
~ data showcases more concentrated, high traffic
areas such as downtown San Francisco, downtown
~ Oakland, and SFO Airport. However, the Uber data
show a higher degree near the southeastern part of
the city, a part which is not covered as strongly by
MUNI as the northeastern part.
„te
/>(b) MUNI In Degree
=~
In degree for Uber represents the locatlons that
passengers want to travel to, as the more edges to
directed toward the node shows that more people
id=1gdK4su75EyNJztpix26FRzvA-14daDjQ
We analyzed the in and out degrees of both the Uber
and MUNI datasets and created gifs for them in the
link above. We analyzed them for the four time peri-
ods: early (0-5), to work (6-11), midday (12-18), and
from work (18-23). For the Uber dataset, the areas
with the highest in/out degrees tend to stay consistent for all time periods. However, the areas with
lower degrees at early time period tend to slightly increase in degree during the other time periods. However, in the MUNI dataset, we get huge spikes in the
degree during the daytime hours and huge falls during nighttime hours. Thus, we can see that there is
still a demand for transportation at nighttime hours;
however, the bus system does not provide services
during that time, and transportation is limited to
those who use Uber.
out degree of 4. This was an unpopular location for
Uber passengers, and it further shows the economic
disparity between Uber and MUNI riders, as lower
economic areas suffer from higher juvenile incarceration rates.
5.2
PageRank
(b) Uber PageRank a = 0.85
(b) MUNI Out Degree
Out degree informs where the demand for transportation lies. For instance, the location with the
highest out degree had the most Ubers called to that
location. The same intersection near the Bay Bridge
with the highest in degree also had the highest out
degree of 1150 (besides SFO). This shows the de-
mand is highest in the northeast part of SF. For
the MUNI system, that location also had a high out
degree; however, the San Francisco Superior Court
Juvenile Justice Center in central SF had the highest
PageRank identifies the important nodes recursively examining the nodes that are ”cited” by important nodes.
We ran PageRank only on the
Uber dataset, as it failed to converge on the MUNI
dataset. The top two node with the highest PageRank of 0.006127 for both a = 0.85, 0.95 lies in a small
town past Sacramento. This node is a spider trap,
as it has many in edges but no out edges. SFO lies
in third place, with a score of 0.003476. Based on
this information, it is inferred that passengers from
SFO have rode to this town near Sacramento, giving
rise to the largest PageRank score for this town.
5.3
Clustering
Coefficient
Clustering coefficient measures the proportion of
connections between neighboring nodes of a particular node. For the MUNI dataset, we can see that
there are a few small clusters with a high clustering coefficient, while the larger part of the graph is
bare. This makes sense because bus lines are very
linear and don’t tend to have many connections between closely neighboring stops. On the other hand,
for the Uber Movement Dataset, we see that a much
larger area has a high clustering coefficient, reflecting the flexible nature of Uber.
Since passengers
have the freedom to start and end a ride anywhere
they want, more clusters have the potential of forming. Furthermore, the manner in which the Uber
Movements Dataset is structured, measuring the av-
erage travel time between spatially adjacent census
tracts, also promotes the appearance of clusters.
(b) MUNI Betweenness Centrality
5.4
J
eomo
Betweenness
Centrality
&
Betweenness centrality measures the probability
that a random shortest path passes through a
ee Š
given node. For the Uber Dataset, the betweenness
yr eo.
centrality did not prove useful for our analysis, as
»em the nodes with the highest values were all located
Bs id
eS.
~ outside of SF in the East Bay. While this informa-
- tion is outside the scope of our recommendations in
order to improve the SF MUNI, we can infer some
conclusions based on the behavior of Uber riders
- and drivers.
Because Uber can be used for long
distance travel across the Bay Area (unlike MUNI,
(b) MUNI Clustering Coefficient
which is used for the city limits of San Francisco),
many routes travel up and down the Bay Area, from
=- San Jose to San Francisco, Berkeley, Sacramento
~- and beyond. The reason why the nodes with high
‹` betweenness centrality are located in the East Bay
is because due to more development in Silicon
Valley (which comprises of the South Bay and the
peninsula), the East Bay has relatively less traffic
and therefore less travel time. therefore, since edges
are weighted based on time, many nodes in the East
Bay have a high betweenness centrality due to the
low traffic.
We determined the closeness centrality of both
the Uber Movement data and the MUNI data. Ina
connected graph, closeness centrality (or closeness)
of a node is a measure of centrality in a network,
calculated as the reciprocal of the sum of the length
of the shortest paths between the node and all
other nodes in the graph.
Therefore, the more
central a node is, the closer it is to all other nodes.
In the context of public transportation, closeness
In contrast, the MUNI system’s betweenness
centralities of all the nodes roughly corresponds to
the even distribution of the MUNI map itself. This
is because rather than corresponding to ridership
demand and traffic response, public transit schedule
times and routes are fixed.
The MUNI dataset
node with the highest betweenness centrality was
the Laguna Hospital in central SF. This implies
this node intersects with many different MUNI
routes, suggesting that the Laguna Hospital is
both a significant stopping point in San Francisco
and intersects spatially among various traveling
communities.
5.5
Closeness Centrality
monic Centrality
and
—
centrality therefore implies that a stop (or node)
has more routes linked to that particular stop. The
heat map for both harmonic and closeness centrality
approximately represents the distribution of routes
in the SF MUNI system. Areas with more routes
have a greater number of nodes that are ”central”
to the system — higher closeness centrality values.
The closeness centrality value for the Uber Movement data is also similar in this regard — locations/nodes have a greater centrality measure in
Har- ways that correspond to the places in which drivers
drive through often. Nodes with high closeness centrality values in the Uber Movement dataset center
xin £ therefore center around relatively low traffic areas.
=
aa 5.6
HITS
Centrality
One interesting aspect we noticed was that instead
- of clearly detecting strong hubs pointing to strong
authorities, we see a cluster in downtown San Francisco, or the Northeast. Usually, we would expect
to see strongest hubs and authorities outside of the
» city as well, but what we see here 1s that the entire
hubs and authorities interaction is occurring within
Ag
=6
this small cluster of San Francisco.
Analysis
_ Overall, we can see that the SF MUNI and Uber
Datasets have a significant area of overlap.
The
- following graph overlays the MUNI’s paths over a
heatmap of outdegrees, showing Uber Demand from
specific locations. Uber demand can be related to
outdegree of a location, since outdegree represents
the number of locations that have been visited starting from that location.
As demonstrated in the
3 `. graph, Downtown San Francisco has the highest de(b) MUNI Closeness Centrality
~~ mand for Ubers, which makes sense because it is a
region where tourists and workers flock. An interest-
(a) Uber HITS Hub Score
429A
\
Ả,
‘ou
Figure 9: MUNI
Se
contrast, MUNI routes are set by city planners, and
these routes are more financially accessible. Even
~~ though MUNT does not allow its user base to di\ rectly influence the data the way Uber riders would,
MUNI does represent a wider financial demographic.
(b) Uber HITS Authority Score
ing thing to note is that both MUNI bus stop concentration and Uber demand increase in this downtown
area, reflecting the increased need for transportation
at a central point in the city. Although from the plotting of their bus lines alone, the SF MUNI appears
capable of transporting passengers all over this region of the Bay, Uber is still in high demand. The
reasons for this may have to do with social biases,
discussed in the following section.
6.1
Paths and Uber Demand
This is important to acknowledge because shaping
MUNI - or other public transit lines — routes around
Uber data could skew public transportation in favor
of a more privileged demographic. The purpose of
this report is to determine differences between rid-
ership demand
(reflected in Uber Movement
data)
and public transit routes, and from there, effectively
make recommendations on redesigning these routes.
However, if the difference between these networks is
due to economic disparity, then these MUNI public
transit routes should not be modified to address the
needs of a primarily wealthier demographic.
Biases
We want to identify the biases that have occurred
in the data that are not easily identifiable simply by
the information that is provided by these graphs.
The primary example of this is the demographics
of each user base.
For instance, Uber tends to
be used by those who have the ability to afford
individual rides to a direct destination. This means
that Uber data skews more towards a more affluent
community that have different transporation demands than those with less financial resources. In
7
Conclusions
Ultimately,
directly comparing the SF MUNI
system and the Uber Movement dataset did not
necessarily lead to direct recommendations, but did
provide some valuable insights on accessibility and
variety of alternative transportation methods, and
why both public transit and rideshare methods exist.
One
of
these
insights
was
the
key
difference
between long distance travel and city-specific travel.
The SF MUNI system is constrained to the city
limits of San Francisco, while Uber Movement
provides data on the entirety of the San Francisco
Bay Area, and Uber as a private company, has
operated with free authority in the overall Bay
Area. This enables Uber to provide more long-range
transportation needs, while SF MUNI covers a wider
swath of the city of San Francisco itself. We see this
in a number of our analyses, in which high-profile
locations in Uber Movement are highlighted, such
as downtown San Francisco, downtown Oaklan,
and SFO International Airport, to name a few. In
contrast, while the SF MUNI system does address
high-traffic and commercial areas in San Francisco,
such as Market Street, the city overall provides
more
extensive,
uniform
transportation
coverage
because it cannot respond in real-time to immediate
8
Further
Work
In further work, we would be interested in examining the Uber dataset on an hourly basis, instead of
the time buckets. This examination would give us
the hourly behavior of passenger and provide more
insight to the disparities between public transport
and Uber.
Another aspect we would be interested in examining is travel time prediction. With use of node2vec
embeddings of the network and distance information
from the streets (ie the shortest Manhattan distance
between two nodes), we could attempt to predict the
travel times between edges. These node2vec embeddings with a DFS approach would build clusters and
allow us to see ”distance” between the nodes. A
BFS approach would allow us to examine the local
structure of the given node.
transportation needs.
This brings us to another key insight — the
difference and merit in the uniform distribution for
a public-facing service such as SF MUNI, versus a
private company responding to ridership demand in
the context of Uber. A prime example of this is, as
previously discussed, how the SF MUNI is operated
on a relatively speaking, uniform set of routes across
the city of San Francisco, while Uber Movement’s
dataset responds to high ridership demand. While
our initial proposal suggested that by responding
to ridership demand (in comparing the Uber Movement data), SF MUNI could improve its services,
through analyzing this information ourselves, we see
that SF MUNI provides a more accessible service
for a variety of passenger demographics, through its
extensive coverage of San Francisco.
9
Krishna:
Preliminary and final data processing,
coded and ran all algorithms, ran tests, wrote algorithm descriptions, generated an algorithm that
didn’t make it into the paper, preliminary and general analysis
Christine: Problem formulation and literature review, citations, decided which algorithms to use,
wrote transit-related rationale and conclusions on
network data/outcomes
Trevor: Plotted overlay and heat maps, provided
data analytics, made conclusions from data, identified biases in data, created animations
References
Finally, the time lapse indicating the in and out
degree of both SF MUNI GTFS data and Uber
Movement data indicated significant differences in
service and demand throughout a typical day. In
general, while Uber Movement indicated that there
was a key center of the city (downtown San Francisco), and ridership demand near the center gradually expanded throughout the day, the MUNI service
did not reflect that. Instead, due to potential myriad
factors yet to be explored, MUNI service declined in
[1] Song Gao, Yaoli Wang, Yong Gao, and Yu Liu.
Understanding urban traffic-flow characteristics:
A rethinking of betweenness centrality.
Environment and Planning B: Planning and Design,
40(1):135-153, 2013.
(2) Xi Liu, Li Gong, Yongxi Gong, and Yu Liu. Revealing travel patterns and city structure with
taxi trip data. Journal of Transport Geography,
43:78-90, 2015.
the ” From Work” interval (18:00 - 23:00), at a point
where Uber Movement
Contributions
[3] Bisharat Rasool Memon.
data indicated that demand
Identifying important
nodes in weighted covert networks using gener-
for travel services was rising.
10
alized centrality measures.
2012 European Intelligence and Security Informatics Conference,
2012.
Mackenzie Pearson, Javier Sagastuy, and Sofa
Samaniego.
‘Traffic flow analysis using uber
movement data. Environment and Planning B:
Planning and Design, pages 2-6, 2017.
C. von Ferber, T. Holovatch, Yu. Holovatch, and
V. Palchykov. Public transport networks: empirical analysis and modeling. The European Phys-
ical Journal B, 68(2):261-275, Mar 2009.
Yuan Wang, Gui-Xing Zheng, and Peng Wang.
Identification of key nodes in a road network using the fusion of nodes with degree traffic characteristics and lish model. Journal of Highway and
Transportation Research and Development (En-
glish Edition), 10(3):74-77, 2016.
11