Cs224W 2018 30
Bạn đang xem bản rút gọn của tài liệu. Xem và tải ngay bản đầy đủ của tài liệu tại đây (4.26 MB, 7 trang )
CS224W Project Final Report
Needle in the Hay Stack — Finding
Fraud Rings in Transaction Networks
Zhijie Wang
ABSTRACT
Financial institutes, especially credit
card issuers, faces the challenges of
fraudsters escape detection by forming
fraud rings comprised of stolen and
synthetic identities. To uncover such fraud
rings, it is essential to look beyond
behaviors and relationships.
individual data points to the connections
that link them.
Historically, anti-fraud systems
utilize both business rules and statistical
models. The systems treat transactions as
discrete data points and generate
frequency-based models based on
transaction amount, merchant types and
locations, etc. This system fails to catch the
more sophisticated schemes when
Related works about spammer group
detection in online reviews and fake
multiple small pay-offs over time, instead of
fraudulent transactions every day. The rise
of well-coordinated criminal gangs means
that it is no longer enough for organizations
simply to detect large anomalies in
individual transactions. When fraudsters
work together and spread their activity
across a large number of transactions,
banks and auditors need to be able to look
for much subtler patterns in customer
accounts in social networks present
relevant techniques and patterns. These
works are based on clique/dense graph
detection. However, transaction networks
present different challenge as the network
is sparse and temporal. In this work, we
present out approach leveraging structural
properties and temporal information of the
vertex, to classify nodes. We evaluate our
approach on both Amazon Review Graph
[2] and synthesized Payment Network
graph [3].
1. Introduction
Traditional fraud prevention measures
focus on discrete data points such as
specific accounts, individuals, devices or IP
addresses. However, today’s sophisticated
fraudsters aiming to bleed their targets for
risking a single big score [1].
We define the fraud case we intend to
catch here: Fraudsters acquires a set of
credit cards (either through fake identity or
account hijacking), and then collude with
unscrupulous businesses to process
“ourchases” that never actually take place.
When the credit card company pays up, the
merchants and fraudsters then share the
proceeds. [4]
The fraud scheme described above will
create a dense subgraph/clique in a sparse
transaction network within a short period
of time. Given the credit card account are
fake or previously unrelated, the similarity-
based detections have difficulty catching
such scheme [5], and costing financial
industries billions of dollar each year.
Project Source code is available at />
Many existing approaches heavily rely
on already codified features, such as
merchant category. This type of information
in reality is very unreliable, for example,
Amazon is codified as electronics retail,
some online gift card resellers are codified
as toys retail. It is very easy for malicious
users to blend fraudulent transactions as
normal consumer purchases on online
marketplace, such as Amazon and Ebay.
2. RELATED WORKS
Some of the work models the spammer
group as a dense subgraph and solve via
dense graph detection on the original graph
[9]; others leverage the graph projection to
magnify interconnectivity between users,
perform community detection then score
the candidate communities [6] [7] [8] [10].
This work is a combination of both, using
network local structure and density as part
of node feature and cluster nodes based on
its feature vectors to detect outliers. The
algorithm A typical fraudulent and colluding
network displays several characteristics:
Abnormality: Given most of the
transaction on the network is not
fraudulent, it is likely the fraudulent
transactions will bear some minor
abnormality or suspiciousness, yet not
enough for standard statistical models to
distinguish. [7] [8] [9] The suspiciousness
can either be aggregated for
community/clique level [7][8][9] or
propagated as a belief network to amplify
the abnormality for certain nodes [10].
3. PROBLEM
DEFINITION
Given a graph G consisting of C
customers, M merchants and E edges
between merchants and customers, the
task is to find the top K customers in the
graph that participates in fraudulent
transaction. The fraud behavior is defined
as a group of / hijacked customers colluding
with J merchants, to quickly withdraw
balance from accounts while disguised as
regular transactions to avoid detections.
High Density: It is expensive for
criminals or spammers to maintain multiple
accounts and establish enough evidence to
make the accounts real enough. A fraudster
will reuse accounts or utilizing multiple
4. DATASETS
account in a short period of time to perform
synthetic dataset called PaySim available on
Kaggle. The dataset is simulated via Multi
Agent-Based Simulations (MABS).
activities (transaction, reviews, etc). This
result in a high density in a vertex induced
subgraph. [9]
Spikiness: Even though the fraudster
can disguise themselves, the activity will be
discovered after a period of time, such as
account past due or large amount of
conflicting reviews. The fraudster will
leverage the information asymmetry for a
short period of time to maximize their gain.
Thus, the edge weight of the induced the
subgraph (either weighted by amount of
frequency) will be high. [7] [8]
4.1. PaySim Synthetical Datasets
A real-world transaction network data is
hard to obtain with data access request to a
bank’s dataset still pending. We use a
Simulation parameters are derived from
financial transaction logs [3]. In the
simulation, each agent simulates a
customer, perform 4 types of transactions
with merchants and other peers (cash-in,
cash-out, transfer, debit and payment).
Only payment transactions are used to
construct the graph, as payment
transactions are merchants and consumers.
This dataset conveniently provides labeled
743 simulation steps.
4.2. Amazon
Product Review
Data
Most of the related works have been
benchmarked on the Amazon review data set
[2]. This dataset is real, and some ground
truth is provided from previous work. Also,
the end result is verifiable by looking at the
raw review data. The specific data set is
collected by McAuley et. al. The raw dataset
Dataset
Amazon
PaySim
Avg Degree | 65.00
60507.68
Std Degree
222778.41
| 393.87
Min Degree | 1
1
Max Degree | 4497
2257275
Total Edges | 31422
32424668
Total Nodes | 22363
6353307
contains product reviews and metadata
from Amazon, including 142.8 million
reviews spanning May 1996 - July 2014. The
“beauty” category is used, and the data
have been reduced to extract the 5-core,
such that each of the remaining users and
items have 5 reviews each. The final dataset
Table 1 Summary Statistics of User-User Projected Graph
5.
Graph Modeling
First stage of the graph modeling
assumed a simple unweighted graph. For
both Amazon review dataset and PaySim
transaction dataset, the original nodes are
re-indexed to numerical index and perform
bipartite graph projection to create a useruser graph. Each user/consumer can
connect to another consumer, if they have
both reviewed a product or transacted with
a merchant.
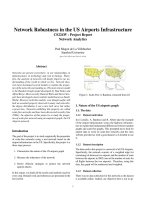
Figure 1 shows the constructed node
degree distribution, in log-log scale.
Proportion of Nodes with a Given Degree (log)
„
”
°
°
S
a
ground truth. This data set contains
9075669 nodes (both consumer and
merchants) and 6362620 transaction with
———
Paysim
——
Amazon
Transaction
User-User
101
102
Node
Network
Review User-User Network
Degree
103
(log)
Figure 1 Degree Distribution of Amazon Review and
PaySim network
6.
Evaluating Fraudar Algorithm
The Fraudar algorithm implementation
code is obtained from this link?. [TODO: add
full algorithm reference]. The algorithm was
has 34464 nodes (both products and
run on both PaySim data and Amazon data.
The algorithm did detect large blocks of
weeks.
dense subgraph Table 2. The algorithm has
low precision (0.03) in detecting injected
reviewers) and 198502 reviews and 530
4.3. Fraud Injection
To properly model the fraud activity
some fraudulent transaction data are injected
to the graph. The injection algorithm
follows:
Select i random users, j random
merchants/products, connect all 7 users to j
merchants.
t />/fraudar/index.html
collusion groups.
The algorithm is developed to detect
and approximate dense subgraphs that are
significantly denser than the rest of the
graph behavior, under the assumption that
add a large number of edges, inducing a
dense subgraph between the fraudster
accounts and merchants [9]. This does not
match with the credit card transaction
collusion fraud.
Credit card transaction collusion
fraud has a much shorter execution time
period and does not add enough
transactions to make it significant enough
for easy detection. Or super dense cluster
may form due to supper popular merchants
transactions between u and merchant i,
where i = Merchant ID — min(Merchant ID).
After initial feature generation, iteratively
expand the feature vector by appending the
sum and average of feature vectors from u’s
neighbors. Using cosine similarity, calculate
similarity score against a randomly selected
node to detect abnormality.
such as Amazon, eBay, Walmart, gas
1
0.8
7.
Methods and Evaluation
After carefully examining the
FRAUDAR algorithm, we have the
hypothesis that mesoscopic features such
as graph motif could better capture the
characteristics of such fraudsters and
collusion network [11] [12].
7.1. RolX Algorithm and Feature Vector
The algorithm is derived from RolX
algorithm [13]. The algorithms are applied
the Customer-to-Customer graph (C2C
graph), obtained by performing bi-partite
projection on the original transaction
network, G. E(u, v) exists
if Jmwhere E(u,m) and E(v,m) exists.
3 ways to generate initial feature vector:
Edge count -- Initial feature
V7 include degree of u, count of edges
within egonet of u, count of edges from
egonet of u connecting to the rest of the
graph.
Node local structure -- Initial feature
V,Pinclude graph motif counts of graphlets
in size of 3 as proposed by Yin et al. [12].
Merchant-profile count — Initial
feature V,? is a one-hot encoding vector,
where the ith element is the number of
distance = 2. This simulates a BFS style walk,
meaning each customer’s feature vector is
affected by the merchants it transacts with.
The merchant’s feature vector is recursively
being defined as its customers it transacts
with.
8.
Results
The fraud injection process skews
the degree distribution of projected
Customer-to-Customer graph, Figure 2.
Proportion of Nodes v with a Given Degree (log)
e
”
Ss
S
s
5
Density
Table 2 FRAUDAR Dense Subgraph Detection
10°
10°
2x10°
3x10
Node Degree (log)
4x10°
6x 10°
Figure 2(a) Degree Distribution of C2C Graph Without
Fraud Injection
en Degree (log)
8
8
380
8
113x113
8
Subgraph
Block Size
Using node embedding technique as
proposed by Leskovec et. al in [14],
calculate the vector representation of
nodes using the original transaction graph.
The node2vec random walk parameters are
configured as p = 1, q = 10, and walk
of Nodes with a Giv
Amazon
2
PaySim
7.2. node2vec
for featurization
Proportion
stations etc.
Dataset
10°
Node Degree (log)
101
Figure 3(n) Degree Distribution of C2C Graph with Fraud
Injection
This skewness is noticeable in
smaller graphs and captured by Fraudar
method. During the experimentation, it
turns out feature engineering-based
approaches are computationally intensive
to finish on a Mac Pro 2015 with i7
processor + 16GB RAM. The computation
was performed from a sampled subgraph,
by selecting 1 million transactions from the
fraudulent transaction users implies that
there are small and dense subgraphs
formed naturally within the graph. If the
fraudulent operation is very sneaky, it can
easily evade the detection of Fraudar
algorithm. Given the current data set is a
sampled graph, the original dataset could
easily have much bigger dense subgraph. In
real world scenarios, we can remove certain
original transaction log. The fraud injection
trusted or low-risk dense subgraph
is performed with 20 users and 2 nodes. It
transactions, such as transactions to USPS
turns out RolX-like role discovery failed to
and Starbucks.
provide useful features, Table 3.
9.
Table 3 Performance Evaluation of Different Feature
Engineering
Method
Mean | Max |
Std
Edge Count
0.977 | 0.999 | 0.092
Local Structure
0.969 | 0.999 | 0.098
Merchant
0.001 | 0.999 | 0.003
Profile
Due to the sparsity of transactions
distributions, a customer’s merchant profile
will unlikely match another customer’s
profile. Even though both customer A and B
frequents coffee shops, due to factors such
as geo-locations or brand preferences, they
will have very different merchant
transaction profiles.
Table 4 Fraudar Algorithm Performance
# Fraud | #Colluded
User
Merchant
Prediction | Accuracy
Count
(%)
5
2
12
0
5
3
12
0
5
4
12
0
10
2
10
1
10
3
10
1
20
2
20
1
The fraudulent subgraph can be
detected with relative ease when there are
more than 10 users engaged in the
fraudulent transactions (total 99998 users).
The ease of detection does not increase as
the merchant count increases. The
consistent detection of 12 false positive
Further work
Our results indicated dense-subgraph is
so far the most accurate fraudulent
transaction detection mechanism. We
explored possibilities of using other
advanced features, such as graph motifs
and egonet edge counts to classify
fraudulent transactions. But for the specific
type of colluded fraud, the feature
engineering mechanisms are not accurate
enough and computationally intensive.
One aspect of the data left
unexplored is the time dimension of the
transactions and fraud behavior. When the
collusion group attempt to cash out the,
they perform significant amount of
transactions in a short period of time.
Another aspect left unexplored is
the edge weights. The edge weight can
encode many additional information, such
as transaction amounts,
or transaction
frequencies. Currently Fraudar algorithm
takes input as unweighted graph.
Finding the collusion groups in a big
transaction networks involving millions of
customers and merchants are like finding a
needle in the haystack. Detection
mechanisms based on graph structure and
dense-subgraph properties can be very
crucial, but additional features and side
information are needed to push accuracy to
the next level.
REFERENCES:
[1]
[7]
Sorournejad, S., Zojaji, Z., Atani, R.E.,
& Monadjemi, A.H. (2016). A Survey
of Credit Card Fraud Detection
[2]
Techniques: Data and Technique
Oriented Perspective. CoRR,
abs/1611.06439.
E. A. Lopez-Rojas, A. Elmir, and S.
Axelsson. "PaySim: A financial
mobile money simulator for fraud
detection". In: The 28th European
Bounding Graph Fraud in the Face of
Camouflage. In Proceedings of the
Modeling and Simulation
Symposium-EMSS, Larnaca, Cyprus.
2016
Mahmoud, A. (2017, January 19).
22nd ACM SIGKDD International
Conference on Knowledge Discovery
WWW, 2016
[9]
and Data Mining (KDD '16). ACM,
New York, NY, USA, 895-904. DOI:
/>39747
[10]
Vlasselaer, V.V., Bravo, C., Caelen,
O., Eliassi-Rad, T., Akoglu, L., Snoeck,
2017/detecting-complex-fraud-realtime-graph-databases/
M., & Baesens, B. (2015). APATE: A
novel approach for automated
Mahmoud, A. (2017, January 19).
credit card transaction fraud
detection using network-based
extensions. Decision Support
Detecting complex fraud in real time
with Graph databases. Retrieved
from
/>
[6]
[8]
Detecting complex fraud in real time
with Graph databases. Retrieved
from
/>
[5]
/bxv068
Chan R., Xu Y., Bochkov Y. (2017),
CS224W Spammer Groups Detection
Based on Communities Evolution
Bryan Hooi, Hyun Ah Song, Alex
Beutel, Neil Shah, Kijung Shin, and
Christos Faloutsos. 2016. FRAUDAR:
evolution of fashion trends with
R. He, J. McAuley
[4]
6, 1 June 2016, Pages 861—
874, />
Ups and downs: Modeling the visual
one-class collaborative filtering
[3]
Zhuo Wang, Tingting Hou, Dawei
Song, Zhun Li, Tianqi Kong;
Detecting Review Spammer Groups
via Bipartite Graph Projection, The
Computer Journal, Volume 59, Issue
Systems, 75, 38-48.
[11]
2017/detecting-complex-fraud-realtime-graph-databases/
Jure Leskovec, Kevin J. Lang, Anirban
Dasgupta, and Michael W. Mahoney.
2008. Statistical properties of
community structure in large social
Allahbakhsh M., Ignjatovic A.,
Benatallah B., Beheshti SMR.,
and information networks.
In Proceedings of the 17th
international conference on World
Bertino E., Foo N. (2013) Collusion
Detection in Online Rating Systems.
In: Ishikawa Y., Li J., Wang W., Zhang
R., Zhang W. (eds) Web
Wide Web (WWW '08). ACM, New
Technologies and Applications.
/>
APWeb 2013. Lecture Notes in
Computer Science, vol 7808.
Springer, Berlin, Heidelberg
67591
York, NY, USA, 695-704.
[12]
DOI:
Yin H., Benson A., Leskovec J., and
Gleich D. 2017. Local Higher-Order
Graph Clustering. In Proceedings of
the 23rd ACM SIGKDD International
Conference on Knowledge Discovery
and Data Mining (KDD '17). ACM,
New York, NY, USA, 555-564. DOI:
[13]
/>98069
Henderson, Keith & Gallagher, Brian
& Eliassi-Rad, Tina & Tong,
Hanghang & Basu, Sugato &
Akoglu, Leman & Koutra, Danai &
Faloutsos, Christos & Li, Lei.
[14]
[15]
(2012). RolX: Structural role
extraction & mining in large graphs.
Proceedings of the ACM SIGKDD
International Conference on
Knowledge Discovery and Data
Mining. 10.1145/2339530.2339723.
Grover, A. and Leskovec J.. 2016.
node2vec: Scalable Feature Learning
for Networks. In Proceedings of the
22nd ACM SIGKDD International
Conference on Knowledge
Discovery and Data Mining (KDD
'16). ACM, New York, NY, USA,
855-864. DOI:
/>9754
Srijan Kumar, Bryan Hooi, Disha
Makhija, Mohit Kumar, Christos
Faloutsos, V.S. Subrahmanian
Rev2: Fraudulent User Prediction in
Rating Platforms
WSDM, 2018 — Web Search and
[16]
Data Mining Conference, 2018
Srijan Kumar, Justin Cheng, Jure
Leskovec, V.S. Subrahmanian.
An Army of Me: Sockpuppets in
Online Discussion Communities.
WWW, 2017 — 26th International
World Wide Web Conference, 2017