Cs224W 2018 34
Bạn đang xem bản rút gọn của tài liệu. Xem và tải ngay bản đầy đủ của tài liệu tại đây (10.7 MB, 15 trang )
Finding Foundations: Using Citation Network Analysis to ‘Trace
the Lineages of Academic Knowledge
Jack Beasley,
Kristine Guo,
December 9, 2018
Abstract
An important task in the domain of citation network
analysis concerns discovering and understanding the
development of academic knowledge throughout time.
Previous research has made great strides in understanding the structures of academia, but the results
are limited to narrowly-defined concepts and rely on
domain-specific datasets.
In this paper, we aim to discover trends and structures
of research development in academia for a broad range
of domains. To do so, we use a very large general cita-
tion network, the Microsoft Academic Graph (MAG),
instead of relying on a domain-specific dataset. Using
this network, we aim to identify the lineage of papers
that have laid the foundations for the development of
any given paper in the MAG.
First, we utilize breadth-first search from the paper
in question to create a domain specific dataset in
real-time. Notably, our algorithm works around the
MAG?’s large demand for system memory, effectively
allowing users to partition a large graph on a laptop or
inexpensive server. Secondly, we use citation network
analysis techniques to identify the “lineage” of a work,
which we take to be series of works that capture the
given paper’s path of academic development and foundations. We evaluate the performance and distinctive
characteristics of several algorithms, including main
path analysis, betweenness centrality, and PageRank.
Thus, we demonstrate a potential method for tracing the academic lineage of arbitrary works on large
citation networks using inexpensive hardware.
Introduction
Citation network analysis offers a wealth of information about professional communities and the development of academic research. One common application
of this information is to create recommendation sys-
tems that can refer readers to other relevant sources.
To do so, extensive research has been conducted to
craft robust methods that attempt to determine which
papers are most important and impactful within a
given field.
However, rather than identify papers that are generally popular in a field, in this paper we are concerned
with finding papers that are foundational specifically
to the development of a single paper at hand. Thus,
we aim to build a recommendation system that can discover the papers that have most directly contributed
to the knowledge any given paper builds on.
To accomplish this task, recent research has employed
methods of citation network analysis in order to examine the evolutionary structure of academic knowledge
throughout time. However, such findings are often
limited to narrowly-defined scientific concepts and
fields,! require manual curation of domain-specific
citation datasets, and fail to apply to the broader
day-to-day inquiries a researcher may have.
Thus, the key contribution of our work is applying
methods of network analysis to a large, comprehensive
citation dataset, allowing exploration of almost every
domain of academia. In order to handle a citation
network of this magnitude, we craft algorithms for extracting any paper’s local neighborhood in the citation
network in an efficient manner such that recommendations can feasibly be returned to a user interactively.
Finally, we apply variations of main path analysis
in order to trace the academic lineage for the given
paper based on its local neighborhood of citations and
references.
Thus, the contributions of our paper extend previous
work by abstracting their methods and results to operate on papers from any field, not simply a small
subfield, while also removing the need for manual
construction of domain-specific datasets. By doing so,
'Calero-Medina and Noyons, “Combining Mapping and Citation Network Analysis for a Better Understanding of the Scientific Development,” @liuIntegratedApproachMain2012, Q@xiaoKnowledgeDiffusionPath2014.
we hope to make the evolutionary structure of academic research more accessible for anyone attempting
to gain a broad understanding of the development of
academic literature.
Related
Work
Single-Score Methods
There exist many different methods to determine node
importance in a graph. For paper and journal importance applications, Clarivate Analytics has published
journal importance statistics based on two distinct
measures: the Journal Impact Factor, which is mostly
based on citation counts? and the Eigenfactor score,”
which is essentially a modified PageRank algorithm
for citation networks rather than web networks.
While these methods provide effective rankings given
the properties they attempt to rank by, they provide
nothing but a single score number that can be hard to
interpret. Because these scores distill complex graph
phenomena into a single number, they offer little
help in determining the actual relationships between
articles and understanding the larger development of
science. Thus, single-score methods do not effectively
help researchers with the problem of determining what
the foundations of a paper are.
Because of this lack of information from single-score
methods, we seek algorithms that preserve the citation
network graph structure. Thus, our research pointed
us towards the usage of main path analysis, which we
will explore more in the next three papers.
Combining mapping and citation network analysis for a better understanding of the scientific development*
Calero-Medina and Noyons combine bibliometric mapping and citation network analysis in order to investigate the development of scientific knowledge about
Absorptive Capacity, a term coined in 1988 that has
had widespread influence on the field of Organization.
For citation network analysis in particular, they utilize two different methods: 1) main path analysis, and
2“Impact Factor - Clarivate.”
3 Bergstrom, West, and Wiseman, “The Eigenfactor™ Metrics.”
4Calero-Medina and Noyons, “Combining Mapping and Citation Network Analysis for a Better Understanding of the
Scientific Development.”
2) hubs and authorities analysis. Main path analysis
identifies the nodes that are most frequently used in
“walks” from the most recent citations to the oldest.
By computing all such possible paths, we can discover the papers that are more frequently encountered
throughout time, pointing towards their centrality in
the development of an academic specialization. This
technique is combined with information gained from
using hubs and authorities analysis, which identifies
papers that are both cited by other prominent papers
as well as cite important papers themselves.
By combining these different perspectives, CaleroMedina and Noyons successfully identify 15 papers
that comprise the main path component of the Absorptive Capacity field. Thus, this paper provides
inspiration for using main path analysis to identify
foundational papers in combination with hubs and
authorities which actually ranks and scores the papers.
An integrated approach for main path
analysis: Development of the Hirsch in-
dex as an example®
Liu and Lu begin by critiquing the technique of main
path analysis. The original main path analysis only
identifies a single main path, which is not representative of larger scientific networks that often have
multiple main paths. Furthermore, the original algorithm greedily constructs the main path by repeatedly
selecting the link with the highest search path count
(SPC). However, as with many greedy algorithms, this
algorithm is not guaranteed to produce the path with
the largest cumulative SPC or contain the link with
the largest SPC.
Therefore, Liu and Lu propose new variations on main
path analysis. For example, global main path analysis
aims to find the path with the true overall largest
SPC. Another is multiple main path analysis, which
identifies multiple local main paths by relaxing the
search constraints to reveal more detailed information.
Finally, key-route main path analysis guarantees that
the link with the highest SPC is included by beginning
the search from both ends of the link instead of the
source nodes. Importantly, all of these methods can
be combined as well.
Thus, the authors next apply an integrated approach
that utilizes a combination of main path analysis
methods in order to examine the development of the
Hirsch index. Ultimately, their results prove that the
5Liu and Lu, “An Integrated Approach for Main Path Analysis.”
main path analyses developed by Liu and Lu enhance
our capability to capture different types of information
about the relationships between scientific articles.
Knowledge diffusion path analysis of
data quality literature:
A main path
analysis°
In this article, Xiao et al. integrate local, global,
multiple-global, and key-route main path analyses
to uncover knowledge diffusion paths of data quality
literature. In particular, they demonstrate that each
type of main path analysis reveals different yet complementary information about development trends.
For example, local and global main path analysis highlight the papers that have provided major contributions to the field. On the other hand, multiple global
and the key-route main path analyses provide more
complete pictures of development trends by identifying
multiple paths, revealing the divergence-convergence
of the citation network as it evolves throughout time.
Finally, and perhaps most importantly, Xiao et al. also
provide intuitive graphical representations of main
path analyses in order to both convey their nuances
and allow the reader to view the interrelationships
between papers. This method of presenting results in
particular serves as an inspiration for our project.
Motivation
ground truths underlie a research problem. Beyond
even just academics, people with casual interest in a
field should also be able to have easy access to a field’s
literature without having to manually search for its
most foundational papers. Such tasks would benefit
from comprehensive knowledge of the development of
the techniques and concepts under question.
Dataset
While there are many options for citation networks,
for this project we selected the Microsoft Academic
Graph (MAG)’. We chose this dataset because it is
freely available under an open license, and it has also
been described as “the most comprehensive publicly
available dataset of its kind” in a review article.®
We initially chose the 2017 snapshot of the MAG made
available by the Open Academic Society, however, the
IDs assigned to papers in that dataset do not match
those used by the Microsoft Academic API, meaning
that looking up paper titles from IDs required a local
copy of the entire uncompressed dataset which totalled
300GB.
Thus, we instead contacted Microsoft and got access
to a recent snapshot (accurate as of 2018-10-12) of
the current MAG. We then downloaded only the PaperReferences file, which is a 31.3 GB edge list, where
paper IDs are 64-bit integers.
for Improvement
As seen from the literature review above, citation
network and main path analysis are often limited to
characterizing the development structures of specific
concepts and subfields such as Absorptive Capacity,
the Hirsch Index, and data quality literature.
This reality proves less than ideal for researchers and
academics, who are told to “stand on the shoulders
of giants” but are not given any tools that they can
use to efficiently peruse and explore the development
of their field. For example, conducting a literature
review requires the ability to determine what works
constitute essential background reading for a given
paper, as well as assessing works with large impact
when attempting to create new innovational methods.
However, this is not an easy process, as making literature reviews is a time-consuming manual problem that
consists of recursively searching through papers’ citations to try to understand what actual authorities and
6Xiao et al., “Knowledge
Quality Literature.”
Diffusion Path Analysis of Data
Inexpensively Constructing
cal Neighborhoods
Lo-
Motivation
As explained above, due to its large, comprehensive
dataset of citations, we utilize the Microsoft Academic
Graph (MAG)
as our principal citation network in
order to be able to apply our methods to any paper
within the MAG. However, using the MAG poses
a challenge due principally to the large size of the
dataset.
The MAG contains an edge list of 1,269,744,602 edges,
each consisting of two 64-bit integer ids. Consequently,
fitting the whole edgelist in memory would require
a machine with at least 22 GB of RAM, plus more
Sinha et al., “An Overview of Microsoft Academic
(MAS) and Applications.”
8Herrmannova and Knoth,
Academic Graph.”
“An
Analysis
Service
of the Microsoft
RAM for auxiliary data structures.
nature of the computing hardware
with 8GB of RAM and compute
instances with 4GB of RAM), we
load the dataset into memory and
breadth-first search.
Given the limited
available (laptops
credits for cloud
could not simply
perform a typical
Thus, we devised a system to quickly run breadth-first
search such that we minimize lookups to the edge list
on the HDD or SSD while minimizing memory usage. This work follows a similar vein as GraphChi® or
X-Stream,!° but specifically designed for the specific
Algorithm 2: Preform a traversal over the hashed
graph
1 function BFSOutLinks ;
Input:
initialPaperID, levels
Output: outputFile
2 seenPapers = {initialPaperID}
3 currentPapers = {initialPaperID}
4 for i + 0 to levels do
5
6
7
8
task of subgraph partitioning rather than more general
graph computation frameworks. Notably, this algorithm still makes the assumption that while the whole
9
graph cannot fit in RAM, a given paper’s subgraph 10
can.
11
12
Method
Our method has two distinct phases: hashing and
traversal. In the hashing step, we create two indexes
by hashing edges to files based on the source node
id for the first and the destination node id for the
second. This method is similar to the “shard” method
employed by GraphChi as each shard contains a number of edges that can can be fully loaded into memory.
However, to simplify implementation, we hashed to
separate files, rather than sorting the list into shards.
Algorithm
1: Hash edge list into two files
w
1 function hashEdgeList_ ;
Input: sourceFile, numberHashFiles
Output: srcHashFolder, dstHashFolder
2 for line~sourceFile do
srcID, dstID <©— line
1A.
G
ộ
fk
srcHashNumber ôâ srcID % numberHashFiles
dstHashNumber ô+ dstID % numberHashFiles
srcHashFolder /${srcHashNumber} < line
dstHashFolder /${dstHashNumber} < line
end
Once we have pre-processed and hashed the data, we
can use that data structure to traverse the graph in
pieces.
The BFS maintains a set of currentPapers and of
seenPapers. The currentPapers set keeps track of all
the starting points for the next level of BFS and is
cleared at the end of each level. The seenNodes set
contains all nodes previously seen by the BFS. Thus,
*Kyrola, Blelloch, and Guestrin, “GraphChi.”
10Roy, Mihailovic, and Zwaenepoel, “X-Stream.”
nextPapers = {}
for i € currentPapers do
hashNumber + id % numberHashFiles
for line—srcHashFolder/${hashNumber}
do
13
14
end
15
end
16 end
sourcelD, destinationID + line
if sourceID € currentPapers \ 7
sourceID € seenPapers then
seenPapers. Add(destinationID)
next Papers.
Add (destinationID)
outputFile
«+ line
this set results on the majority of memory use for the
algorithm. We write edge lines directly out to the
output edgelist file as soon as they are matched as an
edge that connects with a paper in the currentPaper
set. Thus, this algorithm holds very little state in
memory and notably does not hold a representation
of the subgraph in memory.
Because of our hash setup, we are guaranteed that
all of the edges from a node are in a single file, thus
finding all the out edges for a node requires reading
only one of the hashed files, which are much smaller
than the original file, depending on the number of hash
files chosen. We chose to make 3000 hash buckets and
our files ended up around 9.5 MB each. This simple
setup vastly decreases the amount of IO needed to
traverse the graph and typical runs going out 2-3 levels
only require less than 15GBs of disk IO on the 30GB
dataset, as measured by the OS activity monitor.
This reduction of IO operations is the key to the
performance of this technique as these workloads are
almost entirely [O-bound. Even with this technique
our server instance (an inexpensive Azure DS1 1-CPU
instance), runs at around 30% CPU while performing
a traversal.
When planning for larger runs of the BFS, we realized
that we could end up with more seenNodes than we
had memory for if the traversal grows too large. To
handle this, we tested an inverse bloom filter.!! This
variation of a classic Bloom Filter provides a constantmemory way of checking which nodes have already
been seen in such a way that there are no false positives
and the filter never reports that we’ve seen a node
when we haven’t at the expense of sometimes falsely
reporting a node as not seen. This means that we
get a correct count for nodes, while some edges are
repeated. While we validated this method on a few
papers, more work would be needed to characterized
the performance and correctness of this method.
Out Degree Distribution of MAG (sample of 1000 nodes)
10
i‘
ä
ø
...«
&
6
.
5
*
Follow in and out
Follow only out
.
Follow only in
-
ô
.
eee
wee
oo
omececeee
10
101
`
5
%
dee
`
emmecms
10?
were em
+
Â
103
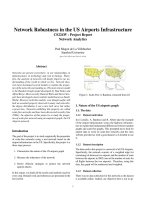
majority of papers cite under 100 papers; however,
a few cite more. This distribution does not follow
the same power law distribution commonly seen in
community networks, which intuitively makes sense
given that it reflects the norms of how many papers
authors typically cite, rather than network effects.
In Degree Distribution of MAG (sample of 1000 nodes)
101
10?
*
.
“
haê
v
8
3
*
2 10
o
»
.
5
v
2
E
“
.
“Na
*e
2
E
es
6
Sa
Comoe
a6
oe mee
ce
.....—..
oat
10°
+e
Figure 2: Out degree distribution of 1000 node sample
of MAG made using a one-level breadth-first search
eo
2
10°
se
-
oom
E
. .
: “oe ©
“Se
~
""
ca
E
Ễ
see
se.
2
Time to Traverse Two Levels vs. Edges Found (sample of 1000 nodes)
102
:
Out Degree
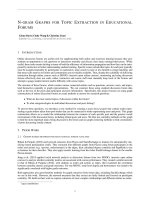
Analysis of BFS
We performed an empirical performance analysis of
our breadth-first search methods. While calculating
node degrees, we logged the time each run took and
compared that to the number of edges found in the
subgraph. We ran breadth-first searches on 1000 randomly selected nodes for one level (to get in and out
degrees, see next section) and for two levels. At each
level we did three runs, one following both in and out
links, one following only in links and one following
only out. The results of this are in graph form below:
*
*
ø "#9%
vs.
g.”
10°
Runtime
.
a)
®c
101
102
103
10%
Number of Edges Found
10°
10°
109
TC——.—...... ....
10°
101
102
In Degree
10?
Figure 1: BFS traversal times for 2 level runs showing
exponential relationship between the number of edges
found and time spent traversing
Figure 3: In degree distribution of 1000 node sample
of MAG made using a one-level breadth-first search
MAG
The in degree distribution matches up more with
a traditional power-law network community degree
Statistics
Using the breadth-first search tool described above, we
calculated approximate in and out degree distributions
for the MAG using a random sample of 1000 nodes.
The out degree distribution, which represents the
number of referenced papers, shows that the vast
1l“The Opposite of a Bloom Filter — Something
@treatProbabilisticDataStructures2018.
Similar,”
distribution like that seen in web graphs.!?
This
makes intuitive sense as the mechanisms that govern
who interacts with a website by linking it and who
interacts with an academic work by citing it seem very
similar.
12Broder et al., “Graph
Structure in the Web.”
Finding
Development
Academic
Trends
in
Research
where oy, is the number of shortest paths going from
y to z, and o,,() is the number of such paths that
pass through z.
In this paper, we evaluate various methods for reconstructing the development of academic research.
We examine methods utilizing single-score centralitybased methods such as PageRank and node betweenness, as well as variants of main path analysis.
Starting from the given paper, we greedily choose
the next node with the highest node betweenness
centrality for our main path.
Baselines:
Main path analysis is a network analysis method commonly used to find knowledge diffusion structures
in research fields through identifying a series of con-
Single-Score Importance
PageRank
Path Analysis
nected nodes with the maximum connectivity.° Main
The famous PageRank algorithm!’ utilizes the intuition that important nodes in a graph are both linked
to by other important nodes as well as themselves link
to other important nodes. The PageRank equation
for any given node is:
rj =F
IJ
+a-p- n
Starting from the given paper, we greedily choose
the next node with the highest PageRank score for
our main path. It is worth noting that this is not the
typical use case for PageRank, which would most likely
give stronger results if it simply returned the nodes
with the highest PageRank scores in the subgraph.
However, doing so would not construct a direct lineage
of research development from the source paper. In
other words, in order to compare latter main path
analysis methods with our baselines, we must compare
lineages with lineages, instead of lineages with top
five raw values.
Node
Main
Betweenness
The betweenness centrality for node is the probability
that a shortest path passes through it. This measure captures the influence of a node over the flow
of information between other nodes,! and thus may
prove especially fruitful for discovering the lineage of
academic knowledge. A node’s betweenness centrality
can be calculated using:
Chet (a) =
kh
U,27,đy;0
Cyx( a)
a
YZ
13Page et al., “The PageRank Citation Ranking”
14Girvan and Newman, “Community Structure in Social and
Biological Networks.”
path analysis consists of two major algorithmic components: computing edge traversal counts and path
search.
Traversal
Counts:
Search
Path
Count
There are many different types of edge traversal counts
commonly used with main path analysis, such as
Search Path Count (SPC) and Search Path Link Count
(SPLC). Most of these types yield similar results in
practice, but previous literature suggests that search
path count (SPC) provides additional favorable properties and therefore was the most preferred and widely
used.!6
Thus, we adopt SPC as our first type of traversal
count. Notably, this choice required implementing
SPC from scratch in Python, as there were no previous implementations that were easily accessible and
compatible with SNAP.
The SPC value for a given edge is the number of times
it is traversed during all possible paths from source to
destination nodes. Manually computing all possible
paths in a graph is computationally expensive, but
fortunately Batagelj!” devised an efficient algorithm to
compute the SPC values of all edges in O(# of edges)
time.
Using the same notation as Batagelj, let aRb represents an edge from node a to b. We define two new
quantities:
»
-p,_
JA,
)
i
7
u=s
NT
(v),
otherwise
15Xiao et al., “Knowledge Diffusion Path Analysis of Data
Quality Literature.”
16 Xiao et al.
1’Batagelj, “Efficient Algorithms
ysis.”
for Citation Network Anal-
Where N~(u) denotes the number of paths from the
source node s to node u.
N †(u)
6)
=4
a destination node (i.e., a paper with no out-links in
u=t
`
lo
Nt(v),
otherwise
Where N*(u) denotes the number of paths from v to
a destination node t (nodes with no out-links).
Cycles
in the Citation Network
In theory, citation networks are DAGs.
However,
anomalies in the dataset (i.e., revisions to papers after
publishing) prevent real world citation networks from
being acyclic. This has negative consequences on SPC
in particular, which requires the graph to be acyclic.
Unfortunately, detecting and removing all cycles in
a graph is extremely expensive. To try and mitigate
the effects of cycles, we create a validation method
that resolves all bidirectional edges between any pair
of nodes. To do so, we utilize MAG API requests to
compare the dates of the two nodes and remove the
edge from the older paper to the newer paper.
While this validation improves performance of SPC,
it still does not remedy the situation completely. For
this reason, we turn towards a second method of
computing edge weights.
Traversal
Counts:
Edge
Betweenness
Edge betweenness measures the number of shortest
paths passing over a given edge in the graph. This
measure specifically gives great weight to edges that
connect communities and if removed would most disrupt the graph’s underlying structure. We believe
that this measure may apply well to the case of citation networks, in which important papers can serve as
centralizing nodes that connect different subfields and
related works together. Importantly, to calculate edge
betweenness we use SNAP’s built-in method that is
robust to cyclic graphs.
Path
under consideration), this search greedily follows the
edge with the greatest traversal count until it reaches
Search
Unlike for traversal counts, different path search methods can yield significantly different results. There are
three common techniques for constructing the main
path: local search, global search and key-route search.
For the purposes of this project, we focus on local
search. Starting from the source node (i.e., the paper
the graph). The papers that the search encountered
during its traversal make up the main path, which are
then reported as the foundational papers.
Finally, with the list of unique paper IDs identified
by main path analysis, we utilize API requests to
Microsoft Academic to retrieve the papers’ titles and
years. Thus, the final output of the algorithm is a
list of papers that are easily human readable and
interpretable.
Evaluation
Framework
We devised a quantitative evaluation framework that
could characterize our methods and assess their performance. To do this, we framed our methods as a
“recommender system” and pitted them against human and algorithmic baselines. In pursuit of this goal,
we created the following evaluation framework:
1. Choose a paper from the Microsoft Academic
Graph
2. Manually identify the paper’s top five “most foundational papers”
3. Find the recommended foundational papers for
each of the baselines and methods outlined above
4. Compare the recommended papers with the
ground truth papers and count the number of
matches
We implemented this evaluation framework on three
papers:
1. node2vec:
works!®
2. Network
Scalable
Embedding
Feature
as
Learning
Matrix
for Net-
Factorization:
Unifying DeepWalk, LINE, PTE, and node2vec!?
3. Values Are a Good Thing in Conservation Biology20
In manually identifying papers, however, we realized
the difficulty of the task for a non-expert non-author
person to identify lineages or foundational papers. A
key aspect of lineages and foundational papers is that
they need not be direct citations and also depend
heavily on their location within the academic graph.
If we find a paper that is both cited cited by every
other direct citation of another paper, that paper is
likely very foundational, but it is exceedingly difficult
18Grover and Leskovec, “Node2Vec.”
19Qiu et al., “Network Embedding as Matrix Factorization.”
20Noss, “Values Are a Good Thing in Conservation Biology.”
BFS Parameters
( (SPC)
MPA
2 levels, out-links
2 levels, out- and in-links
3 levels, out-links
Table 1: “node2vec:
BFS Parameters
MPA
(Edge Betweenness)
2
3
0
( (SPC)
2 levels, out-links
2 levels, out- and in-links
3 levels, out-links
MPA
(Edge Betweenness)
2
1
0
0
0
0
Table 2: “Network Embedding as Matrix Factorization:
BES Parameters
2 levels, out-links
2 levels, out- and in-links
3 levels, out-links
MPA
(SPC)
Node Betweenness
1
0
0
1
0
0
0
0
0
Scalable Feature Learning for Networks”
MPA
PageRank
MPA
PageRank
Node Betweenness
0
0
0
1
0
0
Unifying Deepwalk, Line, PTE, and node2vec”. 3
(Edge Betweenness)
2
1
1
(Grover & Leskovec, 2016).
1
2
2
PageRank
Node Betweenness
1
0
0
1
1
1
Table 3: “Values Are a Good Thing in Conservation Biology” (Noss, 2007).
for a non-expert reader to identify. We have ideas
for how to better frame quantitative analysis of such
methods that we discuss in our future work section.
Thus, we decided to reframe our evaluation as qualitative and focus it on identifying key characteristics
between different methods and parameters. This analysis must be qualitative because it is hard to define
exactly what lineages are and what results are “good”.
We focus more on what our methods are doing and
what properties of the citation network they seem to
be highlighting.
Results
The following tables show the results of running the
evaluation framework on the three aforementioned
papers for BFS graphs of 2 levels following only outlinks, 2 levels following both out- and in-links, and 3
levels following only out-links were computed.
We have also listed each method’s specific recommendations for each of the three aforementioned papers
in the attached appendix.
Discussion
Looking at the quantitative results, we notice two
distinct trends emerge from the data. First, the BFS
graph for 2 levels following only out-links has the
highest number of total matches for all three papers. We believe this may be due in part to the
fact that shorter hop BFS graphs capture more accurately paper-specific neighborhoods, thus emphasizing
papers that are of high importance in relation to the
source paper.
However, we also acknowledge that this result may
be due to a faulty evaluation method. When curating the “ground truth” foundational papers for the
three papers in the test set, there is most likely a
strong bias towards choosing papers that appear in
the given paper’s direct references, as those will be
the papers whose ideas are most strongly cited on first
read. Thus, the chosen ground truth papers are more
biased towards a paper’s direct references rather than
its indirect, transitive references, which will serve to
bias the methods’ performance to the smaller BFS
subgraphs. We will discuss improvements to the evaluation method in the future work section.
Secondly, MPA using SPC achieves the highest number of total matches across all three papers with 9 total
matches. This result is promising, even when using a
non-robust evaluation metric, and can also be corroborated by the qualitative results (see Appendix). For
Method
MPA
Total # Matches
(SPC)
MPA
(Edge Betweenness)
9
% of Total Matches
5
42.9%
23.8%
PageRank
Node Betweenness
2
9.5%
5
23.8%
Table 4: Total number of correct matches for each network analysis method.
BFS
Parameters
Total # Matches
% of Total Matches
12
8
4
50.0%
33.3%
16.7%
2 levels, out-links
2 levels, out- and in-links
3 levels, out-links
Table 5: Total number of correct matches for each BFS subgraph type.
example, for the paper “Network Embedding as Matrix Factorization: Unifying DeepWalk, LINE, PTE,
and node2vec” (Qiu et al., 2018) using the BFS subgraph on two levels following only out-links, the main
path constructing using SPC traversal counts captures three of the methods mentioned in the paper
title. It further includes papers on representation
learning and dimensionality reduction, which are both
foundational concepts utilized in the paper. Similar
qualitative analysis of the other BFS subgraphs of
two levels following only out-links produces similarly
strong results.
In comparison, choosing nodes on the main path based
on highest PageRank scores performs the worst. This
result can be explained in one part by the unconventional use of PageRank in choosing the next node
for the main path, as well as by the BFS subgraph
sometimes only being constructed on out-links. Furthermore, taking a qualitative look at the PageRank
results, it is often derailed from the intuitive “main
path” by picking papers that have high importance
but are so far removed from the given paper that
the link between the two can be hard to interpret.
One can see this quantitatively by the fact that the
PageRank paths are on average shorter than the paths
produced by other methods.
It is worth noting, however, that almost all the methods do not perform as well when used on larger BFS
subgraphs or BFS subgraphs that follow in-links. In
particular, following in-links proves a difficult challenge as it only requires a few popular papers with
hundreds or even thousands of citations to blow up
the BFS subgraph dramatically. It was for this reason
that a BFS subgraph of three levels following both inand out-links was not feasible for this paper, as while
we could extract the subgraphs successfully (which
generally had around 1.5 million to 3 million nodes),
the methods would take enormous amounts of time
to complete.
Overall, while the results are not definitive in proving
that MPA is strictly better than any existing meth-
ods, preliminary quantitative and qualitative analysis
of the produced paths provides evidence for the potential of MPA using SPC and node betweenness in
constructing development trends of academic research.
In particular, we show that MPA offers information
that is different and complementary to that traditionally provided by citation recommendation systems
through its creation of lineages of connected academic
works specific to the given paper rather than collections of generally important works in a field.
Furthermore, our paper contributes a novel application of MPA to the MAG, which offers a promise for
identifying structures of academia for any field or concept contained in the dataset. Ultimately, we hope to
provide one step forward in the pursuit of increasing
accessibility to research and academia for all.
Future
Work
As mentioned above, quantitative evaluation of any
methods designed to understand the foundations and
lineages of papers must find some representation of
a ground truth. However, such ground truth measures are difficult for non-experts to formulate and
even define. We believe that there is room for an
empirical study to help determine what the ground
truth development structures are for certain papers,
which would necessitate going to domain experts and
surveying them to hear their ideas of what influence
a given paper the most.
We anticipate that actually defining “foundational”
papers and “lineages” of papers in a consistentlyinterpreted way will be a challenge. Any study would
Neuroscience 28, no. 45 (November 5, 2008): 11433-4.
https: //doi.org/10.1523 /JNEUROSCI.0003- 08.2008.
need to address these vague concepts with clear definitions that could be interpreted in the same manner
by the authors surveyed. A study like this would
allow for some ground-truth data on what our algorithms should be looking for when we seek to identify
foundational papers.
Broder, Andrei, Ravi Kumar, Farzin Maghoul, Prabhakar Raghavan, Sridhar Rajagopalan, Raymie Stata,
Andrew Tomkins, and Janet Wiener. “Graph Structure in the Web.” Computer Networks, 2000, 12.
This project is also meant as a starting point for studies of interdisciplinary academic structure that require
working with a comprehensive citation network. This
opens the door for research that seeks to determine
to what extent do different disciplines interact with
each other and identify “filter-bubbles” where different
disciplines might argue over the same concept without ever interacting with the literature, and academic
lineages, of their opponents.
Calero-Medina, Clara, and Ed C. M. Noyons. “Combining Mapping and Citation Network Analysis for a
Better Understanding of the Scientific Development:
The Case of the Absorptive Capacity Field.” Journal
of Informetrics 2, no. 4 (October 1, 2008):
https: //doi.org/10.1016/j.joi.2008.09.005.
272-79.
Girvan, M., and M. E. J. Newman.
“Community
Structure in Social and Biological Networks.” Proceedings of the National Academy of Sciences 99, no.
12 (June 11, 2002): 7821-6. https://doi-org/10.1073/
pnas. 122653799.
Finally, there remains much potential for improvement
of the methods used in this paper.
For example,
adapting SPC to handle cyclic graphs or applying
an efficient method for removing cycles may boost
its performance. Additionally, MPA using SPC and
edge betweenness tends to produce main paths of long
lengths, and thus discouraging this behavior using
damping or weighting nodes by their marginal gain
(i.e., the number of unique papers they add in a set
cover) may help with condensing the results.
Grover, Aditya, and Jure Leskovec. “Node2Vec: Scalable Feature Learning for Networks.” In Proceedings
of the 22Nd ACM
SIGKDD
International
Confer-
ence on Knowledge Discovery and Data Mining, 855-
64. KDD 716. New York, NY, USA: ACM,
https: //doi.org/10.1145/2939672.2939754.
2016.
Herrmannova, Drahomira, and Petr Knoth.
“An
Analysis of the Microsoft Academic Graph.” D-Lib
Contributions
Magazine 22, no. 9/10 (September 2016). https:
//doi.org/10.1045/september2016-herrmannova.
Kristine: implemented graph validation, search path
count, main path analysis, and evaluation framework
“Impact
(Jupyter notebooks), running tests, tables
Jack: problem formulation, implemented BFS and
hashing system in Go, constructed datasets using that
system on free trial cloud time, identified papers for
evaluation, typesetting
Factor - Clarivate.”
Accessed
October
18,
2018. /.
Kyrola, Aapo, Guy Blelloch, and Carlos Guestrin.
“GraphChi: Large-Scale Graph Computation on Just
a PC,” n.d., 16.
Liu, John S., and Louis Y. Y. Lu. “An Integrated
Approach for Main Path Analysis: Development of the
Hirsch Index as an Example.” Journal of the American
Society for Information Science and Technology 63,
Code
no. 3 (March 1, 2012):
1002 /asi.21692.
https: //github.com/jackbeasley /CS224W
528-42.
/>
References
Noss, Reed F. “Values Are a Good Thing in Conservation Biology.” Conservation Biology 21, no. 1 (February 1, 2007): 18-20. https://doi-org/10.1111/j.15231739.2006.00637.x.
Batagelj, Vladimir. “Efficient Algorithms for Citation
Network Analysis,” September 13, 2003. http://arxiv.
Page, Larry, Sergey Brin, R. Motwani, and T. Winograd. “The PageRank Citation Ranking: Bringing
Order to the Web,” 1998.
Bergstrom, Carl T., Jevin D. West, and Marc A.
Wiseman. “The Eigenfactor™ Metrics.” Journal of
Qiu, Jiezhong, Yuxiao Dong, Hao Ma, Jian Li,
Kuansan Wang, and Jie Tang. “Network Embedding
as Matrix Factorization: Unifying DeepWalk, LINE,
org/abs/cs/0309023.
10
node2vec:
Scalable
Feature
Learning for Networks (Grover & Leskovec,
PTE, and Node2vec.” Proceedings of the Eleventh
ACM International Conference on Web Search and
Data Mining - WSDM ’18, 2018, 459-67.
https:
//doi.org/10.1145/3159652.3159706.
2016)
BFS
Roy, Amitabha, Ivo Mihailovic, and Willy Zwaenepoel.
“X-Stream: Edge-Centric Graph Processing Using
Streaming Partitions.” In Proceedings of the TwentyFourth ACM Symposium on Operating Systems Principles - SOSP 718, 472-88. Farminton, Pennsylvania:
ACM Press, 2013. />2522740.
Sinha,
Arnab,
Zhihong
Shen, Yang
Song,
Hao
1. grarep learning graph representations with global
structural information (2015)
2. line large scale information network embedding
(2015)
Ma,
3. deepwalk online learning of social representations
(2014)
4.
and Applications.” In Proceedings of the 24th International Conference on World Wide Web - WWW
715 Companion, 243-46. Florence, Italy: ACM Press,
tives (2013)
for nonlinear di-
mensionality reduction (2000)
6. image representations for visual learning (1996)
“The Opposite of a Bloom Filter — Something Similar,”
Main Path Analysis (Edge Betweenness)
May 21, 2012. />2012/05/21/the-opposite-of-a-bloom-filter /.
1. community detection in graphs (2010)
2. chemical oscillations waves and turbulence (1984)
Probabilistic
Data
Structures
Continuous,
Unbounded Streams.:
2018.
representation learning a review and new perspec-
5. a global geometric framework
2015. />
Tylertreat/BoomFilters,
tylertreat /BoomFilters.
(1395 nodes, 1684 edges):
Main Path Analysis (SPC)
Darrin Eide, Bo-June (Paul) Hsu, and Kuansan Wang.
“An Overview of Microsoft Academic Service (MAS)
Treat,
Tyler.
for Processing
Graph
2 levels, following only out-links
/>
PageRank
1. nonlinear dimensionality reduction by locally lin-
ear embedding (2000)
Xiao, Yu, Louis Y. Y. Lu, John S. Liu, and Zhili
Zhou. “Knowledge Diffusion Path Analysis of Data
Quality Literature: A Main Path Analysis.” Journal
of Informetrics 8, no. 3 (July 1, 2014): 594-605.
2. learning
the parts
of objects
matrix factorization (1999)
https: //doi.org/10.1016 /j.joi.2014.05.001.
Node
by non
negative
Betweeness
1. deepwalk online learning of social representations
(2014)
2.
Appendix
representation learning a review and new perspec-
tives (2013)
3. a global geometric framework
This appendix contains the results
paths of academic research from
mentioned in the paper. The four
were MPA using SPC, MPA using
PageRank, and node betweenness.
mensionality reduction (2000)
from constructing
the three papers
methods utilized
edge betweenness,
for nonlinear di-
4. independent component analysis a new concept
(1994)*
BFS
Graph
(1395 nodes, 1684 edges):
2 levels, following only out-links
Sometimes, the maximum value for the weight of an
outgoing edge or neighboring node is 0, in which case
the next node in the path is chosen arbitrarily from all
the neighbors of the previous node. This case results
from failing due to cycles in the graph (i.e., MPA
using SPC) or other anomalies. These edges/nodes
Main Path Analysis (SPC)
1. community detection in graphs (2010)*
2. random walks markov processes and the multiscale modular organization of complex networks
(2014)*
are denoted in the results with an asterisk (*).
11
Main Path Analysis (Edge Betweenness)
3. relational learning via latent social dimensions
(2009)
. community detection in graphs (2010)
4. using ghost edges for classification in sparsely
. the principal components analysis of a graph and
labeled networks (2008)
5. semi supervised learning literature survey (2006)
its relationships to spectral clustering (2004)
laplacian eigenmaps and spectral techniques for
6. self taught learning transfer learning from unla-
embedding and clustering (2001)
a global geometric
framework
mensionality reduction (2000)
beled data (2007)
for nonlinear di-
7. reducing the dimensionality of data with neural
networks (2006)
perceptual cognitive universals as reflections of
8. a fast learning
the world (1994)
(2006)
algorithm
for deep
belief nets
9. justifying and generalizing contrastive divergence
(2009)
10. semantic hashing (2009)
PageRank
1. nonlinear dimensionality reduction by locally lin-
11. revl a new benchmark collection for text catego-
ear embedding (2000)
2, image representations for visual learning (1996)
rization research (2004)
12. machine learning in automated text categoriza-
tion (2002)
Node
13. enhanced hypertext categorization using hyper-
Betweeness
links (1998)
1. community detection in graphs (2010)
2. random walk computation of similarities between
nodes of a graph with application to collaborative
14. on the foundations
cesses (1987)
of relaxation
labeling
pro-
15. relaxation and constrained optimization by local
recommendation (2007)
processes (1979)
laplacian eigenmaps and spectral techniques for
embedding and clustering (2001)
normalized cuts and image segmentation (2000)*
PageRank
1. nonlinear dimensionality reduction by locally lin-
BFS
Graph
ear embedding (2000)
(19854 nodes, 38148 edges):
2. dimension reduction by local principal component
3 levels, following only out-links
analysis (1997)
3. replicator neural networks for universal optimal
Main Path Analysis (SPC)
source coding (1995)
1. a large scale evaluation of computational protein
4. the wake sleep algorithm for unsupervised neural
function prediction (2013)
networks (1995)
2. analysis of protein function and its prediction
from amino acid sequence (2011)
3. annotation error in public databases misannota-
Node
tion of molecular function in enzyme superfami-
Betweeness
. community detection in graphs (2010)
lies (2009)
. the structure and function of complex networks
. protein function prediction the power of multi-
(2003)
statistical mechanics of complex networks (2001)
plicity (2009)
network based prediction of protein function
(2007)
cfinder locating cliques and overlapping modules
clustering and preferential attachment in growing
networks (2001)
the structure of scientific collaboration networks
in biological networks (2006)
(2001)
cytoscape a software environment for integrated
models of biomolecular interaction networks
structural cohesion and embeddedness a
SOON
(2003)*
Main Path Analysis (Edge Betweenness)
1. community detection in graphs (2010)
2. microscopic evolution of social networks (2008)
photon cross sections attenuation coefficients and
energy absorption coefficients from 10 kev to 100
gev (1969)*
12
hierar-
chical concept of social groups (2003)
models of core periphery structures (2000)
optimization by simulated annealing (1983)
solvable model of a spin glass (1975)
Network Embedding as Matrix Factorization: Unifying DeepWalk, LINE,
PTE, and node2vec (Qiu et al., 2018)
BFS
Graph
4. imagenet classification with deep convolutional
neural networks (2012)*
BFS Graph (47035 nodes, 55686 edges):
2 levels, following both out-links and in-links
(1155 nodes, 1571 edges):
2 levels, following only out-links
Main Path Analysis (SPC)
Main Path Analysis (SPC)
1. network embedding as matrix factorization uni-
fying deepwalk line pte and node2vec (2018)
1. network embedding as matrix factorization uni-
fying deepwalk line pte and node2vec (2018)
inductive representation learning on large graphs
. inductive representation learning on large graphs
~
(2017)
structural deep network embedding (2016)
(2017)
community preserving network embedding (2017)
node2vec scalable feature learning for networks
grarep learning graph representations with global
(2016)
line large scale information network embedding
structural information (2015)
structural information (2015)
grarep learning graph representations with global
(2015)
line large scale information network embedding
deepwalk online learning of social representations
(2015)
representation learning a review and new perspec-
(2014)
nonlinear dimensionality reduction by locally lin-
(2011)
(2014)
deepwalk online learning of social representations
tives (2013)
leveraging social media networks for classification
ear embedding (2000)
empirical comparison of algorithms for network
community detection (2010)
10. community detection in graphs (2010)
11. a tutorial on spectral clustering (2007)
12. random walk computation of similarities between
nodes of a graph with application to collaborative
Main Path Analysis (Edge Betweenness)
1. network embedding as matrix factorization uni-
fying deepwalk line pte and node2vec (2018)
recommendation (2007)
representation learning a review and new perspec-
13. normalized cuts and image segmentation (2000)
14. spectral graph theory (1996)
1ã. asymptotic analysis of a random walk on a hy-
tives (2013)
modeling pixel means and covariances using fac-
torized third order boltzmann machines (2010)
percube with many dimensions (1990)
PageRank
Main Path Analysis (Edge Betweenness)
1. network embedding as matrix factorization uni-
1. network embedding as matrix factorization uni-
fying deepwalk line pte and node2vec (2018)
fying deepwalk line pte and node2vec (2018)
mining multi label data (2009)
2; deepwalk online learning of social representations
(2014)
3. efficient estimation of word representations in
vector space (2013)
hypergraph spectral learning for multi label clas-
sification (2008)
spectral graph theory (1996)
4. linguistic regularities in continuous space word
asymptotic analysis of a random walk on a hy-
representations (2013)
Node
percube with many dimensions (1990)
PageRank
Betweenness
1. network embedding as matrix factorization uni-
1. network embedding as matrix factorization uni-
fying deepwalk line pte and node2vec (2018)
wh
2. deepwalk online learning of social representations
(2014)
3. representation learning a review and new perspec-
fying deepwalk line pte and node2vec (2018)
normalized cuts and image segmentation (2000)
spectral graph theory (1996)
asymptotic analysis of a random walk on a hy-
percube with many dimensions (1990)
tives (2013)
13
Node
4. a fast learning
Betweenness
(2006)
1. network embedding as matrix factorization uni-
tives (2013)
7. semi supervised learning using gaussian fields and
3. natural language processing almost from scratch
(2011)
4. feature rich part of speech tagging with a cyclic
8.
9.
10.
11.
dependency network (2003)
5. text categorization based on regularized linear
classification methods (2001)*
are a Good
Thing
tion Biology (Noss, 2007)
3 levels, following only out-links
in Conserva-
BFS Graph (164 nodes, 171 edges):
2 levels, following only out-links
Main Path Analysis (SPC)
1. network embedding as matrix factorization uni-
fying deepwalk line pte and node2vec (2018)
Main Path Analysis (SPC)
2. a unifying theorem for spectral embedding and
3. nonlinear component
harmonic functions (2003)
normalized cuts and image segmentation (2000)
spectral graph theory (1996)
spectra of graphs (1980)
matrix iterative analysis (1962)*
Values
(17866 nodes, 34040 edges):
clustering (2003)
1. values are a good thing in conservation biology
(2007)
analysis as a kernel eigen-
2. ecology values and objectivity advancing the de-
value problem (1998)*
4. support vector networks (1995)*
bate (2005)
3. beyond biology toward a more public ecology for
conservation (2001)
4. method
(1993)
Main Path Analysis (Edge Betweenness)
1. network embedding as matrix factorization uni-
fying deepwalk line pte and node2vec (2018)
in ecology
strategies
for conservation
Main Path Analysis (Edge Betweenness)
2. representation learning a review and new perspec-
tives (2013)
1. values are a good thing in conservation biology
3. bayesian and 11 approaches to sparse unsuper-
(2007)
vised learning (2011)
4. mixed membership stochastic blockmodels (2008)
model based clustering for social networks (2007)
6. bayesian cluster analysis (1978)
2. beyond biology toward a more public ecology for
conservation (2001)
€t
3. cultural
sustainability
ecology (1997)
PageRank
aligning
and
1. values are a good thing in conservation biology
fying deepwalk line pte and node2vec (2018)
2. spectral graph theory (1996)
spectra of graphs (1980)
4. algebraic connectivity of graphs (1973)
(2007)
2. advocacy and credibility of ecological scientists in
oe
resource decision-making a regional study (2003)
3. entering the century of the environment
social contract for science (1998)
a new
Betweenness
Node
1. network embedding as matrix factorization uni-
fying deepwalk line pte and node2vec (2018)
2.
aesthetics
PageRank
1. network embedding as matrix factorization uni-
Node
belief nets
(2009)
6. scaling learning algorithms towards ai (2007)
2. representation learning a review and new perspec-
Graph
for deep
5. justifying and generalizing contrastive divergence
fying deepwalk line pte and node2vec (2018)
BFS
algorithm
Betweenness
1. values are a good thing in conservation biology
(2007)
representation learning a review and new perspec-
tives (2013)
3. learning deep architectures for ai (2009)
2. beyond biology toward a more public ecology for
conservation (2001)
14
3. implications of current ecological thinking for
biodiversity conservation a review of the salient
3. compass and gyroscope integrating science and
politics for the environment (1993)*
issues (2005)
4. beyond biology toward a more public ecology for
BFS Graph (5696 nodes, 6430 edges):
2 levels, following both out-links and in-links
conservation (2001)
5. the natural imperative for biological conservation
(2000)
Main Path Analysis (SPC)
6. current
(1999)
1. values are a good thing in conservation biology
normative
concepts
in
conservation
(2007)
7. cross scale morphology geometry and dynamics
bate (2005)
8. large scale management experiments and learning
conservation (2001)
9. adaptive environmental assessment and manage-
of ecosystems (1992)
2. ecology values and objectivity advancing the de-
by doing (1990)
3. beyond biology toward a more public ecology for
4. a science
for survival values
biology (1996)
5. a sand county almanac (1949)
and
ment (1978)
conservation
Main Path Analysis (Edge Betweenness)
1. values are a good thing in conservation biology
Main Path Analysis (Edge Betweenness)
(2007)
2. beyond biology toward a more public ecology for
1. values are a good thing in conservation biology
conservation (2001)
3. classification of natural communities (1977)
4. life zone indicators in california (1919)
(2007)
2. beyond biology toward a more public ecology for
conservation (2001)
3. the appearance of ecological systems as a matter
of policy (1992)
4. a sand county almanac (1949)
PageRank
1. values are a good thing in conservation biology
(2007)
2. the obligations of a biologist (1989)
PageRank
1. values are a good thing in conservation biology
(2007)
2. a sand county almanac (1949)
Node
Betweenness
1. values are a good thing in conservation biology
(2007)
Node
2. beyond biology toward a more public ecology for
Betweenness
conservation (2001)
1. values are a good thing in conservation biology
(2007)
2. beyond biology toward a more public ecology for
conservation (2001)
3. a science
for survival values
and
conservation
biology (1996)
4. the obligations of a biologist (1989)*
BFS Graph (3065 nodes, 3460 edges):
3 levels, following only out-links
Main Path Analysis (SPC)
1. values are a good thing in conservation biology
(2007)
2. ecology values and objectivity advancing the de-
bate (2005)
15