Cs224W 2018 50
Bạn đang xem bản rút gọn của tài liệu. Xem và tải ngay bản đầy đủ của tài liệu tại đây (6.26 MB, 11 trang )
Community Detection and Evolution in Temporal Networks
Rohan Badlani, Kevin Culberg, Zhilin Jiang
,
,
zjiang23@stanford. edu
Abstract
The tasks of community detection in networks is well studied for static graphs. However, many social
and other real world networks include a time component that is not always considered in these analysis
techniques. Incorporating time as a descriptor for edges in a graph has the potential to significantly
increase the quality and type of observations that can be made about how community structure or
quality changes over time. By making modifications to network analysis techniques and applying methods
specialized for temporal networks it is possible to improve the quality of community metrics. We set out
to measure and compare the quality and structure of communities in a question-and-answer temporal
network and analyze how the communities evolve over time.
Keywords:
Evolution
1.
Network Analysis, Temporal Graphs, Community Detection, Temporal Community
Introduction
We set out to measure the
network as they evolve over
on a temporal network. To
including all activities that
subset of the original graph
slice interval and the nodes
quality and structure of communities in a question-and-answer temporal
time as well as compare and contrast various community detection methods
accomplish this task, we will divide the network into graph snapshots, each
occurred in a time slice interval p; = (to, t;]. Each graph snapshot will be a
and will contain only edges with a time stamp that falls within that time
connected to one of these edges.
Community quality will be evaluated by calculating various metrics related to the structure of the
community at each time slice. One overall evaluation metric for community health will be the timeweighted conductance of the community which applies greater importance to edges present in more
recent time slices in section 5.2. These and other values will then be compared for each community
across the time slices in order to measure how community structure changes over time. We will also use
multiple algorithms to detect communities at each time slice. These algorithms will then be compared by
measuring the conductance for the communities generated under each community detection algorithm.
1.1. Hypotheses
We hypothesize that the conductance value for the graph will decrease over time, indicating stronger
communities more focused on their area of the question-and-answer network. We also hypothesize that
community detection methods that take into account weighted edges (such as the Leiden algorithm),
with edge weights dependent on the time stamp, will perform better than unweighted methods such as
FastGreedy (the Clauset-Newman-Moore Algorithm).
2.
Related
Work
2.1. Community Detection
A network community is a group of nodes with more and better interactions among themselves than
the remaining nodes in the network. Generally, real world networks exhibit communities because the
interactions in real world is organized into societies, groups of people and objects interacting with one
another.
Community detection has been an active area of research and there are many methods for community
detection. Girvan and Newman [1] and Kannan et al. [2] provide a good empirical analysis on community detection techniques. In particular, the Louvain Method for community detection [3] provides a
fast algorithm for community detection in static networks, but is not able to detect communities with
overlapping membership without modifications. The Leiden method of community detection is another
technique that does have the advantage of finding good quality communities in a more time-efficient way.
[4]
To indicate the goodness of a community, Leskovec et al. [5] define the conductance of a set of nodes
S in a given static graph G as
0(5) =
Dieses Aaj
min{A(5), A(5)}
where A is the adjacency matrix of graph G, and A(S) =
ies jeV Ajj.
2.2. Temporal Networks
Interactions between objects and people in the real world generally occur at specific time and hence realworld graphs tend to be more temporal in nature. Temporal graphs capture the concept of time within the
graph either through time-stamped edges or representing as a sequence of time-stamped graphs. Newman
[6] presents link based techniques for community detection while [7] focuses on node-based techniques.
Most of the analysis on community
graphs.
detection are however in the past has been focused towards static
Since most of the networks in real-world (citation networks, question-answer networks) are temporal in
nature, there has been research on both structural and content based techniques for community analysis in
such temporal networks. The work by Appel et al. [8] manages to achieve superior community prediction
by extracting the structure of the network in a way that preserves the temporal information.
Paranjape et al. [9] defines the concept of 6-temporal motifs, extending the conventional graph motif
concept to temporal graphs by restricting the maximum range of time stamps to 6 for all edges within a
motif. A fast algorithm is also proposed to efficiently detect and count 6-temporal motifs for any given
temporal graph.
2.2.1.
Critique
It is clear that the addition of time to a graph increases the amount of interesting observations
be made, but also increases the relative complexity in evaluation. Dividing the network into
graph snapshots which include only the edges for a specific time period appears to be an efficient
between removing complexity from the network while still maintaining temporal information for
Limiting the comparison between snapshots to those that are close in time also enables easier
by focusing on the differences between subsequent snapshots.
that can
separate
balance
analysis.
analysis
6 Month Graph Timeslice Nodes
6 Month Graph Timeslice Edges
16000
14000
=% 12000
10000
=
©
8000
=
6000
2Y
Z
350000
300000
4$, 250000
5
% 200000
2
2&
E
150000
4000
= 400009
2000
50000
0
0
0
1
2
3
4
5
6
7
8
9
10
11
0
1
2
3
4
Timeslice
6 Month Graph Timeslice Clustering
Coefficient
0.014
4
= 35
S 001
ö 0.008
Ss
925
2
S
E
5
šb0 0.006
9
10
11
3
#1
&0s5
a
0
12
3
4
5
6
7
8
9 10 11
0
0
1
2
3
Timeslice
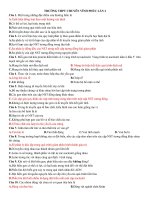
Figure 1: Network statistics for the first six months
created at approximately two week time intervals.
3.1.
8
x
0002
0
3.
7
ở 15
% 0.004
©
6
6 Month Graph Timeslice Estimated
Diameter
£ 0012
2
5
Timeslice
4
5
6
7
8
9
10 11
Timeslice
of the Stack
Overflow
temporal
network
with
subgraph
time
slices
Data
Dataset
We use the Stack Overflow Temporal Network dataset from the Paranjape et al. [9] research paper. The
dataset includes three types of user interactions (answer-to-question, comment-to-question, comment-toanswer) as directed edges (u,v,t), each indicating an interaction from user u to user v at UNIX time
stamp t, forming a directed temporal graph. The complete graph contains 2,601,977 nodes and 63,497,050
edges spanning over a 2,774-day period. We limited the total size of the network to only the first 6 months
of edges in order to ensure all experiments could be completed in time. We also eliminated all nodes
with combined degree less than or equal to 4 and the edges associated with those nodes. The resulting
subgraph totaled 14,994 nodes and 359,768 edges.
3.2.
Graph Representation
We will model the dataset as a directed graph with Stack Overflow users as nodes and edges will be
defined as below:
1. A > B if user A answered question of user B
2. A — B if user A commented on question of user B
3. A — B if user A commented on answer of user B
3.3. Time Slice Subgraphs
We collected summary statistics for each subgraph created for time slice sizes of approximately two weeks,
one month, and three months. Metrics calculated include number of nodes, number of edges (combining
multiple directed edges into a single directed edge), average clustering coefficient, and estimated graph
diameter. We determined that a time slice of approximately two weeks, Figure 1, would be the ideal
balance between enabling tracking of community structure changes over time while still having enough
nodes and edges to perform community detection. The largest subgraph formed will be the last time
slice which will include all nodes and edges in the first six months of the network. Incorporating activity
beyond the first six months was too much information for most community detection methods that we
evaluated on available computing resources.
4.
Methods
ha
4
4⁄
/Load Graph
\\
N
adirected
Multi-graph
\\
as \.
Vo
⁄4
mm
Split graph
›
\
Í
Clauset
Newman
Detection
(unweighted
Compute
Modularity
subgraphs to
define edge
weights
wt
Girvan
Newman
~
nh:
/
)
Louvain
& Leiden
Community
Spectral
Clustering
Community
Detection
(weighted)
Compute
rn
7
xPreprocess
`
Fast Greedy
Community
into
snapshots based
on time
Community
Detection
(weighted)
Detection
(weighted)
Compute
Weighted
Modularity
Weighted
Modularity
ND
oa
(
.
SS
Output: Best
|
Detection
Approach
)
Temporal
Community
Validate
Hypothesis
Weighted
Modularity
7
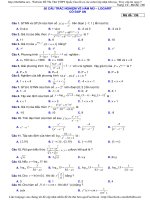
Figure 2: Project framework.
4.1.
Community Detection Algorithms and Mathematical Background
4.1.1.
Algorithms That Don’t Scale
1. Girvan-Newman Algorithm: Girvan-Newman algorithm is a top-down hierarchical community
detection algorithm proposed by Girvan and Newman [1] in 2002.
The algorithm starts from the full original graph, and iteratively removes the edge with highest
“betweenness” each time. This returns a dendrogram representing a hierarchical clustering structure
that can be used to divide the graph into communities, with controllable community number and
sizes.
According to analysis by Yang et al. [10], the time complexity of Girvan-Newman algorithm is
O(E?N). We applied the Girvan-Newman algorithm, but due to its large time complexity, this algorithm is unable to provide results efficiently in our subgraphs with
more than 2,865,000 edges.
2. Louvain Algorithm: Louvain Algorithm is a bottom-up hierarchical community detection algorithm proposed by Blondel et al. [3] in 2008. The algorithm is initialized from the original graph,
with each node as a distinct community of its own. Then the algorithm repeats its two phases
alternatively between modularity optimization and Community Aggregation. Although the Louvain algorithm is able to find high-quality clusters in most networks but this approach also leads
to couple of important flaws. Since the Louvain algorithm keeps moving nodes from one
cluster to another, at some point it may move a bridge node to a different cluster,
thereby breaking the connectivity of the original cluster.
Moreover, since the exact modularity optimization is NP-hard, this does not perform very well on a graph
like Stack Overflow because nodes (users) keep switching communities as the Louvain progresses.
Spectral Clustering: The spectral clustering algorithm can be broken down into three steps.
First, construct the matrix representation of the graph as the laplacian (L = D — A) where D is
the diagonal degree matrix with Dj; = >> j Aj; and A is the adjacency matrix. Second, compute
the eigenvalues and eigenvectors of the matrix representation L and use the ith value from each
eigenvector as the feature vector for node 7. Finally, these nodes that are now represented by a
feature vector can be clustered using clustering techniques such as k-means [11]. Spectral clustering
also supports using edges weighted by the time stamp associated with the edge.
The disadvantage of spectral clustering is that with the nodes of the order of 773,087 nodes in the
Stack Overflow subgraphs, this method consumes a lot of memory as the adjacency matrix
has to be in memory and the complexity is proportional to computing the inverse of
matrix to find the eigenvectors and hence is very inefficient for large graphs.
4.1.2.
Feasible Algorithms
. Clauset-Newman-Moore Algorithm (FastGreedy): FastGreedy is a bottom-up hierarchical
community detection algorithm proposed by Clauset et al. [12] in 2004. The algorithm is initialized
from the original graph, with each node as a distinct community of its own. Then the algorithm
starts merging communities, each time picking two communities to merge that generates the largest
graph modularity gain. The algorithm stops when merging any pair of two communities no longer
produces a positive modularity gain, and the final result is a dendrogram. Greedily taking the
largest modularity gain each iteration does not guarantee that a global optimum will be reached, so
this algorithm might not necessarily yield the best results as compared to other algorithms. According to analysis by Yang et al. [10], the time complexity of Clauset-Newman-Moore is O(N log2(N)).
This means FastGreedy is very time-efficient, but has less guarantee on quality of communities generated.
Leiden Algorithm: The Leiden Algorithm [4] is based on the Louvain algorithm described above
but is also able to split clusters instead of only merging them. By splitting clusters in a specific
way, the Leiden algorithm guarantees that clusters are well-connected. Moreover, the algorithm
guarantees more than this: if we run the algorithm repeatedly, we eventually obtain clusters that
are subset optimal. This means that it is impossible to improve the quality of the clusters by moving
one or more nodes from one cluster to another. This is a strong property of the Leiden algorithm.
It states that the clusters it finds are not too far from optimal. Also, rather than continuously
checking for all nodes in a network whether they can be moved to a different cluster, as is done in
the Louvain algorithm, the Leiden algorithm performs this check only for so-called unstable nodes.
As a result, the Leiden algorithm not only finds higher quality clusters than the Louvain
algorithm, but also does so in much less time.
5.
Time
based Weight
Metric
& Measuring
the Community
Quality
5.1. Edge Weight Functions
We used two types of weight functions (linear and exponential) calculated based on the time of the edge
being weighted compared to the first and last time stamp in the network. Edges that occurred further in
the past will be weighted to be less important for determining communities and measuring conductance
in the weighted case.
1. Linear Weight Function: The linear weight function linearly decreases the weight from the end
time stamp to the beginning. In order to avoid weights becoming 0, we use the Laplace smoothing.
Win (t)
=
(t
—
(Gag
tmin)
—
+
tin.)
1
+
2. Exponential Weight Function: The exponential weight
weight from the end time stamp to the beginning.
qulin
Wezp(t)
—
(t)
a=
—
(1)
1
function exponentially decreases the
(t=tmin)+1
|
q(maz—tmin)+l
—
#
—
|
—Ï
(2)
where a is a hyperparameter that we choose to be a = 10 for our experiments.
5.2. Time-Weighted Conductance
For any given set of nodes in a community S and time slice index P, we calculate the time-weighted
conductance using a weighted adjacency matrix as
P
ó(S, P)
—
.
mun
P
(Sho
À 2k=0 (S%es¿ez ain)
P
(Sresgev Aisin)
».".
(
with the weighted adjacency matrix defined as
te{t|(¿,7,)€EAt
where ty, is the time stamp of the end of the time slice pz, E is the set of edges, V is the set of nodes,
and w(t) denotes the weight function as discussed in section 5.1. Intuitively, more recent edges indicate
more up-to-date community relationships as compared to old edges.
5.3. Time Slice Community Comparison
The Stack Overflow Temporal Network does not contain ground-truth labels for community membership
over time. In order to determine community membership and evaluate how the community structure
changes over time we propose a method for comparing communities between different time slices. To
account for users (nodes) changing communities over time we will determine community membership
for incremental subsets of the graph based on time.
For example, to determine community
membership for for snapshot p, = [to,tn) we will calculate community membership using a subgraph
composed of only edges from the current and previous time slices [po, ..., Pn] which will contain all edges
with time stamp before „. In order to enforce consistent community labels between graph snapshots
we set the labels for each snapshot from |øo,...,p„| by greedily assigning each cluster from p; a label
corresponding with the community label from p;_; that maximizes the jaccard similarity between the set
of nodes belonging to those two communities. The communities in p; are assigned labels in order from
largest community to smallest. If the number of communities in p; is greater than p;_; then
a new label that has not been used previously is assigned. This method allows for the birth
and death of communities over time while maintaining the same label for communities with similar
membership across graph snapshots.
Algorithm 1 Algorithm Sanitize Communities:
To enforce community label consistency across timesteps
community Assignments[N][T] = community Detection(algorithm=Leiden)
sanitizedCommunity Assignment|0..N][0..7] < zeros|0..N][0..T]
for t= 1 to T do
#Sort communities by size
sortedCommunities = sorted(communities(t))
for i = 1 to sortedCommunities do
#Find Jaccard Similarity w.r.t. all communities in the previous timestep
jaccardSimilarity = sim(i, communities(t — 1))
#Greedy Step: Pick the one with max Jaccard Sim
newLabel = argmaz(jaccardSimilarity)
#Update Step: Update community labels
for j =0 to Ñ do
if community Assignments|j][¢] == 7 then sanitizedCommunity Assignment([j]|[t] = newLabel
end if
end for
end for
end for
6.
Framework
and Experiments
We propose a framework (Figure 2) that uses community detection algorithms to perform temporal
community detection.
We compare and contrast the communities detected in both unweighted and
temporally weighted edges (with linear and exponential weights) and evaluate the communities by their
time-conductance scores. The communities obtained from each algorithm and weighting function are
compared over time to test our hypothesis that community strength improves and how our weighted
metrics perform over time.
7.
Results & Analysis
7.1. FastGreedy vs Leiden
We applied both the FastGreedy and Leiden algorithms for community detection in order to compare the
communities produced. The FastGreedy algorithm is limited to undirected and unweighted graphs. In
order to better compare FastGreedy algorithm with the Leiden algorithm, which can detect communities
in weighted subgraphs, we ran Leiden with unweighted edges. The Leiden algorithm produces communities of more consistent sizes that have similar values of conductance and clustering coefficients. As we can
Community Evolution - Community Size (FastGreedy/ None)
Community Evolution - Conductance (FastGreedy/ None)
>
——
—
—
103
°
a
2
2 10?
Ẹ
ổ
—
re
2
6
7
8
17
z8
zn
278
359
368
101
0
2
ì
4
6
8
Cumulative Time Slice #
ỗ
5
7
oo
215
©
a
2
3
ề
8
= 102
2
Ệ
ổ
101
2
4
6
8
Cumulative Time Slice #
10
0
Community Evolution - Conductance (Leiden / None)
08
sự
7
—°
„i06
g
fos
3
15
2
»
2
3»
8 04
0.14
1
2
5
2
6
Cumulative Time Slice #
10?
8
ed
-# 4L
10!
0.02
10
06
3
g
gos
8
;
9
oa
s10?
_-đ%
101
5
7
40
- 41
2
4
6
Cumulative Time Slice #
10
10
2
8.045,
2
3
9
F 0.10
25
0.05
000
2
4
6
8
Cumulative Time Slice #
10
08
0
07
i06
g
Đ
oe
gos
4
5
6
9
2
5
re
z
> 8
004
2s 03
2
4
6
8
Cumulative Time Slice #
10
Community Evolution - Clustering Coefficient (Leiden / Exp)
=
1
4
5
6
014
Ole
2
5 010
oe
_— 9
oa
g
Š
— 008
5
<<
- ®
£
35 0.06
& 02
° 0.04
01
002
00
0
4
6
8
Cumulative Time Slice #
20,
Community Evolution - Conductance (Leiden / Exp)
oe
ẵ
3
2
Community Evolution - Clustering Coefficient (Leiden / Linear)
9
Šo4
ở
2
5 03
Ễ
§ 02
0
#8
39
1
4
5
9
-e 10
8
00
1
4
5
6
9
15
2
»
0
—›
Community Evolution - Community Size (Leiden / Exp)
ae
4
6
8
Cumulative Time Slice #
07
10
1
2
5
000
2
01
L1
0
2
4
6
8
Cumulative Time Slice #
7
s
Community Evolution - Conductance (Leiden / Linear)
”
2
S102
2
E
ổ
Community Evolution - Clustering Coefficient (Leiden / None)
co
đã
Community Evolution - Community Size (Leiden / Linear)
8
10
a0
2”
s
2 0.06
25
Ổ 004
0
1
3
4
5
9
——10
+ 8
4
6
8
Cumulative Time Slice #
€ 0.08
ề
z503
€
8 02
10
2
012
00
0
01
00
0
1
2
_—
—e& 17
-e 258
_..
278
—e 359
— 368
203
5
#
3
02
25
00
os
2
6
7
0
ae
g
8
3 06
2
>
5 04
z
Ệ
ở
02
10
Community Evolution - Community Size (Leiden / None)
———————————_——¬
3
Community Evolution - Clustering Coefficient (FastGreedy / None)
10
000
0
2
4
6
8
Cumulative Time Slice #
10
0
2
4
6
Cumulative Time Slice #
10
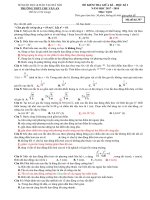
Figure 3: Evolution of community structure over each time slice as a measure of (from top to bottom) number of nodes,
conductance, and clustering coefficient.
Each column represents a different algorithm (from left to right): unweighted
FastGreedy, unweighted Leiden, and exponentially weighted Leiden.
see from comparing the first 2 rows of Figure 3, we see
with more stable conductance values as compared to
FastGreedy produces communities with widely varying
and has more frequent community births and deaths.
identified using FastGreedy across all time slices is 368
Leiden algorithm.
that the Leiden algorithm produces communities
the FastGreedy algorithm. We also observe that
sizes, differing by one or two orders of magnitude,
The total number of unique community labels
as compared to 39 detected using the unweighted
To observe the quality of community detection over the subgraph at each time slice we calculate the
subgraph modularity score. As shown in Figure 4, we observe that for all time slices, the modularity values
for both weighted and unweighted implementations of Leiden were higher than those for FastGreedy. The
modularity values were also more stable between subsequent time slices when using Leiden. This indicates
that the communities detected by the Leiden algorithm are overall superior to the communities detected
by FastGreedy even when both are operating on unweighted graphs.
Community Evolution - Graph Modularity
0.34 +
Leiden / Exp
—®—@-@-
Leiden
/ Linear
Leiden
/ None
FastGreedy
/ None
°
Nu
a
Graph Modularity
°
°
Nv
w
ao
So
0.32 4
—@
0.24 4
0
2
T
T
T
4
6
Cumulative Time Slice #
T
8
T
10
Figure 4: Comparison of graph modularity for each community detection implementation over each time slice.
Adjacency
Matrix of Top 4 Communities
[0, 31, 87, 127, 153]
Vu,
ST
Q7
T
So.
Adjacency Matrix of Top 4 Communities
[0, 108, 190, 235, 298]
Te
TE
T
TT
Adjacency Matrix of Top 5 Communities
[0, 123, 256, 319, 402, 452]
mm
Tr
‘San
Tr
7
100}
200 -
100}.. ‹;
sa
“6
2
<
s3
ar
TT
tự
300L
120
400
140
0
b
100
200
i
300
400
14/8)
Figure 5: Adjacency matrices indicating community structure evolution. The left image indicates top communities in the
first 5 days. The middle image for the first 10 days. The right image for the first 15 days.
7.1.1.
Unweighted vs Linear vs Exponential
We experimented with the Leiden algorithm using three different weight functions:
(1) unweighted, (2)
linear, and (3) exponential. The community size, conductance, and clustering coefficient values are very
similar across these three weight functions with the exception of the linear and the exponential weight experiments both resulting in significantly higher modularity values as well as less variance in conductance
values across time slices, as compared to the unweighted case. This indicates that time-weighted conductance, especially with exponential weights, substantially improve the quality of communities detected
within temporal graphs.
7.2. Community Evolution
We observed, under all considered community detection algorithms, that as graph size increases the
conductance values for communities increase until eventually leveling off. This plateauing occurs at
approximately time slice 4, which corresponds to the first two months of the network. The average
clustering coefficient for each community continues to increase slightly which indicates that the number
of edges between nodes of the same community is increasing at a similar pace to the number of edges
between nodes in different communities. The plateauing of conductance values is most apparent in the
exponentially weighted Leiden algorithm in row 4, column 2 of Figure 3.
EgoNet of Node 254 at Timeslice t = 0 (Leiden / Exp)
a
8.
i
aa
“
8
EgoNet of Node 254 at Timeslice t = 5 (Leiden / Exp)
@
a
s
\®
\
⁄
EgoNet of Node 254 at Timeslice t = 10 (Leiden / Exp)
2
ĐI
ø
®
Figure 6: Evolution of the community assignments of the nodes in the egonet of node 254. Nodes are color coded based
on their community assignment at the current time slice. To improve visibility, only 15 randomly sampled nodes from the
egonet are displayed.
When focusing on the egonet of a specific node within a community, as in Figure 6 we observe that
the number of neighboring nodes with matching community label increases over time. This indicates an
improvement of community structure and definition over subsequent time slices even if the conductance
values remain stable. It is difficult to make observations about the interactions between communities in
the first 15 days using the adjacency matrix block model shown in Figure 5 due to the sparseness of the
graph. We can identify blocks corresponding to well structured communities, but the difference is not
very strong. This is due to the fact that nodes in a question-and-answer network like Stack Overflow are
linked based off of comments and interactions and not off of a notion of “friendship”. Creating an edge
between two nodes on the graph involves more work from the user than clicking a single button to submit
a friend request.
8.
Conclusion
The addition of temporal information to community detection algorithms was shown to greatly improve
the quality of detected communities and improved the insights that could be made into the underlying
graph structure. Furthermore, the Leiden algorithm in both the weighted and unweighted cases yielded
more stable communities compared to those produced by FastGreedy. Communities detected using Leiden
reported more stable values for conductance and size as well as resulted in less unique communities
detected across multiple time slices. The incorporation of temporal information through the application of
time weighted edges further improves the quality of detected communities. The overall graph modularity
was greatest using communities returned from the exponentially weighted Leiden algorithm. We were
better able to understand changes to the clustering coefficient and conductance of detected communities
over time by observing the increase in density of edges. These changes can be thought of as revealing
more information about how users are grouped into communities as well as showing a migration of users
between communities. Enriching edges with information on when user interactions occur allow for better
community determination despite the fact that the network itself is rather sparse.
9.
Source
Code
The full Python implementation is available at https: //github.com/culk/ComEvo.
10
References
[1]
[2]
M. Girvan, M. E. Newman,
Community structure in social and biological networks,
the national academy of sciences 99 (2002) 7821-7826.
R. Kannan,
497-515.
S. Vempala,
A. Vetta,
On clusterings:
Good,
bad and spectral,
Proceedings of
J. ACM
51 (2004)
V. D. Blondel, J.-L. Guillaume, R. Lambiotte, E. Lefebvre, Fast unfolding of communities in large
networks, Journal of Statistical Mechanics: Theory and Experiment 2008 (2008) P10008.
V. Traag, L. Waltman, N. J. van Eck, From louvain to leiden: guaranteeing well-connected communities, arXiv preprint arXiv:1810.08473 (2018).
J. Leskovec, K. J. Lang, A. Dasgupta, M. W. Mahoney, Community structure in large networks:
Natural cluster sizes and the absence of large well-defined clusters, Internet Mathematics 6 (2009)
29-123.
M. E. Newman, Fast algorithm for detecting community structure in networks,
69 (2004) 066133.
J. Yang, J. J. McAuley, J. Leskovec,
abs/1401.7267 (2014).
Physical review E
Community detection in networks with node attributes, CoRR
A. P. Appel, R. L. F. Cunha, C. C. Aggarwal, M. M. Terakado,
detection and prediction in content-centric networks, 2018.
Temporally evolving community
A. Paranjape, A. R. Benson, J. Leskovec, Motifs in temporal networks, in: Proceedings of the Tenth
ACM International Conference on Web Search and Data Mining, ACM, pp. 601-610.
Z. Yang, R. Algesheimer, C. J. Tessone,
A comparative analysis of community detection algorithms
on artificial networks, Scientific Reports 6 (2016) 30750.
J. Shi, J. Malik,
Normalized cuts and image segmentation,
and Machine Intelligence 22 (2000) 888-905.
IEEE Transactions on Pattern Analysis
A. Clauset, M. E. Newman, C. Moore, Finding community structure in very large networks, Physical
review E 70 (2004) 066111.
11


![[ Bộ 50 đề thi thử 2018 ]Đề thi thử THPT Quốc Gia 2018 _Đề số 10](https://media.store123doc.com/images/document/2018_02/25/medium_EMhfBvd1kLiTWaYtfVwoMiRVW.jpg)