Cs224W 2018 67
Bạn đang xem bản rút gọn của tài liệu. Xem và tải ngay bản đầy đủ của tài liệu tại đây (8.1 MB, 12 trang )
Analysis of Chinese Venture Capital Networks
Liz Guo, Weini Yu, Junlin Liu
December 9, 2018
1
2
Introduction
Venture capital (VC) firms are those who
provide funds and other resources to startups
in order to help them grow from scratch to
successful companies [1]. Venture capital in-
vestments can be profitable, especially when
companies they invest in finally go public. On
the other hand, they are highly risky because
the
overall
survival
tremely low [2][7]..
rate
for startups
is ex-
To reduce risk, venture
capitals usually include a few startups in their
portfolio, and they tend to invest together
with other VC firms rather than individually.
All of these activities form different networks
of venture capital investments that we can
study [3][8).
While venture capital has been an industry
for decades in the United States, it is still relatively new in China. There were few venture
capital firms only ten years ago. Now, it has
become an industry with hundreds and thousands of venture capital firms and the total
asset under management (AUM) has reached
trillions of RMB. For such a young industry, still minimal research has been conducted
from the perspective of network analysis.
Therefore, in this project, we would like to
analyze the networks of Chinese venture capital firms and their investments. We conduct
two types of analysis, static and dynamic,
on both undirected and directed networks to
obtain a comprehensive understanding.
In
static network analysis, we focus on community detection, as well as motif analysis and
node impact evaluation. In dynamic network
analysis, we study the evolution of Chinese
venture capital networks.
Related
Works
In the past, some interesting work has been
conducted on venture capital networks. Jin et
al.
[12] study the characteristics of venture
capital network in
erations with those
and focus on their
economy including
employment.
China, compare their opof the western VC firms,
relationship with regional
industrial structure, and
[14] examines the relationship
and organizational structure established from
VC syndication and finds that better networked VCs have significantly better fund
performance measured by the proportion of
investments that are successfull IPO exits or
sales to another company. Xue et al. [1] study
the evolution of Chinese VC investment networks and how that affects performance of
those VC firms through a linear regression
model. They conclude that movements between different communities have positive impact on performance of venture capital firms
in terms of the number of IPO exits and in-
ternal rate of return (IRR).
To understand venture capital networks,
one of the most relevant features we need
to learn is community structure.
Traditional community detection algorithms such
as spectral methods
[4], Louvain algorithm
or node (graph) embeddings can be applied
and we explain in detail in Section 4.1.2.
There are other interesting approaches based
on deep learning [5] or cylic patterns [6] to
find clusters in graph.
Predicting investment behavior is another
popular topic. Liang et al. [3] studies the
funding investors investment in companies
based on social relationships. We won’t explore it in this project but it could be future
work.
3
3.1
Data and Representations
Data
Collection
and
firms and 9344 transactions (investments) associated with them.
To get an overview of what the data looks
like, we perform some basic statistical analysis and present the summary below. Figure
11 in appendix shows the distribution of the
number of investments venture capital firms
have made. We see that most venture capital
firms have made less than 30 investments or
so and very few firms have made hundreds of
investments in total. Figure 12 shows most
startups have received no more than 2 investments from venture capital firms, and the
number of startups receiving more than 5 investments is really low.
We then take a look at the distribution of
funding rounds, shown in Table 1. 80% of all
funding rounds are between seed stage and
series G. For simplicity and interpretability,
we will only adopt these 7000+ transactions
to build our directed network later. The distribution of years when these funding rounds
happen has been inspected as well, shown in
Table 2. Since the number of investments before 2010 is very low, we are going to lump
them together when studying the evolution of
these networks later.
Round
Seed
Angel
Series A
Table 1:
rounds
Ratio
1011
10.82 %
503
5.38 %
2613
27.96
%
%
Series B
1991
21.31
Series C
1005
10.76 %
Series
D
415
4.44
Series E
130
1.39 %
Series
F
44
0.47
Series G
21
0.21 %
2026
21.70
Others
or Unknown
The number
2009
%
%
3.2.
and ratio of funding
Rounds
2276
2017
1607
2016
1284
2015
1160
2014
926
2013
486
2012
283
2011
339
2010
215
and before
768
Network
Representations
For our project, more than one type of network can be constructed for a comprehensive
analysis. For example, we can run community
detection algorithms on both unweighted and
weighted networks and compare the results.
We can also extend an undirected network to
a directed one where we can discover significant motifs and study patterns. Furthermore,
we can analyze not only networks of investors,
but also those of startups. Thus, we define
notations for the unweighted networks as follows:
Giz, the undirected network of investors.
Each node represents an investor. An edge
exists between two nodes if two investors have
invested in the same startup.
Gig, the directed network of investors.
If
investor A invests in a startup in one round
and
then
investor
B
invests
startup in the next round (E.g.
in the
same
investor A
invests in startup X in Series D and investor
B invests in startup X in Series E), then a
directed edge exists pointing from node B to
node A.
Gu, the undirected network of startups.
Each node represents a startup. An edge exists between two nodes if two startups share
4
investor.
Static Network
Analysis
In static network analysis, we consider all
investment activities in history as a whole.
For network Gj, we provide comprehensive
measurements
%
Funding
Table 2: The distribution of years in which
funding rounds happen
a common
Number
#
2018
Statistics
Our data is obtained from crunchbase.com,
a well-known commercial database of venture
capital investments. For the purpose of our
project, we filter out venture capital firms
that are not headquartered in China.
Out
of these 1555 VC firms, we discard nearly
1000 trivial VC firms who have only made
one investment in total (or only one record
has been collected), and are left with 512 VC
Funding
Year
and
description
and
present
highly interpretable results of community detection using different algorithms. For Gig,
we find statistically significant motifs that reveal interesting investment patterns, and cal-
Network
Gj,
Measurement
s
8
There are 512 nodes and 3232 edges in
Giu. It is composed of a very large weakly
g
8
4.1.1
of Network
kả
s
Analysis
detection results on Gz„.
=
]
4.1
Average clustering coefficient of nodes with the degree
of the community
s
culate nodes’ PageRank scores which can be
an alternative way of evaluating the venture
capital firms. We also give a brief summary
connected component (WCC) with 439 nodes
and 73 isolated points. We calculate the distributions of node degrees and clustering coefficients. Figure 1 shows that the distribution
of node degrees agrees with the power law.
In figure 2, we see clustering coefficients of
nodes are high in general. The average clustering coefficients of Gj, is 0.42.
A heuristic
algorithm is adopted to approximate the size
of the largest clique in Gj, and the result is
13, which is a little lower than our expectation. We also check the distribution of shortest paths between all node pairs and find that
lengths of most shortest paths are less than 5.
The diameter of the whole network is only 6,
which is consistent with the findings in the famous Small-world Experiment. We then generate hundreds of configuration models from
the graph and the average diameter of them
is 5.4, showing that the diameter of our network is intrinsic in the distribution of its node
degrees.
Figure 2: Distribution of node clustering coefficient
4.1.2
Community
Detection
Some venture capital firms may have similar investment styles or themes. Those who
do may conceivably form a community in the
network representation. In this section, we
try to find those communities and their characteristics. We use different community detection
methods
algorithm,
clustering.
on
Gj,
including
spectral clustering and node2vec
We also run Louvain algorithm
on weighted Gj,,. Since the clustering task on
isolated nodes is trivial, we discard all of them
and only detect communities on the WCC.
4.1.2.1
Louvain Algorithm
The Louvain algorithm greedily maximizes
modularity Q which is defined as
Q(G,
5)
— 5a
ses
»
Dyes (Ag)
where S are the partitions, m is
of edges of graph G’, A;; = 1 if an
between nodes ? and 7 otherwise
are the sum of edges attached to
j respectively.
Figure 1: Distribution of node degrees
The facts above together show the compactness of Chinese venture capital networks
built from their co-investment activities. The
young and fast-developing Chinese venture
capital industry is indeed a “small world”.
Louvain
the number
edge exists
0, k; and k;
node ¿ and
The algorithm starts with each node in its
own distinct community.
In the partition
phase, it iteratively tries to move each node
i to the community of some neighbor 7 that
yields the largest modularity gain, until no
movement can be made. In the restructuring phase, it contracts the partitions from the
partition phase into super-nodes and updates
the edges accordingly. The two phases run in
turn until the community configuration does
not change anymore.
The Louvain method clusters the 439 nodes
in the WCC into 9 communities, with a mod-
ularity of 0.2416. For comparison, the configuration model with the same degree sequence
is partitioned
into
10
communities
with
a
modularity of 0.1662 which is much lower.
The degree distribution of nodes in each community is shown in Figure 3. We see each
community has a few supernodes with very
high degrees followed by more smaller nodes.
Empirically, this means each community is
led by a few bigger VCs with larger number
of investments.
Node degree by communities
Node degree
be
e
102 4
0
100
200
Nodes
sorted
300
400
by communities
Figure 3: Distribution of node degrees sorted
by communities
For example, community 2 has Tencent,
Alibaba, Baidu, Ant Financial (a subsidiary
of Alibaba), which are exactly the Big Three
in the Chinese Internet industry.
That
means, the 3 CVCs (Corporate Venture Cap-
ital) share similar investment style and focus
on similar tracks and projects.
Community 1 consists of many biotech
companies and venture capital firms focusing on biomedicine industry. Lilly Asia Ventures is the venture capital department of
Lilly, a large company in pharmaceutical industry. Sequoia and Qiming are the two Chinese venture capital firms that heavily invest
in biomedicine industry.
Venture capital firms in community 4 focus on the earliest stage investments including seed and angel stages. Those in community 6 focus on early stages too, but they are
not only capital providers but also incubators
for startups.
In fact, Sinovation Ventures,
founded by Kaifu Li, a famous Chinese entrepreneur, is the first startup incubator in
China.
The common characteristics of venture
capital firms in community 0 is that they
are major
players in late stage investments.
Community 5 has companies or venture capital firms that are closely related to Jun Lei,
the founder of Xiaomi, a famous Chinese
smartphone manufacturer.
4.1.2.2
We
Spectral Clustering
also explore k-way spectral clustering
algorithm
[9] which
we
implemented
scratch to detect communities
Figure 4: Communities detected by Louvain
algorithm.
The
node
size is proportional to
the number of investments the VC has made.
Result Interpretation To further investigate characteristics of these communities, we
inspect representative venture capital firms of
each community, shown in Table 3. The results obtained by Louvain algorithm are fairly
good in terms of interpretability. For more
than half of the communities, it is easy to see
characteristics shared by the venture capital
firms in them.
on G;,.
from
In k-
way spectral clustering method, each node is
represented by a k-dimensional vector derived
from k eigenvectors of the Laplacian matrix
of G;„. Then we cluster the nodes by their
k-dimensional vector representation.
The number of clusters k is the most critical parameter which is usually set manu-
ally.
Zelnik-Manor et al [10] discussed two
approaches to find k, which we adopt in our
implementation.
The first and more intuitive approach is to analyze the eigenvalues
and look for the k value that maximizes the
eigengap Ak = |A, — Ax_i]. We plot the first
16 eigenvalues of our graph Laplacian matrix
Community
Size
Representitive VCs
0
50
IDG
1
40
Sequoia
Capital China,
2
70
Tencent
Holdings,
Capital,
3
52
Matrix
4
34
ZhenFund,
Shenzhen
Partners
5
59
Shunwei
6
55
Sinovation
Cc
30
Source
8
49
SB
Qiming
Alibaba
China,
PreAngel,
Capital,
Node
Decent
Capital,
China Venture
Microsoft
Capital,
Capital
Partners,
Baidu,
Ant
Lilly Asia Ventures
Financial
FREES
FUND
Capital
Group,
Xiaomi
Accelerator
Bertelsmann
Capial,
Legend
Venture
Group,
Morningside
Ventures,
Code
Capital Group,
Fortune
Beijing,
Asia Investment
Venture
Cherubic
Ventures
Fund
Capital
Table 3: Communities and representative venture capital firms detected by Louvain algorithm.
which is shown in Figure 5. It suggests the
biggest magnitude drop of the eigenvalues is
when k = 4.
4.1.2.3
The second approach provides a more theoretical justification which relies more on
eigenvectors. The cost function is defined as
preserving local neighborhoods of nodes.
To sample appropriate neighborhoods, this
algorithm proposes two search strategies,
C
J=
Ze.
et 3 7=
M?
where C is number of groups, Z is matrix obtained after rotating the eigenvector matrix,
and
M;
=
maz,;Z;;.
Due
to page
limit
we
can’t describe in detail but by minimizing this
cost we get the best k which is also shown in
Figure 5.
Select Number of Clusters
40000
Eigenvalues
20000
s0
~60000
80
70
s0
~80000
2
4
6
8
10
12
Number of Clusters k
14
16
100000
Figure 5: Select number of clusters using
eigenvalue gap and cost function. When k=4
we find the biggest eigenvalue gap as well as
the minimum cost.
These two different selection methods yield
the same number of clusters.
But the result delivered is quite different from that of
Louvain algorithm and is less interpretable.
In addition, the distribution of community
sizes of k-way spectral clustering is far more
skewed than Louvain algorithm. This may
be because k-way spectral clustering does not
explicitly consider the balance of community
size as an optimization target.
The
Node2vec
node2vec
feature
algorithm
representation
can
in
learn
node
networks
while
breadth-first sampling (BFS) and depth-first
sampling (DFS). The neighborhoods sampled
by BFS lead to embeddings that correspond
to structural equivalence, while those sampled by DFS reflect communities based on
homophily.
In order
to discover
communities,
we
use
DFS and set return parameter p=1, in-out
parameter q=0.5, then run node2vec to learn
feature
representation
in a 128-dimensional
feature space. It learns macroscopic view of
the network neighborhoods. Then we apply
k-means method to cluster nodes into 6 communities.
We also check several representative venture capital firms in each community. Compared to results given by spectral clustering, they are more interpretable as node2vec
does preserve some distinctive communities,
though still not as good as Louvain algorithm.
As shown in Table 4, we get one community
of venture capital firms that focuses on biomedicine industry and one that focuses on
blockchain applications and cryptocurrencies.
Community
3
Lilly Asia Ventures,
3E
Community
4
Bioventures,
Node
Capital,
Fenbushi
Decheng
BioVeda
Capital
China
Fund
BlockVC
Capital,
Bitmain
Table 4: Two distinctive communities with
representative VC firms given by node2vec algorithm.
Since the original node embeddings have
128 dimensions, we apply PCA to reduce the
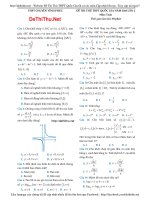
number of dimensions while keeping most information. Figure 6 is a scatter-plot of the
first and second principal component. Different colors correspond to different communities.
The first two principal components
ac-
count for 74% of the variation so it’s able to
set communities apart nicely.
First and second Principal Components
—0
—_1
—
label
3
om5
Figure 6: Community visualization based on
node embeddings.
In Figure 6, we see the distribution of community sizes is also skewed. One large com-
munity (community 1) consists of nearly half
the largest venture capital firms in the market. Community 3 and 4 are the most distinctive in this figure.
Other communities
are closer to each other and thus difficult to
set apart completely. We think this is why
node2vec algorithm is not as good as Louvain
on our task.
4.1.2.4
Louvain
on Weighted
G;,,
To see how the result of community detection change when assigning weights to edges,
we also investigate the community structure
on
weighted
G;,
using
Louvain
algorithm.
The edge weights are modeled in two different
ways: common neighbors and Jaccard Index.
Common
Neighbors
Gi,~,
In
this
graph, the edge weights between two investors are the number of common startups
the they have invested in.
w(x, y) = Pe) OP)
where I(x) is the set of startups that investor
x invest in.
On this weighted network, we again get
9 communities with a slightly lower modularity of 0.2126 compared to the unweighted
graph indicating worse community structure
on weighted network.
Jaccard
Index
Gj,,_;-
Because
modeling
edge weights using common neighbors tends
to overweight larger investors with more investments, we want to mitigate this effect by
using Jaccard Index instead. The edge weight
between two nodes are defined as the number
of common startups the two investors invest
in over the union of all the startups they invest in.
wto.) = RE
On this weighted network, Louvain gives
21 communities with a higher modularity of
0.5513 than unweighted one.
Though the
modularity is higher, the results have a similar problem to that of node2vec algorithm.
That is, there is a very large community
containing 90% of the largest venture capital firms in terms of the number of investments they make, and only community of bioventures and crypto-ventures can be clearly
detected.
The number of communities we get is much
more than unweighted one as there are many
small-sized communities
(2 or 3) where the
Jaccard weights between the nodes in these
small communities are large. They are investors who make just a few investments together.
The large weights between them
prevent them from being merged into other
larger communities due to the way Louvain
maximizes modularity.
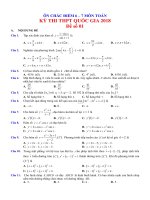
To dive deeper into why it gives a much
higher modularity, we iteratively merge the
smallest communities and see how the modularity changes. As shown in Figure 7, the
modularity only drops below the level of the
unweighted network after 18 iterations (when
only 2 communities left). This is surprising
because this 2 communities clustering should
be much worse than the 9 communities we get
before.
So we experiment re-calculating modularity of the unweighted network using assignment given by Giiy_j¢, and modularity of Giu_jc
using assignment given by the unweighted
network. That yields modularity of 0.1875
and 0.4402 respectively. This tells us that the
these random
G_iu_jc modularity change after merging communities
networks
and
compare
them
with that in the original network (Gig) us-
--- Unweighted G_iu
--- Giucn
ing z scores which is given by the following
formula
Z,=
NO
real
\Trand
— Ni
std( NT")
where N?e! is the number of times the i-th
0
1
2
3
45
6
7
8
9 1011 12 13 14
Number of communities merged
15
16 17
18
motif appears in our network.
N/2" and
std(N7"¢) are average and standard devia-
19
tion of the number
Eigure 7: Gz„ ;e s modularity change when if-
rewired random
of times
it appears
in
networks.
eratively merging the two smallest communities into a single one
Result The z score vector we get is [-6.14,
-6.68, 0.66, -7.40, -3.64, -1.45, 3.93, 7.09, -
increase in modularity score on this weighted
network is not a result of actually better clustering but is simply dominated by the Jaccard
edge weights.
tifs with the largest positive values are considered as significant. So motif 8 and 13 are sta-
4.2
Analysis of Network
Gi,
Now we approach the investor network
from a different perspective and study Gia.
There are a few ways to add direction to
edges.
One is that if there are lead investors in a funding round, we can add directed edges from other investors to the lead
investors in the same funding round. However, the dataset does not have much information about lead investors and in many funding rounds there are no lead investors at all,
which
will
make
the
network
more
sparse.
Therefore, we adopt the method described
in section 3.2. This way, an edge’s direction
indicates the successfulness of an investment
a venture capital firm has made in the last
funding round of a startup to some extent.
4.2.1
Motif Analysis
In this section,
we are going to find the
significance of different motifs in Gig.
We fo-
cus on motifs formed by three nodes and directed edges connecting them. Figure 10 in
appendix shows all possible motifs.
Method Here we adopt a commonly used
method to conduct our analysis. First, we run
ESU algorithm to enumerate all subgraphs
formed by 3 nodes, check which motif it is
and then increment the counter of the motif. Then we rewire the edges to get several random networks. We calculate the average number of times each motif appears in
4.29, -5.97, 1.65, 2.30, 6.89]. Typically, mo-
tistically significant motifs in Gg.
These two
motifs share a characteristic: the edges between two nodes are bidirectional. The implication of this pattern is that, in actual investment,
an investor A may
invest in a startup
in a round that follows the round an investor
B participates, but it may invest in another
startup a round ahead of investor B.
4.2.2
In
uate
here
way
firms.
Evaluation of Node
Impact
this section, we adopt PageRank to evalnodes in our network. The motivation
is that we want to give an alternative
to assess the impact of venture capital
There
are two
common
approaches.
One is performance-based, i.e. how many unicorns it has invested in? Or more directly,
what the internal rate of return (IRR) of the
fund?
Another is scale-based, i.e. how much
is the asset under management (AUM) of the
venture capital firm? Or how many investments it has made? Some of these metrics
are good but not sufficient, while some are
usually confidential. Therefore, our method
looks at how good a venture capital firm is or
how successful their investments are from another perspective, based on the way we build
Gia as discussed before.
PageRank Each node 2 in the network has
a score R(i), which can be iteratively com-
puted by
=d DUR
JEN (i)
Gia
DS
(j,4
i)
Gal}, k)
1-d
\V (Gia)|
where d is the teleport factor, N(i) is set of
Community size distribution
Number of nodes in coi mmunity
5
s
neighbors of 2 that has an edge pointing to 2,
Gia(j,2) is the weight of the edge from J to i,
and 0 if there is not such an edge.
The resulting score can be seen as the impact score of a venture capital firm. We output the top 20 venture
capital firms
(call it
List A) and compare it to the list ranked by
the number of investments a venture capital
firm makes (call it List B). We present just a
few examples of our findings below.
Finding 1 The top 5
are exactly the top 5 in
surprising. But the 6-th
ZhenFund, only ranks 18
investors in List A
List B. This is not
investor in List B,
in List A. ZhenFund
is well-known in China for its investments in
young entrepreneurs especially fresh graduates. Its founder, Xiaoping Xu, is very active in media and social events, which makes
ZhenFund very popular among young people.
However, according to our PageRank analysis, its investments are not as good as its pop-
ularity in young people.
Finding 2 Another interesting example is
Ant Financial, which only ranks 45 in List B
but ranks 9 in List A. That means it does not
make too many investments, but the quality
of its investments is rather good and initiative, which gives it a high impact score.
4.3.
We
Analysis
of Network
also perform community
G,,,
detection on
the undirected startup network G,,,, which is
composed of 4914 nodes and 349041 edges.
Using the Louvain algorithm, we get 91 communities with a modularity of 0.6199, compared to 0.0496 for the configuration model.
Although 0.6199 modularity score does indicate good community structure, the clustering is less informative. The community size
distribution is shown in in Figure 8. Only 18
out of 91 (20%) communities have more than
20 nodes. 67 communities have size no more
7 and each of these startup communities is
associated with only one VC firm. In general, the clustering simply shows the groups
of startups who have gotten funding from the
same investors.
Figure 8: Community size distribution of Gg,
5
Dynamic
Network
Analysis
Venture capital industry in China is constantly evolving. In this section, we study
the changes of the networks over time on the
undirected investor network G;,,.. We concen-
trate on changes of communities since this is,
in our opinion,
the most
interesting and
in-
formative task given the way we define our
networks.
5.1
Network
Division
There are many choices of how to build
timestamped networks. First, we decide to
divide the whole network by year. Thus we
have an independent network for each year.
A special case is that we combine networks
before 2010 into a single one due to scarcity
of transactions. We do not divide the network
by two or three years because of its wide span,
nor do we smooth these networks by linearly
combining adjacent ones because we want to
study what happen exactly each year. In general, the sizes of divided networks increase
over time. Their properties are similar to the
entire network except clustering coefficients
are moderately lower.
5.2
Community
There
are
four
Evolution Analysis
classes
of
methods
to
track dynamic community evolution{11]. The
method we adopt is doing independent community detection on each network for simplicity and interpretatbility.
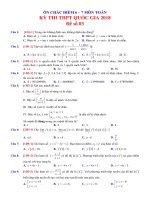
Overall Trend After getting communities
of each network, we take a look at their modularities, which is shown in Figure 9. The figure shows a descending trend but overall rela-
tively high modularity (around or above 0.4),
indicating good community structure in these
networks. Meanwhile, an ascending trend of
the number of communities can be noticed as
well.
Before
2015,
the number
Number of Communities and Modularities vs. Year
(1, 4)
(19, 4)
Tuniu (1, 19)
of communi-
ties detected waves slightly around 10. After
that, the number goes up to around 16. We
think these two trends result from increasing
network sizes.
Kingnet
(4, 57)
Ganji (1, 58)
VIPstore.com
(171, 47)
ihush.com
(4,
58)
Umeng
(4, 8)
Jiuxian
(1, 70)
Hoolai
Games
Youbei
Game
Doodle
Mobile
(1,
309)
(57, 47)
(8,
57)
Table 6: Contributing startups of the community. Numbers in brackets are IDs of VC
firms that invest in the startup.
Table 6 do similar businesses (their businesses
range from online games to retail to travel ser-
Number of Communities
vice). However, what can be noticed is that
Sequoia Capital China (#1) and Matrix Part-
ner China (#4) account for many of the edges
in this community. Therefore, we can think
of them as dominant nodes in the this com-
2010
2012
2014
Year
2016
2018
Figure 9: Modularity and the number of communities over time
Pattern Finding To further investigate
characteristics of the communities, we again
inspect them one by one. We output contributing startups for every community. A
contributing startup for a community is one
that receives funding from at least two venture capital firms in the community.
This
way, we can find out all startups that contributes to generation of edges in a community and then further figure out the pattern
of the community.
Different from results in section 4.2, charac-
teristics of communities on divided networks
have less to do with investment stages or noninvestment
connections
between
representa-
tive VC firms. Instead, a typical community
within a single year usually consists of 1 to 3
major VC firms and several other ones that
co-invest with them.
For instance, we have a
community in 2011 shown in Table 5 and its
contributing startups in Table 6.
1 Sequoia
4 Matrix
47 Green
Capital China
Partners
China
Pine Capital
70 Oriental Fortune
171 Taishan
Invest AG
8 Sinovation
19 Gobi
Ventures
Partners
57 Zero2IPO
Ventures
58 Capital Today
309 Zero2IPO
Capital
Table 5: A community of the network in 2011.
Numbers are IDs we give to venture capital
firms.
MoboTap
Camera360
Venture capital firms
seem to share features.
in Table 5 do not
Nor do startups in
munity.
Interpretation of community changes
We represent each community in brackets
with IDs of its dominant venture capital
firms or a letter indicating its industry in
Table 7 and omit tiny communities.
We
can see that most of the communities are
dominated by largest venture capital firms
(those with ID less than 10).
For example,
the largest three, IDG Capital (#40), Sequoia
Capital China(#1) and Qiming Venture Partners(#2) almost always dominate a community every year.
2009
(0,1)(2)(7)
(9) (50)
2010
(0)(1)(9) (50) (57)
2011
(0)(1,4) (2,10) (15,45)
2012
(0,2)(1)(5) (8,15)
2013
(0,23)(1)(2,8)(4,11)
(5,10) (38)
2014
(0,2) (1)(3)(4,8)
(5) (10) (9) (16,19)
2015
(0) (1,22,33)(2,9,11)
(3,13) (4,10,21)(5,16)
2016 | (0,13)(1,3)(2,8,9)(4,5,10,23)
(11,32) (21)(b)
2017
(0) (1,3,5,8) (2) (4)(7)(13,25)
(41,61) (b)
2018 | (0,1)(4,10)(3)(5,21,27)(8)
(13) (20) (55) (c)
Table 7: Communities on networks of different years. Letter ‘b’ stands for bio-medicine
and ‘c’ for cryptocurrencies.
In more recent years, the number of dominant investors in a community increases. This
is reflective of a trend of the market - as both
money and participants boom in the market, investors tend to compete for promising projects or unicorns which result in more
co-investments, while in earlier years, investments are more exclusive.
Dominance can also be seen as an indicator
of impact of a VC firm in the market.
Before
2010, Shenzhen Capital Group (#7), a stateowned venture capital firm and one of the
few large funding providers, has great impact
since it is a dominant node in a community.
After 2010 it no longer appears as a dominant
node in communities until 2017. The same
problem occurs to Fortune Venture Capital
(#50),
makes them inappropriate for some tasks.
For example, we can not model a process of
information cascade on our networks as the
paths do not correspond to real ones that
transmit information or substance.
7
In this project, we conduct thorough analysis on networks of Chinese venture capital
firms.
Our analysis consists of two parts:
static analysis and dynamic analysis.
For
these analyses, we build two types of networks:
undirected and directed ones, and
investigate both unweighted and weighted
undirected networks.
another state-owned venture capital
firm in China.
In contrast,
we can see Ten-
cent (#3) and Alibaba(#13), the two largest
Internet companies in China, come into play
around 2013 and quickly become very important players in the market.
Similar to results in section 4.2, only com-
munities of bio-ventures (labelled with ’b’)
and crypto-ventures (labelled with ’c’) can be
In static analysis, we first find out the network of Chinese venture capital forms a small
clearly identified. This is a little surprising as
we expect a moderate number of communities
relate to different investment themes at different times. A possible explanation is that
bio-medicine industry requires the most area
expertise.
As
a result,
not
many
world. Then we try to extract communities
using different community detection methods. Louvain algorithm gives excellent results
where most communities have distinct characteristics.
Node2vec method can preserve
some communities including bio-ventures and
investors
are eligible to invest in that industry. Internet service, the biggest investment theme in
recent decades that contains a large number
crypto-ventures but generate a large commu-
nity comprised of half the largest venture capital firms which reduces interpretability. We
also try to detect communities on weighted
networks and the results share the same problem. Another finding is that giving weights to
the network can increase modularity but does
not generate better communitites.
of industries related to Internet, however, has
a much lower barrier to entry. Almost every
one in the market invest in Internet related
startups. That is why we are not able to identify a community of an industry other than
bio-medicine.
As for blockchain and cryptocurrencies, they are quite new and not encouraged by Chinese government. Thus, only
a specific group of investors invest in relevant
projects, forming a community.
6
We also get statistically significant motifs
on the directed version of the network. In
addition, we show that PageRank can be
adopted to the directed network as an alternative effective way of evaluating impact of
venture capital firms.
Discussion
In dynamic analysis, we mainly focus on
evolution of communities at different times.
We find that the most common pattern of
communities in a single year is that it is dominated by one to three large firms, which can
be seen as their influence as well. The dominating firms also change over year which is
reflective of and consistent with what actually
happens in the young but expanding Chinese
venture capital industry.
Although our methods above deliver good
and interpretable results on Chinese venture
capital networks, there are still some limitations in our work.
First, our data is not as complete as we
expect. Though it is obtained from a reliable commercial database, the amount is just
1/3 of the estimated entire data. The insufficiency of data shrinks our network size and
removes potential edges. That might lead to
some inaccuracy or even incorrectness in our
analysis.
Second,
the way
Conclusion
Our project is on Github:
github. com/wnls/224w_vc_net
we define our networks
10
https://
8
Appendix
References
[1] Xue, C., Jiang, P. and Dang, X., 2018.
The dynamics of network communities
and venture capital performance:
Evidence from China. Finance Research Let-
R..jN MP -JN- P22ME.
ieee
ters.
Li, X. and Chen, H., 2013. Recommendation as link prediction in bipartite
graphs:
A graph kernel-based machine
learning approach. Decision Support Systems, 54(2), pp.880-890.
Figure 10: All 13 motifs formed by 3 nodes
and directed edges connecting them
Number of vc firms
Liang, Y.E. and Yuan, $.T.D., 2016. Predicting investor funding behavior using
crunchbase social network features. Internet Research, 26(1), pp.74-100.
=
8
Ng, A.Y., Jordan, M.I. and Weiss, Y.,
2002. On spectral clustering:
Analysis
and an algorithm. In Advances in neural
information processing systems (pp. 849856).
10!
10?
Number of investments a vc has made
Figure 11: Distribution of the number of investments ve firms have made
Bruna, J. and Li, X., 2017. Community
detection with graph neural networks.
arXiv preprint arXiv:1705.08415.
Number of startups
”3
|6] Yin, H., Benson, A.R., Leskovec, J. and
Gleich, D.F., 2017, August. Local higherorder graph clustering. In Proceedings
of the 23rd ACM SIGKDD International
Conference on Knowledge Discovery and
Data Mining (pp. 555-564). ACM.
10°
101
Number of investments a startup has received
Wu, K., Lee, T. and Ma, A., 2016. Examining the Structure of Venture Capital Investment Networks. CS224W Report. Stanford University. Web.
10?
Figure 12: Distribution of the number of investments startups have received
Hong, Y. and Wu, J, 2016. Linkbase Prediction on Crunchbase Investment Network. CS5224W Report. Stanford University. Web.
Shi, J. and Malik, J., 2000. Normalized cuts and image segmentation. IKREE
Transactions on pattern analysis and machine intelligence, 22(8), pp.888-905.
[10] Zelnik-Manor, L. and Perona, P., 2005.
Self-tuning spectral clustering. In Advances in neural information processing
systems (pp. 1601-1608).
11
[11] Dakiche, N., Tayeb, F.B.S., Slimani, Y.
and Benatchba, K., 2018. Tracking community evolution in social networks: A
survey. Information Processing and Management.
[12] Jin, Y., Zhang, Q., Shan, L. and Li, S.P.,
2015. Characteristics of venture capital
network and its correlation with regional
economy: evidence from China. PloS one,
10(9), p.e0137172
[13] Jin, Y., Zhang,
Topological
Q. and Li, S.P., 2016.
properties
and
community
detection of venture capital network: Evidence from China. Physica A: Statistical Mechanics and Its Applications, 442,
pp.300-311.
[14] Hochberg, Y.V., Ljungqvist, A. and Lu,
Y., 2007. Whom you know matters: Venture capital networks and investment performance. The Journal of Finance, 62(1),
pp.251-301.
12