Cs224W 2018 72
Bạn đang xem bản rút gọn của tài liệu. Xem và tải ngay bản đầy đủ của tài liệu tại đây (5.54 MB, 11 trang )
Detection and Characterization of Virtual Communities in
/r/Politics
Amanda Lim
David Morales
Department of Computer Science
Stanford University
Department of Computer Science
Stanford University
Abstract
We propose a framework for detecting and characterizing homophily in virtual communities found on social networks. We focus on a particular subset of data, namely, r/Politics,
a politically-neutral forum on the social network site Reddit. We use sentiment and topic
modeling to project users to their political viewpoints, connect users based on these viewpoints, detect communities and political ideologies within this model, and present methods
for evaluating the extent to which they are homophilous. Our analysis determines the existence of relatively small numbers of communities but with significantly strong community
strength despite the large groups. We find a high tendency for political opinions to cluster together with high average clustering coefficients and high vertex betweenness scores.
Though the biggest bottle neck is the extraction of proper points of view from author comments, our results consistently show the existence of around 3 communities in this political
forum. Looking at the representative ideaologies of these communities, it can be seen that
the communities each capture aspects present in convervative and liberal groups.
1
Introduction
Social media and the Internet in general has had the effect of bringing together individuals and encouraging
participation in discussion at an unprecedented scale. Despite the lack of any geographical barriers preventing the mixture of ideas and concepts, social networks are home to many communities of individuals with
similar interests and points of view. These homophilous communities are often an effect of individuals’
status and values [6]. As a result, these communities can be considered virtual, as they are often not explicit,
but, rather, abstractly represented in the opinions and participation of individuals. There’s interest to identify
these homophilous communities and determine their impact in particular movements and spaces. One of
these spaces is contemporary political climate, as there is evidence to suggest that Americans have become
increasingly polarized over the recent decades. Towards this end, we propose a framework for detecting and
characterizing communities on r/Politics, a politically-neutral subreddit on social news aggregate site Reddit
dedicated to the discussion of U.S. politics.
2
2.1
Related Work
Predicting Political Orientation and Measuring Political Homophily in Twitter Using Big Data
Colleoni et al. (2014) [3] examine political homophily on Twitter, or the preference of actors in social
networks to form ties on the basis of shared political viewpoints and affiliations. For their dataset, they
use all of the nodes and ties on Twitter in 2009, with nodes being the users and the ties being the directed
edges of who follows who. They begin by creating three training sets to determine what constitutes political
tweets, Democratic tweets, and Republican tweets by selectively taking the content from political news feeds
on Twitter, users who follow the official Democrat account, and users who follow the official Republican
account respectively. To distinguish between political tweets and nonpolitical tweets, they apply n-grams
and term frequency-inverse document frequency to train their Passive-Aggressive classification algorithm,
the latter being a measure of how the term is common across all documents. After conducting a 10-fold
cross-validation on this training set, they found that 10% of Twitters content is political content. Using this
output of tweets, Colleoni et al. then chained the Democrat/Republican classifier — another application of
the same process described above — to determine tweet partisanship and then simply classified users based
on whether the majority of their tweets were left-leaning or right-leaning. After constructing a graph using
these users with at least one political tweet and one outbound tie, they compute the users level of political
homophily ranging from 0 to 1, as defined by the number of outbound ties directed to users who share
political orientation divided by the overall number of outbound ties.
2.2
Recommending Users and Communities in Social Media
Li et al. (2015) [recommending users] attempt to identify latent relationships among users and communities and distinguish users interests from the focuses of communities. They propose a framework for recommending topic-related users as well as topic-cohesive communities, evaluated on a subset of Twitter.
This framework contains three components: community detection, topic modeling, and recommendation.
To allow for users to belong to multiple communities, the authors use soft clustering techniques and use a
bipartite graph to preserve similarity relations. To determine topics, all of a users comments are treated as a
document and each document is considered as a mixture of topics corresponding to some distribution over
the vocabulary. The same is done for the comments belonging to a community. Recommendation is then
done by selecting users or communities based on topic interest and discussion for a particular user profile or
list of keywords.
3
3.1
Data
Data Collection
We use the dataset provided by the SNAP group, which consists of all of the Reddit comments on the
r/Politics subreddit in 2014. Apart from user comments, the dataset also contains metadata such as upvote
and downvote
scores,
comment
ID and parent comment
ID, author username,
and
a temporal
indicator
time. As we are solely concerned with user communities as directly related to topics and a positive/negative
associated sentiment, we utilize only the comment texts and the author usernames.
We filtered this initial dataset by determining active users of this subreddit: users who made 100 or more
comments in r/Politics over the course of the year. As r/Politics is a default subreddit (i.e. top-ranking posts
submitted to the subreddit are automatically displayed to all non-logged-in users and logged-in users that
have not explicitly removed it from their list of subreddits they wish to follow), this filter removes users that
are not normally participants in the community. These users may consist of passer-bys who interact with
only the few posts that make it to the top of the entire site, or users who simply observe the discussion while
rarely contributing their own voice and opinions to the mix.
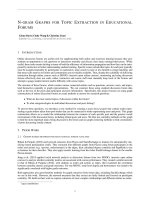
r/Politics Users and Comment Frequency in 2014
10°
Number of Users (log)
10* ;
10?
c
101
4
10°
4
10°
10!
102
103
Number of Comments (log)
10
Although the proportion of active users is low, it is clear they play central roles in the network. Even though
active users only consist of around 2% of the users that commented in r/Politics in 2014 (3,711 active users
out of 161,715 users), they contributed around 55% of all the comments made (1,283,454 comments from
”active users” out of a total of 2,333,826). Therefore, this heuristic has the threefold benefit of selecting
users that best represent the subreddit, selecting users that have provided enough information to understand
their stance on multiple topic areas and their role in the grander scheme of the network, and keeping runtimes
reasonable for our model creation and analysis.
Of these 3,7144 users, we randomly
sampled
1,000 users
and obtained all of the comments made by each of these users over the year to provide the basis for our
model.
3.2
Data Processing
As recommended by Lin He (2009) [5] in their joint/sentiment modeling paper, we pre-processed the data
by removing all punctuation, numbers, stop words, extra whitespace, and special characters. However,
we did not remove the negations not and no although they are traditionally labelled as stop words as that
has been shown to significantly lower sentiment analysis accuracy®. As such, we additionally expanded
all contractions such as ’can’t” and ’won’t” in order to maintain this negation. The data had previously
been cleaned before we attained it by changing all characters to lowercase, replacing URLs and non-ASCII
characters with <URL> and <SPECIAL> tags respectively, and marking sentences boundaries with a
<EOS> tag. In our pre-processing step, we removed these tags and additionally performed stemming using
the Porter stemming algorithm’ to address the issue of data sparseness. Stop words were removed according
to the Natural Language Toolkit (NLTK) set of stop words.
4
4.1
Methods
Sentiment/Topic Modeling
Sentiment/topic modeling involves instantiating a fixed number of topics based on a subset of user comments. We identified the broad topics present over all of user comments as well as user sentiments toward
these topics, which allows us to consider opposing viewpoints when defining these topics: a positive sentiment toward a particular candidate and a negative sentiment toward the same candidate entails two separate
instances of the topic. This component involves employing the concepts presented in sentiment and topic
modeling.
We implemented two different models for topic extraction: a baseline model and an unsupervised Latent
Dirichlet Allocation (LDA) model. For our baseline model, we use a very simple heuristic to identify the
key topic(s) of the comment by extracting all of the nouns (using the NLTK part-of-speech tagger) from
each of the comments while simultaneously assigning sentiment to the comment as a whole. Sentiment is
decided using lexicon and rule-based analysis tuned to the kind of sentiments usually found in social media.
We apply this Valence Aware Dictionary and sEntiment Reasoner (VADER) to an entire comment to get
the general sentiment of the comment. These word-sentiment pair topics are used to preserve viewpoints of
users and together count as one topic. We then identified a fixed number of topics by simply extracting the
200 most common word-sentiment pairs over the entire corpus. Below are examples of these sentiment-topic
pairs (each is considered to be a separate topic):
>
( job’, ’+’) C washington’,
99
>
’-’) (money’,
99
’-’) (nation’, ’+’) ( paper’, ’+’)
Our unsupervised LDA [1] model is a probabilistic generative model. It is used to infer hidden variables
using a posterior distribution where we consider each comment to be a distribution over topics and each
topic a distribution over words belonging to a vocabulary. The LDA model, like our baseline model, is a
”Bag of Words” model in which the order of the words in a comment does not matter. For the specific implementation, we used Gensim’s LDA model to generate the main topics (represented as a group of related”
words) over the entire corpus with the parameters of 50 fixed topics and 2 passes over the entire dataset.
Once the topics are extracted, each comment is assigned to a topic according to the maximum probability in
a list of probabilities generated for each comment that determines the likelihood of said comment belonging
to any of the 50 extracted topics. Sentiment analysis of the comment is done separately using the same
methodology as in the baseline model. Topic-sentiment pairs are then combined to create the topic node for
our network for a total of 100 topics in our LDA model. Below is an example of these sentiment-topic pairs,
where the decimal value determines the relative contribution of the adjacent (stemmed) term to the topic:
(+) 0.083*’ law’ + 0.064*’not’ + 0.025*’ legal’ + 0.022*’crime’
0.019*illeg’ + 0.019*’ would’ + 0.018*’ person’ + 0.016*’drug’
4.2
+ 0.019*’no’ + 0.019*’crimin’ +
Graph Construction
Once topic instances are defined, two graph representations of the subreddit are constructed. The first graph
models user views and interests and relates users to topics. The node set of this graph contains two primary
types of nodes: user nodes and topic nodes. For each comment belonging to a particular user, the topics
in the comment are extracted and the nodes corresponding to this user and these topics are linked. Recall
from the previous section on sentiment/topic modeling that these topic nodes encode a negative or positive
connotation toward a topic. Because there is no need for directionality between connected nodes, the graph
is undirected.
The second graph models user-user compatibility. Similar to the first graph, this graph will be undirected.
For this graph, we fold the bipartite graph constructed previously with the new graph set only containing the
user nodes. Any two nodes are linked if the two corresponding users are similar enough. The similarity of
two users is determined as a function of the number of topics they have in common (based on the edges of
the first graph).
For the baseline, we use the Jaccard Index, or the Intersection over the Union, of the two
sets of topic neighbors for each pair of users. If this index is greater than a certain ratio (we use 0.5 for both
our baseline model and our LDA model), then the two users are linked. This graph is used for determining
communities of similar users.
4.3
Community Detection
We identify ideological communities using various techniques.
These techniques include partitioning
through the use of modularity and edge betweenness. Graph partitioning provides insights regarding niches
of users and users at the cusp of multiple communities and the topics and viewpoints that ultimately separate
communities.
Q= 5
1
kk;
x [Ais ]ð(6, c¿)
The first technique involves finding a partition of the nodes that maximizes the overall modularity, Q where
Aj;; is the edge weight between nodes 7 and j, which in our case is | for all edges. k; and k; are the
degrees of the nodes. 2m is the total number of edges in the graph. c; and c; are the communities of
nodes. Finally, 6 is a delta function that evaluates to 1 if the nodes are in the same community and 0
otherwise. This modularity is maximized using the two phases of the Louvain Method [2]. The first phase
considers the change in modularity from removing a node 2 from its own community and into a neighboring
community (the community of a neighbor 7). Node 7 is then placed into the community that increases
the modularity the most. This repeats for all nodes until the modularity ceases to increase. The second
phase then rebuilds the graph by considering each community as its own node. Edges between nodes of
communities are represented as a single edge with appropriate weight, and edges between nodes within the
same community are represented as a self edge of appropriate weight.
The second technique involves considering the edge betweenness of edges in the graph. Edge betweenness is
defined to be the number of shortest paths between any two nodes that pass include the edge. Mathematically,
the edge betweenness of an edge e is
sft
ng
Ost
Where o,;(e) is the number of shortest paths that include e and o,; is the total number of shortest paths from
node to node . The idea behind this Girvan-Newman algorithm [4] for community detection is that edges
connecting communities will have high edge betweenness. Thus, the algorithm finds communities by first
calculating the edge betweenness of all edges in the graph, removing the edge with the highest betweenness,
and repeating until no more removable edges remain. See section 4.4.3 for how the detection method can be
used for analysis.
As can be seen, both partitioning algorithms take different approaches to building communities that are
beneficial. The Louvain Method takes a bottom-up approach, joining nodes into communities. This gives
an idea of which users are immediately more similar than others and hints at particular niches of users
within communities. The Girvan-Newman algorithm takes a top-down approach, removing the nodes that
most likely connect communities. The method and the idea of edge and vertex betweenness elucidates the
concept of users that lie at the cusp of multiple communities. Perhaps, these are the users that are truly
neutral in political ideology.
4.4
4.4.1
Analysis
Ideology Extraction
One approach to determining homophily within communities and polarization between communities is to
extract primary ideologies or representative topics. There are two main approaches that we take to determine
the most significant, underlying views of a community. One is to simply consider which topics are linked to
the most by the members of the community. Specifically, for each topic, the ratio of number of members in
the community that link to the topic to the total number of members in the community is considered. If this
ratio is above a certain threshold (0.5, in our case) then it is considered a representative topic.
The second approach aims to first identify particular prototypes in the communities, or users that best represent that community and then consider the topics linked to by these users. These users are defined to be
those with the highest number of edges in their ego graphs. This is an indication that not only are these users
very well-connected within the community, but they are also connected to other highly-connected users in
the community. We then analyze the terms characterizing the community.
4.4.2
Community Betweenness
We also examine a users proportion of edges within their community in relation to the total amount of edges
they have with any user in the subreddit. As was alluded to in the community detection section, we can use
the idea of vertex betweenness, a measure of centrality based on shortest paths, of a user node to make this
analysis. Consider that, very much like edge betweenness, the vertex betweenness of a vertex v is defined as
ee
szt
In essence, vertex betweenness represents the degree of which nodes stand between each
of our student, this signifies that members of a homophilous community will have very
scores (as they are connected to very few users of other communities), while members of
communities will have relatively high betweenness scores. We can then characterize the
by the average betweenness of its members.
other. In context
low betweenness
non-homophilous
entire community
Since computing the shortest path between all nodes is expensive, especially on relatively large graphs, we
employ a heuristic to our betweenness analysis. Instead of computing the shortest distance between all pairs
of nodes, we combine a small subset of nodes from each community to act as our source and target nodes.
Each of these community subsets is made to include the prototype user of the corresponding community, as
described in section 4.4.1, to maximize reach among communities. We additionally calculate the average
clustering coefficient over the entire graph. The clustering coefficient is a measure of the degree to which
nodes in a graph tend to cluster together, or the likelihood that two nodes are connected if they are connected
to a mutual node.
4.4.3
Community Topic Evolution
The final approach to analyzing our communities makes use of the Girvan-Newman method for community
detection, as described in section 4.3. At each step of the Girvan-Newman method, communities are broken
down into smaller communities, until each node is in its own community or a particular number of communities is reached. Using the Louvain method to find the partition of the graph that maximizes modularity, we
determine the number of communities in the graph. Next, the Girvan-Newman method is used to separate
the graph into that number of communities.
While the graph is being partitioned, the intermediate communities and the ideologies present in them can
be extracted and analyzed. What results is an evolution of ideologies as communities become more niche.
This formulation can be used to determine at what point do communities become homophilous.
Unfortunately, because the number of communities detected was so small, we were unable to make use of
this analysis method.
5
5.1
Results and Discussion
Sentiment/Topic Extraction
Cjob’, +)
( policy’, ’-’)
( force’, ’-’)
( money’, ’+’)
C college’, ’+’)
Figure 1. Sentiment/Topic Pairs for Baseline
(+) 0.041*’not? + 0.030*’pay’ + 0.028*’money’ + 0.024*’cost’?
0.019*’compani’ + 0.018*’ would’ + 0.018*’job’ + 0.016*’make’
0.014*’ work’ + 0.013*’ benefit’
+
+
(-) 0.057*’religi? + 0.050*’control’ + 0.040*’belief? + 0.036*’warren’ + 0.034*’men’ + 0.032*’religion’ + 0.027*’ church’ + 0.026*’ birth’ +
0.024*’discrimin’ + 0.021*’deni’
(-)
0.065*’right’
+
0.058*’rule’
+
0.054*’constitut’
+
0.049*°health
0.028*’medic’
+
+
0.053*’speech’
+ 0.048*’ protect’ + 0.046*’ amend’ + 0.040*’tortur’ + 0.030*’ freedom’ +
0.028*’ limit’ + 0.027*’death’
(+) 0.062*’care’ + 0.052*’insur’
0.035*’not’?
+ 0.033*’healthcar’
0.024*’ cover’ + 0.019*’ obamacar’
+
+
0.047*’plan’
0.025*’aca’
+
+
(-) 0.161*’polic’ + 0.111*’ offic’? + 0.053*’shot’? + 0.052*’check’ +
0.043*’ union’ + 0.036*’ murder’ + 0.024*’ arrest’ + 0.021*’ background’ +
0.019*’ force’ + 0.018*’suspect’
Figure 2. Sentiment/Topic Pairs for LDA
We found that the LDA performed significantly better than the baseline model in terms of sentiment/topic
extraction. The baseline model had a tendency to find very general topics and sentiments while the LDA
model created cohesive groupings of word that more specifically referred to a political issue. While the
baseline model easy identifies obvious connections such as ’crime” and ”bad,” we can see that many of
word groupings generated by the LDA uncover positions that are relevant to the political climate of today
(e.g. ”police brutality,’ ’women’s rights,” ”separation of state and church,” and ”freedom of speech”).
We therefore expect to gain a more representative and realistic understanding of how our network analysis
translates into the real world using the graph produced by the LDA model.
5.2.
5.2.1
Community Analysis
Baseline:
The user-user graph for the baseline model consisted of 1,000 nodes (as expected) and 250,268 edges. After
performing the community detection using modularity maximization, there were 3 communities detected
with respective sizes of 455 users, 373 users, and 3 users. The average clustering coefficient of the entire
user-user graph was calculated to be 0.9131 with the community betweenness scores being 13.422, 23.108,
and 42.193 respectively. Below, we extract the main topics calculated for each of the three communities.
Community 1:
The first community detected by the baseline sentiment-topic extractor includes pairs such as (’bush’, ’+’),
( wealth’, ’+’), ( population’, ’-’), Cincrease’, ’+’), and (constitution’, ’+’).
Community 2:
The second community detected by the baseline sentiment-topic extractor includes pairs such as (’speech’,
*+°), Camendment’, ’-’), Vhealthcare’, ’+’), ( gop’, ’-’), fraud’, ’-”).
Community 3:
The third community detected by the baseline sentiment-topic extractor includes pairs such as (’power’,
*+’), Chell’, ’-’), (story’, ’+’), Ceconomy’,
2
’+’), (violence’,
99
’-’).
As can be seen, it is still very difficult to completely tell the communities apart using these naive sentimenttopic pairs. There are a few characteristics in the terms that seem to be indicative of particular political stand
points. Particularly the presence of a positive ’healthcare’ and positive ’speech’ in the second community.
The third community (with highest betweenness score) seems to lend itself to being more general and having
neutral terms.
5.2.2
LDA:
The user-user graph for the LDA model consisted of 1,000 nodes (as expected) and 189,126 edges. As with
the baseline model, the modularity maximization algorithm identified 3 communities of respective sizes
512, 473, and 5. The average clustering coefficient over the entire graph was 0.68616 with the betweenness
scores for each community being 43.387, 29.0126, and 39.957 respectively. As before, we extract the main
topics calculated for each of the three communities by the LDA model below.
(+)
0.034#'oil'
0.018*’pipelin?
+ 0.022*’ water’
+
0.015*’air?
+
+
0.013*’use’ + 0.013*’resourc’
0.018*’us’
+
0.014*’suppli?
+
0.018*’revenu’
0.014*’? own’
+
+
(+) 0.118*’money’ + 0.087*’ polit’ + 0.062*’ group’ + 0.049*’fund’ +
0.045*’spend’ + 0.032*’ interest’ + 0.029*’ campaign’ + 0.029*’ public’ +
0.023*’influenc’ + 0.022*’donat’
Community 1:
(-) 0.062*’care’ + 0.052*’insur’
0.035*’not’?
+ 0.033*’healthcar’
0.024*’ cover’ + 0.019*’ obamacar’
+
+
0.049*°health
0.028*’medic’
+
+
0.047*’plan’
0.025*’aca’
+
+
(+) 0.040*’shoot? + 0.023*’particip’ + 0.023*’fire’ + 0.022*’could’
+ 0.019*’consid’ + 0.019*’would’ + 0.016*’train’ + 0.015*’arm’ +
0.015*’ first’ + 0.014* hit’
(+) 0.152*’ obama’ + 0.102*’presid’ + 0.071*’bush’ + 0.055*’lie’ +
0.037*’ congress’ + 0.028*’clinton’ + 0.024*’administr’ + 0.020*’paul’ +
0.016*’hillari’ + 0.016*’rememb’
(-) 0.117*’conserv’ + 0.097*’liber’ + 0.064*’hate’ + 0.050*’ libertarian’
+ 0.047*’media’ + 0.042*’love’ + 0.039*’sign’ + 0.028*’progress’ +
0.019*’ young’ + 0.016*’ alway’
(-)
0.077*’ court’
+
0.073*’corpor’?
+
0.042*’case’
+
0.036*’justic’?
+
0.031*’ citizen’ + 0.030*’ corrupt’ + 0.029*’ politician’ + 0.027*’suprem’ +
0.024*’ trial’ + 0.021*’ indict’
Community 2:
(+) 0.078*’singl’ + 0.074*’charg’
+ 0.025*’neither’ + 0.024*’strike’
0.017*’ parent’ + 0.017*’describ’
*(-) 0.065*’right’
+ 0.058*’rule’
0.048*’ protect’ + 0.046*’amend’
0.028*’ limit’ + 0.027*’death’
+ 0.060*’children’ + 0.038*’ organ’
+ 0.023*’statu’ + 0.021*’mother’ +
+ 0.054*’constitut’?
+ 0.040*’tortur’
(-) 0.275*’right? + 0.036*’hell’ + 0.034*’ protest?
0.027*’racism’ + 0.026*’evil’ + 0.025*’christian’
0.014*’ insult’ + 0.013*’usa’
+ 0.053*’speech’
+
+ 0.029*’ wing’
+ 0.018*’joke’
+
+
+ 0.030*’ freedom’
+
(+)
Community 3:
0.145*’cop’
+
0.056*’brown’
+
0.049*’news’
0.023*’fox’
+
+
0.043*’stori’
+ 0.031*’ watch’ + 0.029*’pull’
0.014*’ walk’ + 0.013*’told’
+
0.017*’press’
+
(+) 0.105*’gop’
+ 0.087*’man’
0.024*’ fault? + 0.022*’doubt’ +
0.018*’ garner’ + 0.015*’ father”
+ 0.057*’die’
+ 0.043*’judg’
0.021*’meant’? + 0.020*’asshol’
+
+
(-) 0.040*’shoot’? + 0.023*’particip’ + 0.023*’fire’ + 0.022*’could’
|+ 0.019*’consid’ + 0.019*’would’ + 0.016*’train’ + 0.015*’arm’ +
0.015*’ first’ + 0.014*’hit”
(+) 0.057*’religi? + 0.050*’control’ + 0.040*’belief? + 0.036*’ warren’ + 0.034*’ men’ + 0.032*’religion’ + 0.027*’ church’ + 0.026*’ birth’ +
0.024*’discrimin’ + 0.021*’deni”
(-) 0.068*’differ’ + 0.044*’scienc’ + 0.036*’store’ + 0.031*’sex’ +
0.027*’ reflect’ + 0.024*’ machin’ + 0.024*’ user’ + 0.022*’ill’ + 0.021*’insid’ + 0.020*’sander’
The community distinctions are more clear in the topics extracted from the LDA model. The first community, as determined by the topics that represent the community, seem to consist of a cohort of traditionally
conservative views with a heavy emphasis on positive views of oil, negative views of the Affordable Care
Act (ACA) and Obamacar, and positive views of guns right and gun ownership. The second community
seems to represent the opposite: progressive views associated with the left with views such as a negative
stance on the death penalty, negative views about the right (in general), and negative views on state religion.
The last community, consisting of only three users, represents a relatively trivial segment of the 1/Politics
community with more focus on police brutality
6
Conclusion and Future Work
As can be seen the main bottleneck of the framework is the extraction of ideologies (here in the form of
sentiment-topic pairs), from written comments. This bottleneck affects the entire framework, since the
ideologies are used to determine links between authors in the graph that is ultimately used for community
detection. That being said, there is a lot of work and more complex methods that can be done for easing this
bottleneck.
Despite our simple methods to topic-modeling, we can see that the virtual communities detected do contain
information of groups that exist in the source. In our case, we see that the sentiment-topic pairs representative
of the communities are indicative, to some extent, of conservative and liberal groups.
Future work involves testing the proposed framework on other less-specific forums as well as other social
networks that encourage communities based on interest, status, and values.
10
7
Contributions
Amanda: Implemented: data processing, topic modeling,
sentiment/topic modeling, results and discussion.
David:
Implemented:
graph construction, community
methods, results and discussion.
8
graph analysis.
Wrote:
detection, graph analysis.
related work,
Wrote:
data,
related work,
Github
Please find our code at the following link: />References
[1]
David M Blei, Andrew
Y Ng, and Michael I Jordan. “Latent dirichlet allocation”. In: Journal of ma-
[2]
chine Learning research 3.Jan (2003), pp. 993-1022.
Vincent D Blondel et al. “Fast unfolding of communities in large networks”. In: Journal of statistical
mechanics: theory and experiment 2008.10 (2008), P10008.
[3]
Elanor Colleoni, Alessandro Rozza, and Adam Arvidsson. “Echo chamber or public sphere? Predict-
ing political orientation and measuring political homophily in Twitter using big data”. In: Journal of
Communication 64.2 (2014), pp. 317-332.
Michelle Girvan and Mark EJ Newman. “Community structure in social and biological networks”. In:
Proceedings of the national academy of sciences 99.12 (2002), pp. 7821-7826.
Chenghua Lin and Yulan He. “Joint sentiment/topic model for sentiment analysis”. In: Proceedings of
the 18th ACM conference on Information and knowledge management. ACM. 2009, pp. 375-384.
Miller McPherson, Lynn Smith-Lovin, and James M Cook. “Birds of a feather: Homophily in social
networks”. In: Annual review of sociology 27.1 (2001), pp. 415-444.
11