mesophilic and thermophilic anaerobic digestion of nsource-sorted organic wastes _ effects of amm
Bạn đang xem bản rút gọn của tài liệu. Xem và tải ngay bản đầy đủ của tài liệu tại đây (196.45 KB, 6 trang )
ORIGINAL PAPER
C. Gallert á J. Winter
Mesophilic and thermophilic anaerobic digestion
of source-sorted organic wastes: effect of ammonia
on glucose degradation and methane production
Received: 26 March 1997 / Received revision: 13 May 1997 / Accepted: 19 May 1997
Abstract The wet organic fraction of household wastes
was digested anaerobically at 37 °C and 55 °C. At both
temperatures the volatile solids loading was increased
from 1 g l
A1
day
A1
to 9.65 g l
A1
day
A1
, by reducing the
nominal hydraulic retention time from 93 days to
19 days. The volatile solids removal in the reactors at
both temperatures for the same loading rates was in a
similar range and was still 65% at 19 days hydraulic
retention time. Although more biogas was produced in
the thermophilic reactor, the energy conservation in
methane was slightly lower, because of a lower methane
content, compared to the biogas of the mesophilic re-
actor. The slightly lower amount of energy conserved in
the methane of the thermophilic digester was presum-
ably balanced by the hydrogen that escaped into the gas
phase and thus was no longer available for methano-
genesis. In the thermophilic process, 1.4 g/l ammonia
was released, whereas in the mesophilic process only 1 g/l
ammonia was generated, presumably from protein
degradation. Inhibition studies of methane production
and glucose fermentation revealed a K
i
(50%) of 3 g/l
and 3.7 g/l ammonia (equivalent to 0.22 g/l and 0.28 g/l
free NH
3
)at37°C and a K
i
(50%) of 3.5 g/l and 3.4 g/l
ammonia (equivalent to 0.69 g/l and 0.68 g/l free NH
3
)
at 55 °C. This indicated that the thermophilic ¯ora
tolerated at least twice as much of free NH
3
than the
mesophilic ¯ora and, furthermore, that the thermophilic
¯ora was able to degrade more protein. The apparent
ammonia concentrations in the mesophilic and in the
thermophilic biowaste reactor were low enough not to
inhibit glucose fermentation and metha ne production
of either process signi®cantly, but may have been high
enough to inhibit protein degradation. The data indi-
cated either that the mesophilic and thermophilic
protein degraders revealed a dierent sensitivity to-
wards free ammonia or that the mesophilic population
contained less versatile protein degraders, leaving more
protein undegraded.
Introduction
Anaerobic fermentation of the organic fraction of wastes
is a suitable method to reduce both volume and mass for
deposition in sanitary land®lls. Approximately 33% of
household wastes (annual amount 70±140 kg/in-
habitant; Lu
È
bben 1994) can be separated as bioorganic
wet waste. The residual semi- dry fraction (67%) may be
disposed of either in sanitary land®lls or be incinerated,
leading to an increased caloric energy output per mass
unit, because of its decreased water content. Biological
treatment of the wet organic fraction can be performed
either in the presence of air (composting) or in the ab-
sence of air (biogas fermentation, sometimes in accu-
rately, called anaerobic composting). In 1996,
composting plants with a total capacity of 2.4 ´ 10
6
tonnes bioorganic wastes were in operation in Germany,
whereas the total capacity for anaerobic fermentation
was only 0.19 ´ 10
6
tonnes (Biehler and Nuding 1996).
Anaerobic fermentation signi®cantly reduces the
total mass of wastes, generates solid or liquid fertilizer
and yields energy. It can be maintained at psychrophilic
(12±16 °C, e.g. in land®lls, swamps or sediments),
mesophilic (35±37 °C, e.g. in the rumen and in anaerobic
digester) and thermophilic condition s (55±60 °C; e.g. in
anaerobic digesters or geothermally heated ecosystems).
Disadvantages of thermophilic anaerobic fermentation
are the reduced process stability and reduced dewatering
properties of the fermented sludge an d the requirement
for large amounts of energy for heating, whereas the
thermal destruction of pathogenic bacteria at elevated
temperatures was considered a big advantage (Steiner
and Kandler 1983; Winter and Temper 1987). The
slightly higher rates of hydrolysis and fermentation
Appl Microbiol Biotechnol (1997) 48: 405±410 Ó Springer-Verlag 1997
C. Gallert (8) á J. Winter
Institut fu
È
r Ingenieurbiologie und Biotechnologie des Abwassers,
Universita
È
t Karlsruhe, Am Fasanengarten,
D-76131 Karlsruhe, Germany
Tel.: 0721/608 3274
Fax: 0721/694826
e-mail:
under thermophilic conditions have not led to a higher
methane yield. Hashimoto et al. (1981) reported no
signi®cant change in the total methane yield from
organic matter for fermentation temperatures ranging
from 30 °Cto60°C.
Compared to mesophilic fermentation conditions, at
higher temperatures the pH increased through a re-
duced solubility of carbon dioxide, leading to a higher
proportion of free ammonia. Ammonia is generated
during anaerobic degradation of urea or proteins.
Livestock manure from pork and poultry contains
about 4 g N/l (Angelidaki and Ahring 1991), that from
cattle about 1.5 g N/l (Angelidaki and Ahring 1993). In
the organic fraction of household waste the organic
nitrogen that was released as ammonia during anaero-
bic fermentation amounted to 2.15 g N/l (Jager et al.
1989). Free ammonia may be inhibitory for anaerobic
fermentation and may be toxic for methanogenic
bacteria (Angelidaki and Ahring 1993). Inhibitory
NH
3
concentrations under mesophilic conditions of
80±150 mg N/l at a pH of 7.5 have been reported
(Koster and Lettinga 1984; Braun et al. 1981). Under
thermophilic conditions at a pH of 7.2±7.3, for ace-
ticlastic methanogens, inhibitory concentrations of free
ammonia of 3.5 g/l NH
4
-N/l (250 mg/l NH
3
-N) were
found and, for hydrogenolytic methanogens, 7 g/l
NH
4
-N/l (500 mg/l NH
3
-N) (Angelidaki and Ahring
1993; Borja et al. 1996).
In this study, we compare the fermentation of the wet
organic fraction of household wastes in laboratory scale
reactors under meso- and thermophilic conditions,
concentrating on the conversion of organic nitrogen into
ammonia and inhibition of carbon removal by ammo-
nia.
Materials and methods
Source of wet organic waste
The bioorganic fraction of household wastes was manually sorted,
moistened with tap water (250 ml/kg waste) and homogenized with
an Ultraturrax homogenizer. The homogenate was divided between
plastic bottles and frozen until required for anaerobic fermentation.
Each batch of homogenized waste slurry was analysed and the
results are shown in Table 1. For the experiments described here,
four dierent batches were thoroughly mixed and the analytical
parameters of the mixture separately determined (Table 1).
Continuous anaerobic fermentation experiments
in biogas reactors
Two reactors (glass columns, inner diameter 10 cm, total height
80 cm, liquid height 60 cm) with a working volume of 4.8 l were
used for anaerobic fermentation of biowaste. To maintain homo-
geneity, biowaste slurry and fermentation gas (ratio approximately
1:1) were withdrawn from the surface of the liquid and recirculated
into the bottom part of the reactor with a pump (recirculation rate
20/h). The temperature of 37 °C (mesophilic reactor) or 55 °C
(thermophilic reactor) was maintained by circulating water from a
water-bath heater (B. Braun, Melsungen) through a water jacket
surrounding the reactors. The reactors were fed batchwise with
fresh waste once a day. To maintain process stability at 19 days
hydraulic retention time (t
HR
) the feed had to be added at 12-h
intervals twice a day. Biogas production was measured continu-
ously with a gas meter (Ritter, Hanau) and the pH was controlled
on-line with a pH electrode (WTW, Weilheim) inserted into the
recirculation line.
Initially the reactors were ®lled with anaerobic sludge from the
municipal sewage treatment plant of Regensburg (Germany). After
an adaptation time of 2 weeks at 37 °C (mesophilic reactor) and
55 °C (thermophilic reactor), 240-ml aliquots were replaced by a
1:1 mixture of fresh sewage sludge and biowaste slurry. Gas pro-
duction, pH and fatty acids were monitored. When the gas pro-
duction ceased and the pH reached 7.4, 240 ml digester content was
again replaced, this time by only biowaste slurry. When the gas
production ceased again, a fed-batch feeding once per day to
maintain an initial t
HR
of 93 days was started. After process sta-
bilization, the t
HR
in both reactors was reduced stepwise and
concomitantly the loading was increased, as indicated later.
Batch digestion experiments in serum bottles
The euent of the mesophilic and the thermophilic biowaste re-
actor was centrifuged in a WKF-50-K centrifuge (Gesellschaft fu
È
r
elektrophysikalischen Apparatebau, Brandau) at 830 g for 10 min
to separate most of the solid waste particles (about 80%) from the
suspended biomass. The supernatant fraction contained the sus-
pended bacteria and the small-particulate sludge ¯ocs, including
most of the Methanosarcina sp., as judged from microscopy with a
phase-contrast ¯uorescence microscope. It was used as an inoculum
for testing the eect of ammonia on glucose fermentation and
methanogenic activity during anaerobic fermentation by the me-
sophilic and thermophilic biowaste ¯ora.
Batch experiments were performed in 120-ml serum bottles,
supplemented with 45 ml potassium phosphate buer (50 mM,
pH 7.8), 4.5 mM glucose and 5 ml bacterial inoculum. All experi-
ments were prepared in an anaerobic chamber (Coy, Ann Arbor,
Mich. USA). Colourless resazurin guaranteed a redox potential of
less than A350 mV. Dierent ammonia or NaCl concentrations
were obtained by addition of the respective portions of a concen-
trated NH
4
Cl or NaCl solution, made oxygen-free by heating un-
der vacuum and regassing with nitrogen. Assays without addition
of ammonia or with addition of NaCl were run as controls. Each
experiment was done in duplicate.
Analytical methods
Standard procedures (Deutsche Einheitsverfahren zur Wasser-,
Abwasser und Schlammuntersuchung 1983) were used to determine
total solids, volatile solids, alkalinity, Kjeldahl nitrogen and am-
monia. The chemical oxygen demand (COD) was measured after
Table 1 Carbon and nitrogen parameters of dierent batches of
homogenized biowaste. Minimum and maximum values diered
because of the dierent compositions and moisture contents of the
input material. COD chemical O
2
demand, DOC dissolved organic
C, TKN total Kjeldahl N
Parameter Minimum Maximum Mixture
for expt.
COD
total
(g/l) 118 215 176
COD
diss
(g/l) 46 93 71
COD
diss
/COD
tot
(%) 38 42 40
DOC (g/l) 16 37 25
Total solids (g/l) 139 200 184
Volatile solids (g/l) 121 178 172
TKN (mg/l) 1650 4040 3107
NH
4
(mg/l) 175 349 260
pH 4 5.5 5.3
406
oxidation of the organic material in the homogenized sample with
potassium dichromate/sulphuric acid according to Wolf and
Nordmann (1977). The dissolved proportion of the COD and the
dissolved organic carbon were measured after ®ltration (pore size
0.45 lm) of samples. The dissolved organic carbon was analysed by
infrared spectroscopy with a Tocor 2 carbon analyser (Maihak,
Hamburg).
The methane content of the biogas and volatile fatty acids were
determined by gas chromatography. For measurement of methane,
a Packard model 427 gas chromatograph with a thermoconduc-
tivity detector and nitrogen as the carrier and reference gas, at a
¯ow rate of 10 ml/min, was used. For isothermal separation of
gases at 30 °C, a Poropack N (80±100 mesh; Sigma, Deisenhofen)
Te¯on column (1.8 m length, inner diameter 1.5 mm) was used.
Detector and injector temperatures were set at 100 °C.
Volatile fatty acids were analysed with a Packard model 437 gas
chromatograph and an automatic liquid sampler, model 911
(Chrompack, Frankfurt). The gas chromatograph was equipped
with a ¯ame ionization detector, supplied with H
2
(30 ml/min) and
oxygen (300 ml/min). Detector and injector temperatures were set
at 210 °C and the oven was heated to 180 °C. Fatty acids were
separated on a 2-m Te¯on column (1.5 mm inner diameter), ®lled
with Chromosorb C101 (80±100 mesh; Sigma, Deisenhofen).
Samples were acidi®ed with phosphoric acid (5%) and clari®ed by
centrifugation before injection. The concentration of ammonia
NH
3
NH
4
in the samples was determined with a colorimetric
test from Merck Co. (Merck, 1974). In the test system ammonia
ions form indolphenol blue with salicylate and hypochlorite ions,
which can be quanti®ed spectrophotometrically at 655 nm in a
concentration range of 0.03±1 mg/l NH
4
. The concentration of
free ammonia (NH
3
-N) was calculated according to Anthonisen et
al. (1976):
NH
3
-N
NH
4
-N Â 10
pH
u
b
au
w
10
pH
u
b
au
w
e
6344a273
where N concentrations are in mg/l and T is in °C.
Glucose was measured photometrically according to Lever
(1972) as p-hydroxybenzoic acid hydrazide at 410 nm. The rela-
tionship was linear for a concentration range of 0±250 mg/l.
The theoretical quantity of methane and carbon dioxide pro-
duced under anaerobic conditions was calculated from the C/H/O/
N ratio of the slurry according to Buswell and Mueller (1952), as
modi®ed by Richards et al. (1991):
C
n
H
O
N
nÀ0X25 À 0X5 1X75H
2
O
30X5n0X125 À 0X25 À 0X375CH
4
0X5nÀ0X125 0X25 À 0X625CO
2
NH
4
HCO
À
3
Results
Biowaste fermentation at mesophilic
and thermophilic temperatures
Digested sewage sludge from the anaerobic reactor of
the city of Regensburg was acclimated to biowaste di-
gestion at 37 °Cand55°C beginning with an apparent
t
HR
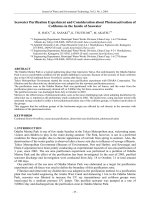
of 93-days as mentioned. In the mesophilic reactor
the COD removal eciency during stepwise reduction of
the t
HR
to 80, 60 and 50 days was around 85% (Fig. 1a).
When t
HR
was further reduced to 19 days, equivalent to
a space loading of 9.65 g COD l
A1
day
A1
, the COD-re-
moval eciency decreased to 64%. In the thermophilic
reactor the COD-removal eciency was 95% at a t
HR
of
93 days. During stepwise reduction of the retention time
to 19 days, equivalent to an increase of the space loading
to 9.65 g volatile solids l
A1
day
A1
, the COD removal
decreased steadily from 95% to 67% (Fig. 1b). The
biogas production increased from 0.3 l l
A1
day
A1
at 93
days t
HR
to 5.3 (37 °C) or 5.6 (55 °C) l l
A1
day
A1
at 19
days t
HR
(Fig. 1a, b). With every stepwise reduction of
t
HR
below 50 days, propionate accumulated, reaching
10 mM on some days in the mesophilic reactor, whereas
the thermophilic reactor tended to accumulate acetate
up to 40 mM, before steady-state conditions, with less
than 1 mM propionate or 4 mM acetate, were achieved
again. The reacto r performance of anaerobic biowaste
fermentation at 37 °Cand55°Catt
HR
= 19 days is
summarized in Table 2. At a COD loading of
9.65 g l
A1
day
A1
63% or 67% of the COD was degraded
at 37 °Cor55°C and the volatile solids reduction was
64% and 65% respectively. Although the gas production
per litre of reactor volume and per day was apparently
slightly higher in the thermophilic reactor, because of a
reduced solubility of CO
2
at the higher temperature, in
total little more methane was produced in the mesophilic
reactor. This was due to a methane content of the biogas
of 67% in the reactor run at 37 °C but only 59% in the
Fig. 1a,b Eciency of mesophilic (a) and thermophilic (b) biowaste
fermentation at increasing loading rates. A portion of the c ontent of
each fermenter was manually replaced once per day with fresh
biowaste to maintain the respective loading rate/hydraulic retention
time (t
HR
). Biogas production and chemical O
2
demand (COD)
removal were determined. r Loading rate ( VS volatile solids),
n COD removal, Ð hydraulic retention time, m biogas production
407
reactor run at 55 °C (Table 2). The total energy release
by gases in both reactors may have been identical,
however, since the gas of the thermophilic reactor con-
tained some hydrogen (not quanti®ed). The ammonia
content of the euent of the thermophilic reactor was
notably higher, indicating that apparently more protein
was degraded at 55 °C than at 37 °C.
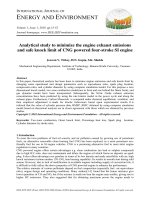
The pH of the mesophilic and thermophilic reactors
during one feeding cycle at t
HR
= 22 days is shown in
Fig. 2. Within 1 h after addition of the biowaste slurry,
preacidi®ed to a pH of pH 5.3, the pH of the reactor
content dropped from 7.5 to 6.75 and slowly increased
again to 7.4/7.5 within 24 h. Due to the sharply de-
creasing pH after sludge addition, the CO
2
content of
the biogas increased in the ®rst hours after feeding and
dropped later on, resulting in an average methane con-
tent for the biogas collected during one feeding cycle of
67% in the mesophilic reactor and 59% in the thermo-
philic reactor. The alkalinity (K
s
for a pH change from
7.5 to 6.5) was 17 mmol/l in the mesophilic reactor
and 25.6 mmol/l in the thermophilic reactor. In both
reactors the buer capacity was too small to avoid
acidi®cation after substrate addition (Fig. 2).
Ammonia inhibition of the biogas process at 37 °C
and 55 °C
Each 5-ml sample of a bacterial suspension from
mesophically and thermophically fermented biowaste
slurry, containing mainly the bacteria and some ®ne-
particulate material, with a dry weight content of 11 g/l
in total (prepared as described in Materials and meth-
ods), was suspended in 45 ml phosphate buer
(50 mmol/l, pH 7.8, containing 4.5 mmol/l glucose) and
supplemented with 0±35 g/l NH
4
Cl or NaCl. Glucose
degradation rates were determined for the time span
necessary for 80%±90% degradation of the initial
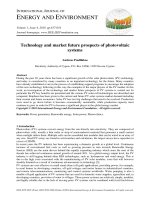
amount and are shown in Fig. 3a. With increasing
concentration of ammonia, glucose degradation was
slightly more inhibited at 55 °C than at 37 °C. Th e K
i50
for ammonia-N was 3.7 g/l at 37 °C (=0.28 g NH
3
-N)
and 3.4 g/l at 55 °C (=0.68 g NH
3
-N). The K
i50
was
similarly determined for methane production (Fig. 3b).
A 50% inhibition was seen at 3.0 g/l ammonia-N
(=0.22 g/l NH
3
-N) in the mesophilic reactor and at
3.5 g ammonia-N (=0.69 g/l NH
3
-N) in the thermo-
philic reactor (Table 3). In the presence of 5 g/l NaCl,
glucose degradation and methane production were not
signi®cantly in¯uenced, whereas in the presence of 15 g/l
NaCl or more, methane was no longer produced, pre-
sumably because of the high salinity.
Discussion
Manually fractionated biowaste was digested at 37 °C
and 55 °C in a one-stage recirculated suspension reactor
at a minimal t
HR
of 19 days, equivalent to a volatile
solids loading of 9.4 g l
A1
day
A1
. Similar short retention
times for less concentrated biowastes were applied for
the single-stage processes of WABIO, Bio-Stab or Ko-
mpogas reactors, whereas the methane reactor in pro-
cesses with a separate hydrolysis reactor and a
Table 2 Parameters of the
biowaste reactors at 37 °C and
55 °C. VS volatile solids
a
Including COD of ®ne-partic-
ulate matter that was not
sedimented
Parameter Mesophilic
fermentation
Thermophilic
fermentation
Reactor temperature (°C) 37 55
Loading rate (g COD l
A1
day
A1
) 9.65 9.65
(g VS l
A1
day
A1
) 9.4 9.4
(g TKN-N l
A1
day
A1
) 0.17 0.17
Hydraulic retention time (days) 19 19
COD
diss
in euent
a
(%) 13.2 30.7
COD reduction (%) 63 67
VS reduction (%) 64 65
Space productivity (l biogas l
A1
day
A1
) 5.3 5.6
Methane content (%) 67 59
Methane (l l reactor volume
A1
day
A1
) 3.5 3.3
NH
4
-N in euent (mg/l) 1004 1389
Fig. 2 pH pro®le o f mesophilic and thermophilic biowaste fermen-
tation for one feeding cycle at 22 days hydraulic retention time.
Samples c omprising 220 ml digested biowaste w ere replaced by fresh,
pre-acidi®ed waste ( pH 5.3). After homogenizat ion f or 10 min, a pH
of 7.0 w as obtained, which dropped further as a result of t he ongoing
acidi®cation r 55 °C,
d 37 °C
408
separation unit for non-hydrolysed solids (e.g. ®xed-bed
reactor of BTA or MAT) could be operated with only 5
days t
HR
at the same eciency (Scherer 1995).
The removal of volatile solids was in the same range
for mesophilic and thermophilic fermentation of our
biowaste slurry. The ®nal volatile solids loading of
9.4 g l
A1
day
A1
in the laboratory reactors was higher
than reported for full-scale plants (e.g. 5±8 g l
A1
day
A1
;
Gessler and Keller 1995). The volatile solids removal
(64%±65%) was also higher in the laboratory reactors
under mesophilic and thermophilic fermentation condi-
tions, as compared to many full-scale plants, where it
was around 55% (Ku
È
bler 1994; Gessler and Keller
1995). Rivard et al. (1995) reported a very high COD
removal eciency of 77% for municipal solid wastes and
tuna processing wastes at mesophilic fermentation tem-
peratures for loading rates up to 14 g volatile solids
l
A1
day
A1
. Kayhanian (1995 ) observed a degradation of
83% of the volatile solids fraction of wet waste in a
fermentation with a high solids content at 30 days t
HR
.
A highly ecient volatile solids removal may lead to
a reduced viscosity and a better separation of solids. The
supernatant of the euent of our mesophilic and ther-
mophilic biowaste digester contained 13.2% (37 °C) or
30.7% (55 °C) of the non-degraded COD, respectively,
after sedimentation of large solids. Whereas the super-
natant of the mesophilic reactor euent contained
mainly soluble organic components, the supernatant of
the thermophilic reactor euent in addition contained a
high proportion of ®ne-particulate, suspended material.
The sediment of both euents came from non-degraded
particles, such as lignin and ligni®ed plant material,
which in municipal solid waste may comprise up to 15%
of the total COD (Barlaz et al. 1989).
The space productivity of biogas was 5.3 l l
A1
day
A1
at 37 °C and 5.6 l l
A1
day
A1
at 55 °C. Ku
È
bler (1994) re-
ported biogas space productivities for wet waste fer-
mentation of 4 l l
A1
day
A1
for the thermophilic BTA
process, whereas with cattle manure maximal space
productivities of 5.58 l l
A1
day
A1
, (mesophilic fermenta-
tion) and 6.67 l l
A1
day
A1
(thermophilic fermentation)
were reported by Mackie and Bryant (1995).
Although a little less biogas was produced in our
mesophilic biowaste reactor, becau se of the higher
methane content in the biogas the total amount of
methane per litre of reactor volume and per day was
higher than that in the gas of the thermophilic reactor
(Table 2). A similar observation was reported by Mackie
and Bryant (1995) for the digestion of cattle manure.
The advantage of thermophilic digestion was mainly
that the euent was rendered hygienic by inactivation of
bacteria (Ku
È
bler 1994) or viruses (Lund et al. 1996).
The speci®c gas production per gram of COD or per
gram of volatile solids degraded was high in both of our
reactors. This was the result of a high lipid and fat
content of the biowaste input material, caused by the
addition of a batch of spoiled butter. Consequently the
speci®c methane productivity was also high: 0.59 l/g at
37 °C and 0.54 l/g volatile solids degraded at 55 °C
(calculated from data of Table 2). For carbohydrates a
theoretical methane yield of 0.35 l/g would be expected.
High speci®c methane yields of 0.4±0.59 l/g were also
reported for thermophilic household solid waste diges-
tion, by Rintala and Ahring (1994).
One obvious result of thermophilic biowaste diges-
tion was the higher yield of ammonia: 1.4 g/l at 55 °C
compared to 1 g/l at 37 °C fermentation temperature,
presumably from protein degradation. Angelidaki and
Ahring (1993) reported a 25% inhib ition of livestock
waste digestion at thermophilic conditions in the pres-
ence of 4 g ammonia-N/l, equivalent to 900 mg free
NH
3
/l at the respective pH. The inhibitory eect was
more pronounced on aceticlastic than on hy drogenolytic
Fig. 3a, b Inhibiting eect of ammonia on mesophilic and thermo-
philic glucose fermentation (a) and methane production ( b). The
bacterial ¯ora of the mesophilic and thermophilic biowaste digester
was separated from the euent by pelleting the solid particles. Then it
was diluted in phosphate buer and supplemented with ammonium
chloride or NaCl as described under Materials and methods.
d Mesophilic incubation at 37 °C, r thermophilic i ncubation at 55 °C
Table 3 K
i50
values for NH
4
aNH
3
and for NH
3
. Up to 5 g/l NaCl
there was no inhibition of glucose fermentation and methane
production
Process K
i50
NH
4
aNH
3
-N
(g/l)
K
i50
NH
3
-N
(g/l)
Methane production, 37 °C 3.0 0.22
Methane production, 55 °C 3.5 0.69
Glucose degradation, 37 °C 3.7 0.28
Glucose degradation, 55 °C 3.4 0.68
409
methanogens. Adaptation from 4 g to 6 g N/l required a
time span of 6 months. We observed a 50% inhibition at
37 °C and 55 °C by 3±3.7 g ammonia/l for glucose fer-
mentation and methanogenesis as well. The inhibitory
eect was presumably due to the free permeability of
NH
3
through the cell membrane. At the actual pH of 7.6
in the reactors, 0.22±0.28 g free NH
3
/l caused a 50%
inhibition of mesophilic glucose fermentation and
methane production, whereas 0.68±0.69 g free NH
3
/l
caused a 50% inhibition of both processes at 55 °C.
In the mesophilic reactor in the presence of 1 g total
ammonia at a pH of 7.6 the NH
3
concentration was
calculated to be around 0.03 g and, in the thermophilic
reactor at 1.4 g total ammonia, around 0.126 g/l. These
free ammonia concentrations were too low to in¯uence
methanogenesis signi®cantly. On the other hand, from
the total Kjeldahl N of the biowaste during mesophilic
digestion, only about 1/3, and during thermophilic di-
gestion about 1/2, was converted to ammonia. If this is
not a speci®c phenomenon of the mesophilic and ther-
mophilic population in our reactors, it may indicate that
protein degradation is inhibited by free ammonia, with a
higher sensitivity at mesophilic than at thermophilic
reactor temperatures.
Acknowledgement We thank Martin Stu
È
tzel for his experimental
input during the preparation of his diploma thesis.
References
Angelidaki I, Ahring BK (1991) Ammonia inhibition during an-
aerobic thermophilic degradation of animal waste. In: Verach-
tert H, Verstraete W (eds) Proceedings of the International
Symposium on Environmental Biotechnology, Royal Flemish
Society of Engineers, 22±25 April 1991, vol 2 pp 389±392
Angelidaki I, Ahring BK (1993) Thermophilic anaerobic digestion
of livestock waste: the eect of ammonia. Appl Microbiol
Biotechnol 38: 560±564
Angelidaki I, Ahring BK (1994) Anaerobic thermophilic digestion
of manure at dierent ammonia loads: eect of temperature.
Water Res 28: 727±731
Anthonisen AC, Loehr RC, Prakasam TBS, Srinath EG (1976)
Inhibition of nitri®cation by ammonia and nitrous acid. J
Water Pollut Control Fed 48: 835±849
Barlaz MA, Schaefer DM, Ham RK (1989) Bacterial population
development and chemical characteristics of refuse decompo-
sition in a simulated sanitary land®ll. Appl Environ Microbiol
55: 55±65
Biehler MJ, Nuding R (1996) Vergleich verschiedener Verfahren
zur Verwertung von Bio- und Gru
È
nabfa
È
llen auf kommunaler
Ebene. Abfallwirtschaftsjournal 9: 28±38
Borja R, Sanchez E, Weiland P (1996) In¯uence of ammonia
concentration on thermophilic anaerobic digestion of cattle
manure in up¯ow anaerobic sludge blanket (UASB) reactors.
Process Biochem 31: 477±484
Braun R, Huber P, Meyrath J (1981) Ammonia toxicity in liquid
piggery manure digestion. Biotechnol Lett 3: 159±164
Buswell AM, Mueller HF (1952) Mechanics of methane fermen-
tation. J Ind Eng Chem 44: 550
Deutsche Einheitsverfahren zur Wasser-, Abwasser- und
Schlammuntersuchung (1979±1983), VCH Verlagsgesellschaft
Weinheim
Gessler G, Keller K (1995) Vergleich verschiedener Verfahren zur
Verga
È
rung von Bioabfall. Abfallwirtschaftsjournal 7: 377±382
Hashimoto AG, Varel VH, Chen YR (1981) Ultimate methane
yield from beef cattle manure: eect of temperature, constitu-
ents, antibiotics and manure age. Agric Waste 3: 241±256
Jager J, Burth M, Homeyer P, Messerschmidt K, Steiner M,
Wiegel U (1989) Biomu
È
llsammlung und -kompostierung.
Vero
È
entlichungen der Ingenieursgemeinschaft Technischer
Umweltschutz. Verlag Dr. J. H. Jager, Berlin
Kayhanian M (1995) Biodegradation of the organic fraction of
municipal solid waste in a high-solids anaerobic digester. Waste
Manage Res 13: 123±136
Koster IW, Lettinga G (1984) The in¯uence of ammonia-nitrogen
on the speci®c activity of pelletized methanogenic sludge. Agric
Waste 9: 205±216
Ku
È
bler H (1994) Versuch zur thermophilen Faulung von kom-
munalem Bioabfall. Mu
È
ll Abfall 8: 478±488
Lever M (1972) A new reaction for colorimetric determination of
carbohydrates. Anal Biochem 47: 273±279
Lu
È
bben S (1994) Organische Abfa
È
lle in einer Groûstadt-Mengen
und Verwertungsmo
È
glichkeiten. In: H Ma
È
rkl, R Stegmann (eds)
Anaerobe Behandlung von festen und ¯u
È
ssigen Ru
È
cksta
È
nden.
Dechema Monogr 130: 207±230
Lund B, Jensen VF, Have P, Ahring BK (1996) Inactivation of
virus during anaerobic digestion of manure in laboratory scale
biogas reactors. Antonie van Leeuwenhoek 69: 25±31
Mackie RI, Bryant MP (1995) Anaerobic digestion of cattle waste
at mesophilic and thermophilic temperatures. Appl Microbiol
Biotechnol 43: 346±350
Merck E (1974) Die chemische Untersuchung von Wassser. 13.
Au¯age, Darmstadt
Richards BK, Cummings RJ, White TE, Jewell WJ (1991) Methods
for kinetic analysis of methane fermentation in high solids
biomass digestors. Biomass Bioenergy 1: 65±73
Rintala JA, Ahring BK (1994) Thermophilic anaerobic digestion of
source-sorted household solid waste: the eects of enzyme ad-
ditions. Appl Microbiol Biotechnol 40: 916±919
Rivard CJ, Rodriguez JB, Nagle NJ, Self JR, Kay BD, Soltanpour
PN, Nieves RA (1995) Anaerobic digestion of municipal solid
waste. Appl Biochem Biotechnol 51/52: 125±135
Scherer PA (1995) Stand der Technik zur Verga
È
rung fester Ab-
fallstoe: Umweltaspekte, Prinzipien und Varianten.
Abfallwirtschaftsjournal 6: 385±410
Steiner A, Kandler O (1983) Anaerober Abbau von Schlacht-
hofabwa
È
ssern. In: Anaerobe Abwasser- und Schlammbehand-
lung-Biogastechnologie. Mu
È
nchener Beitra
È
ge zur Abwasser-,
Fischerei- und Fluûbiologie Band 36: 193±212. Oldenbourg,
Mu
È
nchen
Winter J, Temper U (1987) Mikrobiologie der anaeroben
Abwasserreinigung. Abwassertech Abfalltech Recycl 38: 14±21
Wolf P, Nordmann W (1977) Eine Feldmethode fu
È
r die Messung
des CSB von Abwasser. Korrespondenz Abwasser 24: 277±279
410