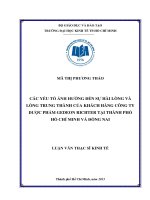
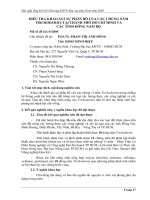
Phản ứng của cộng đồng với tiếng ồn máy bay tại thành phố Hồ Chí Minh và Hà Nội
Bạn đang xem bản rút gọn của tài liệu. Xem và tải ngay bản đầy đủ của tài liệu tại đây (1.44 MB, 9 trang )
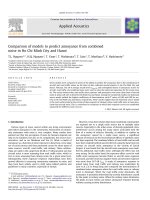
Community response to aircraft noise in Ho Chi Minh City and Hanoi
Thu Lan Nguyen
a,
⇑
, Takashi Yano
a
, Huy Quang Nguyen
a
, Tsuyoshi Nishimura
b,1
, Hiroaki Fukushima
b,1
,
Tetsumi Sato
c,2
, Takashi Morihara
d,3
, Yoritaka Hashimoto
e,4
a
Graduate School of Science and Technology, Kumamoto University, 2-39-1 Kurokami, 860-8555 Kumamoto, Japan
b
Graduate School of Engineering, Sojo University, 4-22-1 Ikeda, 860-0082 Kumamoto, Japan
c
Faculty of Engineering, Hokkai Gakuen University, Minami 26-Jo, Chuo-ku, 064-0926 Sapporo, Japan
d
Ishikawa National College of Technology, Kitachujo Ta-1, Tsubata, Kahoku, 929-0392 Ishikawa, Japan
e
Faculty of General Information, Okayama University of Science, Ridai-cho 1-1, Kita-ku, 700-0005 Okayama, Japan
article info
Article history:
Received 1 November 2010
Received in revised form 21 March 2011
Accepted 6 May 2011
Available online 31 May 2011
Keywords:
Aircraft noise
Dose–response relationships
Developing country
abstract
To formulate Vietnamese and global noise policies, social surveys on community response to aircraft
noise and combined noise from aircraft and road traffic were carried out in Ho Chi Minh City from August
to September 2008 and in Hanoi from August to September 2009. In total, 1562 and 1397 responses were
obtained in Ho Chi Minh City and Hanoi, respectively. The aircraft noise was measured for seven succes-
sive days, and the combined noise was measured for 24 h. Aircraft and combined noise exposures ranged
from 53 to 71 dB and 73 to 83 dB L
den
in Ho Chi Minh City and from 48 to 61 dB and 70 to 82 dB L
den
in
Hanoi, respectively. The dose–response curve for aircraft noise for Vietnam was established and fitted
onto the curve for the European Union. For the same noise exposure, the aircraft noise annoyance in
Hanoi was higher than that in Ho Chi Minh City because of the lower background noise level in Hanoi.
Ó 2011 Elsevier Ltd. All rights reserved.
1. Introduction
Noise policies are broad in scope. They must include at least
exposure limits and an action plan of noise abatement as well as
expenses and payment that cover many fields of technical, social,
and economic sciences. Community noise-control policies and
guidelines on mitigating noise have been laid down in many devel-
oped countries, especially in Europe [1–3]. Boegli et al. [4] intro-
duced a noise abatement policy consisting of six basic principles
in which exposure–response relationships were defined as the
base principle of the framework. Miedema and Vos [5] presented
exposure–response relationships for three transportation noise
sources. These strongly affected the recommended curves in suc-
cessive EU position papers in 2002 (e.g., [1]) and then affected
EU noise regulation. In 1999, to facilitate global coverage and
applicability, the Guidelines for Community Noise (WHO) [6] were
prepared to improve guidance at the national and regional level.
The guideline values were given for specific environments, for
example, a criteria level that is defined to cause a serious annoy-
ance during daytime and in the evening for the outdoor living area
is 55 dB (L
Aeq
). However, it has been pointed out in many studies
that community response to noise was affected by non-acoustic
factors such as culture, climate, lifestyle, and house type [7–9].
Hence, a question arises as to whether the findings of previous
studies, which were obtained mainly for developed countries, are
applicable to the rest of the world, especially developing countries.
Many papers on noise policies in developing and emerging coun-
tries were presented by Finegold and Schwela [10]. They empha-
sized a concern about whether the approaches being taken by
western governments are applicable for implementation in devel-
oping and emerging countries. Indeed, a special effort was said to
be needed in order to better understand the differences between
‘‘developed’’ and ‘‘developing and emerging’’ countries and the
implications of these differences in implementing adequate noise
control approaches. Vietnam is the second most populous country
in Southeast Asia with 31.7 million people living in urban areas
accounting for 37% of the national population. The impact of mar-
ket-based economic transformation and its pace have severely af-
fected Vietnam’s transportation conditions, resulting in an
increasing volume of traffic and much noise being emitted from
vehicles. The involvement of Vietnam will contribute to the knowl-
edge of the situation of developing and emerging countries in
terms of environmental noise in the world. It is supposed to be a
meaningful voice when global policies are discussed.
0003-682X/$ - see front matter Ó 2011 Elsevier Ltd. All rights reserved.
doi:10.1016/j.apacoust.2011.05.002
⇑
Corresponding author. Address: Kumamoto University, Graduate School of
Science and Technology, Department of Architecture, 2-39-1 Kurokami, 860-8555
Kumamoto, Japan. Tel.: +81 96 342 3560.
E-mail addresses: (T.L. Nguyen),
ac.jp (T. Yano), (H.Q. Nguyen),
(T. Nishimura), (T. Sato),
(T. Morihara), (Y. Hashimoto).
1
Tel.: +81 96 326 3605.
2
Tel.: +81 11 841 1161.
3
Tel.: +81 76 288 8185.
4
Tel.: +81 86 256 9634.
Applied Acoustics 72 (2011) 814–822
Contents lists available at ScienceDirect
Applied Acoustics
journal homepage: www.elsevier.com/locate/apacoust
The first official document relating to noise assessment in
Vietnam was published in 1979 and was for noise in the work-
place. It was known as TCVN3150-1979 and regulated ‘‘Methods
for measuring noise at workplaces in manufacturing areas’’. It took
until 1988 for the first specific data on community noise exposure
measured in Hanoi, the capital of Vietnam, to be published. How-
ever, documented data are very limited with only three noise val-
ues available during a day—average level for the rush hour in the
morning, rush hour in the afternoon, and all day. In total, 41 noise
standards have been promulgated in Vietnam up to November
2009. These standards have mainly focused on acoustic measure-
ment methods and noise emitted by particular vehicles and ma-
chines. Community noise is mentioned in only one standard—
TCVN 1549-1998. This standard regulates the maximum permitted
noise level in public and residential areas irrespective of the
sources of that noise. These standards are constructed based on
the experience of western countries and Japan. Actual exposure
data measured in two major cities in Vietnam, Hanoi and Ho Chi
Minh City, were shown to exceed those regulated in these criteria
by 8–33 dB. The application of these standards is indeed very lim-
ited since they were not constructed based on actual figures from
Vietnam and were not accompanied by the documents of cooper-
ation or pays principles.
Therefore, the first and also the most important thing needed to
do to initiate the establishment of noise policy in Vietnam is to
propose dose–response relationships based on actual data of expo-
sure and community response in Vietnam. In order to meet this
requirement, community response to transportation noise has
been investigated in Hanoi and Ho Chi Minh City, since 2004. It
has been found that the Vietnamese were less annoyed by road
traffic noise by about 5 dB than European people [11]. The dose–
response relationships for the Vietnamese were established for
road traffic noise exposure and annoyance response. The present
study, which assesses the effects of another type of transportation
noise, that is, aircraft noise, is essential to generate a database for
formulating Vietnamese and global noise policies.
Along with the rapid development of road traffic, another sec-
tion of Vietnam’s transportation network, the civil aviation market,
is now in a phase of strong and rapid growth. The civil aviation
market is expected to carry 84 million passengers per year by
2020 [12]. The existence of many residential areas in the vicinity
of almost all airports in Vietnam has made aircraft noise, together
with road traffic, a main noise source that is causing adverse effects
on the quality of Vietnamese life. This study, which analyzes the
impact of aircraft noise not only as a single source but also as a
combined source together with road traffic noise, can contribute
to the evaluation of a mixed noise environment.
Because the two airports in the two abovementioned cities tar-
geted in this study have different features, the results of this study
are expected to broaden knowledge of aircraft noise annoyance in
Vietnam. The objectives of this study are (i) to propose a represen-
tative dose–response relationship for aircraft noise annoyance in
Vietnam and (ii) to assess the acoustic and non-acoustic factors
moderating the response difference among sites and between the
two cities.
2. Methods
2.1. Survey sites
The two cities chosen for the surveys are the busiest major
metropolitan areas in Vietnam. In these cities, the effects of trans-
portation noise on the health of the urban population continue to
grow. The increase in transportation noise is due to rapid urbaniza-
tion and industrialization. Tan Son Nhat Airport, Vietnam’s largest
international airport with around 200 takeoffs and landings per
day, is located inside a crowded residential area of Ho Chi Minh
City with busy commercial streets, as shown in Fig. 1. Noi Bai
Airport is the second largest international airport in Vietnam and
provides aviation transportation for the capital city, Hanoi. The
handling capacity of Noi Bai Airport is less than half of Tan Son
Nhat Airport [13]. Noi Bai Airport is located 45 km from downtown
Hanoi and is in the hub of many national arterial roads and
industrial zones (Fig. 2).
Ten residential areas were selected around Tan Son Nhat Air-
port including eight sites under the landing and takeoff paths of
aircraft and two other sites laying to the north and south of the
runway (Fig. 1). Nine sites were selected around Noi Bai airport
including seven sites under the landing and takeoff paths of aircraft
and two sites to the south of the runway (Fig. 2). The site selection
was intended to reflect the aircraft noise exposure covering loca-
tions at various distances from and in directions relative to the
airport.
Because this study was intended to investigate aircraft noise
both as a single and as a combined source, all the sites except Sites
9 and 10 in Ho Chi Minh City and Site 6 in Hanoi were selected from
residential areas that had roads passing through them. The houses
facing the roads were selected for the combined noise survey, and
those set back from the road were selected for single aircraft noise
surveys, as shown in Fig. 3. Sites 9 and 10 in Ho Chi Minh City were
located inside a large residential area, whereas Site 6 in Hanoi is a
rural village with no major roads passing through it. Only the sur-
vey on aircraft noise was conducted at these three sites.
Fig. 1. Map of survey sites in Ho Chi Minh City. Source: Google Earth.
T.L. Nguyen et al. /Applied Acoustics 72 (2011) 814–822
815
2.2. Social surveys
Social surveys on community response to aircraft noise and
combined noise from aircraft and road traffic were conducted
around Tan Son Nhat Airport in Ho Chi Minh City from August to
September 2008 and around Noi Bai Airport in Hanoi from August
to September 2009. The surveys were conducted by face-to-face
interviews during the daytime on weekends. To guarantee a bal-
ance of males and females and generations, fathers, mothers, and
others whose age was over 18 were selected.
The design of the questionnaire followed Technical Specifica-
tion ISO/TS 15,666, in which an internationally standardized
interview method for the assessment of noise annoyance by
socio-acoustic surveys is described. That is, the questionnaire is la-
beled as ‘‘Survey on Living Environment’’. The questionnaire was
not only on noise but also various components of the living
environment. The content of the questionnaire is summarized in
Table 1. Two versions of this questionnaire were used in this
study—one for the single noise survey and the other for the com-
bined noise survey. Both questionnaires contained queries on
housing, neighborhood environment, noise annoyance, interfer-
ence with daily activities, sensitivity, attitude towards transporta-
tion, and socio-demographic items. The questionnaire used in the
combined noise survey, besides containing similar questions to
those in the single noise surveys, had additional questions related
to the annoyance caused by road traffic and combined noise. In the
questionnaire, two scales—5-point verbal and 11-point numeric—
constructed according to the ICBEN (International Commission on
Biological Effects of Noise) method were used to evaluate the
respondents’ noise annoyance [14]. The wordings used in both
questionnaires are shown in Appendix A.
2.3. Noise measurements
Since there was a lack of available noise data in Vietnam, all
noise databases for this study were compiled using field measure-
ments. Noise measurements were performed in Ho Chi Minh City
from September 22 to 29, 2008, and in Hanoi from September 10
to 17, 2009, by applying the same method in both cities. Aircraft
noise exposure was measured every 1 s for seven successive days
by using sound level meters (RION NL-21 and NL-22) in the areas
of the single noise surveys. Microphones covered with omni–
weather wind screens were positioned on the rooftops of the high-
est houses in the areas—1.5 m above the roofs and at least 1 m
away from any other reflecting surface. Flight numbers and condi-
tions were obtained from the Airport Office at each airport.
The combined noise of aircraft and road traffic was measured
every 1 s for 24 h in the areas covered in the combined noise sur-
veys. Since we selected a representative day for noise measure-
ment in a moderate season in a year, the effect of traffic volume
fluctuation and meteorological factors might be negligible. The
measurements were performed at reference points that were
1.2 m high and 2.5–5 m away from the road shoulders. The refer-
ence points were selected at the average distances from the roads
to the house facades. However, we measured road traffic noise at
points on road shoulders in open areas, e.g., vacant lots along the
road, without the effects of reflection from houses or other objects.
Traffic volume was counted by panel-replaying the video record-
ings for 10 min every hour. Road traffic noise metrics were calcu-
lated by energy subtraction of aircraft from combined noise
metrics.
3. Results and discussion
3.1. Results of social surveys
The outline of the surveys is summarized in Table 2. In total,
1562 and 1397 respondents participated in the surveys in Ho Chi
Fig. 2. Map of survey sites in Hanoi. Source: Google Earth.
Fig. 3. Illustration image of areas for the surveys on single and combined noise.
Source: Google Earth.
816 T.L. Nguyen et al. /Applied Acoustics 72 (2011) 814–822
Minh City and Hanoi, respectively. In Ho Chi Minh City, there were
880 respondents in the single noise survey and 682 respondents in
the combined noise survey. These numbers in Hanoi were 824 and
573, respectively. The response rates were very high in both cities:
the total response rates for the aircraft and combined noise surveys
were 88% and 85% in Ho Chi Minh City and 91.6% and 76.4% in Ha-
noi, respectively.
Some of the socio-demographic factors of the surveys in both
cities are summarized and compared with the demographics of
the Vietnamese population in Table 3. The ratio of males to females
in all surveys was well balanced and comparable to the ratio ob-
tained in the Vietnam population census. For the two surveys,
89% and 92% of respondents in Ho Chi Minh City were in the age
range from 20 to 60; corresponding figures for Hanoi were 88%
and 90%. All of these percentages were slightly higher than that ob-
tained in the Vietnam population census (84%). Employed respon-
dents constituted 45% and 39% in the two surveys in Ho Chi Minh
City, and 62% and 55% in Hanoi. Although there is a slight differ-
ence in ratio between the socio-demographic factors of the survey
sites and the Vietnam population census, the respondents of all the
surveys seem to represent the typical Vietnamese people.
3.2. Traffic volumes and noise exposure
Figs. 4 and 5 show the average number of flights in Ho Chi Minh
City and Hanoi. It should be noted that between 9 and 10 pm, more
landings than takeoffs were observed in both cities. The fluctuation
of traffic volumes at all sites for 24 h in both cities is shown in Figs.
6 and 7. There seemed to be considerable differences in traffic den-
sity among the surveyed sites in Ho Chi Minh City and Hanoi. The
largest traffic volume in Hanoi was over 3000 pass-bys per hour at
Site 8. This was not comparable to that observed at the reference
point of Site 2 in Ho Chi Minh City which was nearly 40,000
pass-bys per hour. Motorbikes formed the bulk of the traffic in
both cities, accounting for 92% of the total traffic in Ho Chi Minh
City and 72% in Hanoi.
Tables 4–7 show the noise metrics calculated for aircraft and
combined noise exposures at all the sites in both cities. The aircraft
noise exposure range in Ho Chi Minh City was wider than that in
Hanoi. Aircraft and combined noise exposures were from 53 to
71 dB and 73 to 83 dB L
den
in Ho Chi Minh City and from 48 to
61 dB and 70 to 82 dB L
den
in Hanoi, respectively.
The highest aircraft noise exposure level in Ho Chi Minh City
(L
den
= 71 dB) was found at Site 5, the closest site to the airport
under the landing path. Similarly, the highest level in Hanoi was
Table 1
Questionnaire items of the surveys.
Questions answered by respondents
Housing factors House type; length of residence; area of first floor; comments on quality of housing
Residential environment Climate in the area; quality of residential environment
Annoyance From traffic noise, from air pollution; from neighbour; frequency of annoyance; annoyance in specific time and season; annoyance due to
vibration caused by traffic
Interference on daily
activities
Listening, sleeping disturbance; disturbance while resting, talking, gardening
Sensitivities, attitudes,
etc.
Sleeping with open window in certain season; time of going to bed and getting up in weekend and weekday; sleeping condition; sensitivity
to weather and environmental factors; attitudes to the use of transportation vehicles; using frequency; comments on safety
Socio-demographic
variables
Occupation; length of period to stay at home; number of family members; age
Questions answered by interviewers according to the respondents’ facts
Gender of respondents
Structural details of the
house
main structure; number of glass layers, frame types of windows and doors of the living rooms and bedrooms; direction of facing or not
facing doors and windows
Table 2
Outline of social surveys on community response to aircraft noise in Ho Chi Minh City and Hanoi.
Street D Site 1 Site 2 Site 3 Site 4 Site 5 Site 6 Site 7 Site 8 Site 9 Site 10 Total
Ho Chi Minh City
Sample size
Single noise survey 85 86 90 90 90 83 90 88 89 89 880
Combined noise survey 90 66 88 89 90 85 87 87 682
Average response rate 87%
Hanoi
Sample size
Single noise survey 96 89 100 99 76 99 88 90 87 824
Combined noise survey 99 70 53 27 67 81 77 99 573
Average response rate 84%
Table 3
Some demographic factors of the surveys.
Items Ho Chi Minh City Hanoi
Aircraft
(%)
Combined
(%)
Aircraft
(%)
Combined
(%)
Demographics
of Vietnam
a
(%)
Gender
Male 47 46 46 51 49
Female 53 54 54 50 51
Age
20–39 55 63 47 47 84
40–59 34 29 41 43
Older than 60 11 8 12 10 16
Occupation
Employed 45 39 62 55 52
Students,
housewives,
retired, and
unemployed
55 61 38 45 48
a
General statistics office in Vietnam, ‘‘Statistical Date’’ />default_en.aspx?tabid=491.
T.L. Nguyen et al. /Applied Acoustics 72 (2011) 814–822
817
observed at Site 3 and Site 8 (L
den
= 61 dB), which were the closest
sites under the landing and takeoff paths of aircraft, respectively.
The lowest aircraft noise exposure (L
den
= 53 dB) in Ho Chi Minh
City was obtained at Site 2, the second-farthest site from under a
landing path, whereas that of Hanoi was at Site 5 (L
den
= 48 dB),
the site laying to the south of the runway.
Tables 6 and 7 show that the highest combined noise exposure
level was found at Site 2 in Ho Chi Minh City (L
den
= 83 dB) and Site
8 in Hanoi (L
den
= 82 dB). These sites were located along the na-
tional highways, which had much traffic volume with heavy vehi-
cles during the daytime. The lowest combined noise exposure level
was obtained at Site 3 in Ho Chi Minh City (L
den
= 73 dB) and at Site
1 in Hanoi (L
den
= 70 dB). They were along local roads serving sep-
arate residential areas.
3.3. Dose–response relationships
A logistic regression function was applied to plot the dose–re-
sponse curves for aircraft noise annoyance. This was evaluated
by the percentage of people highly annoyed by aircraft noise in
the single and combined noise surveys in Ho Chi Minh City and Ha-
noi; the day–evening–night average sound level (L
den
) was chosen
as the independent variable. Following the European Union (EU)
position paper [4], in which the cut-off point for the highly an-
noyed was defined as the top 28%, the authors defined the top
three categories of the 11-point numeric scale (top 27%) as highly
annoyed.
The dose–response curves for general annoyance in Ho Chi
Minh City and Hanoi were plotted based on the data from the sin-
gle and combined noise surveys and are shown in Figs. 8 and 9,
respectively. Hanoi’s curves are higher than Ho Chi Minh City’s in
both figures. In other words, respondents in Hanoi were more an-
noyed by aircraft noise than those in Ho Chi Minh City at the same
noise level. It is also worthy of note that except at Sites 3 and 4, the
percentage of highly annoyed among sites in Hanoi was shown to
be only slightly higher than that in Ho Chi Minh City. The sudden
increase of annoyance at Sites 3 and 4 contributed to extending
the gap between the curves of the two cities. The cause of the sharp
increase in annoyance at Sites 3 and 4 in Hanoi will be discussed in
the following section.
Effect Wald Tests were applied to obtain the probability of
obtaining a greater Chi Square (p) and also the R
2
to all the logistic
regression models drawn in Figs. 8 and 9. The results indicated that
L
den
of aircraft noise had a significant effect at p < 0.001 on the
annoyance in both single and combined noise areas.
Fig. 10 shows the relationships for general annoyance in Ho Chi
Minh City and Hanoi using synthesized data from all surveys and
compares it with the EU’s. The 95% confidence interval was calcu-
lated to estimate the distribution of highly annoyed respondents at
each site surveyed. The values of p shown in Table 8 were proved
for the significant effectiveness of the parameters of the model in
Fig. 10. At the same noise level, the percentage of highly annoyed
respondents in Vietnam was slightly higher than those in the EU.
In other words, there is 2–3 dB difference between the two curves
at the same percentage of high annoyance.
In addition to general annoyance, it is necessary to investigate
the activity disturbance as another descriptor of the effects of
Average number of flights
Time (h)
Fig. 4. Number of flights in Ho Chi Minh City.
0
2
4
6
8
10
12
14
0 3 6 9 12 15 18 21
Average number of flights
Time (h)
Takeoffs
Fig. 5. Number of flights in Hanoi.
0
10000
20000
30000
40000
1 3 5 7 9 11131517192123
Traffic volume
Time (h)
Site1
Site2
Site3
Site4
SIte5
Site6
Site7
Site8
Fig. 6. Traffic volume in Ho Chi Minh City.
0
10000
20000
30000
40000
1 3 5 7 9 11131517192123
Traffic volume
Time (h)
Site 1
Site 2
Site 4
Site 5
Site 8
Site 9
Fig. 7. Traffic volume in Hanoi.
818 T.L. Nguyen et al. /Applied Acoustics 72 (2011) 814–822
aircraft noise on humans. In this study, listening disturbance was
evaluated by a 5-point verbal scale, with the same modifiers as
the annoyance scale. The cut-off point for activity disturbance
was defined by the top two points. The logistic regression function
was also applied to plot the dose–response curves of percent lis-
tening disturbed with the daytime average sound level L
Aeq,-
day(07:00–22:00)
as the independent variable (Fig. 11). Consistent
with the analysis of general annoyance, Hanoi’s curves are higher
than Ho Chi Minh City’s with a sudden increase of percent
disturbed at Sites 3 and 4. In addition to the results of general
annoyance, this finding yields a question as to why the respon-
dents in Hanoi were more annoyed or disturbed than those in Ho
Chi Minh City at the same noise exposure.
3.4. Difference in response among sites
In this section, the possible causes of high annoyance
particularly at Sites 3 and 4 in Hanoi will be discussed through a
Table 4
Noise metrics calculated for aircraft noise exposure at all sites in Ho Chi Minh City.
Noise index (dB) Site 1 Site 2 Site 3 Site 4 Site 5 Site 6 Site 7 Site 8 Site 9 Site 10
L
Aeq,day (07:00–22:00)
55.7 50.8 49.9 53.3 66.8 60 60.7 57.6 57 55.1
L
Aeq,night (22:00–07:00)
51.5 44.7 48 49.2 61.7 55.8 57.7 54.8 54.2 52.6
L
Aeq,evening (19:00–22:00)
54.9 47.3 48.2 52.7 67.7 60.9 61.7 58.4 57.8 55.2
L
dn
58.9 52.8 54.8 56.7 69.5 63.2 64.8 61.8 61.2 59.5
L
den
59.3 53.2 55.1 57.2 70.6 64.2 65.6 62.3 61.7 60
L
Aeq,24h
54.2 49.4 49.4 52 65.8 59 59.8 56.8 56.2 54.4
L
95
43.7 49.1 46.5 41 42 44.6 46.3 43.9 49.5 42.1
L
1
74.0 71.9 69.8 69.7 78.5 73.8 76.2 74.4 71.8 75.3
Average annoyance 3.5 1.2 3.7 4.9 7.4 6.8 6.6 4.2 4.9 0.9
% Highly annoyed 5.2 0.0 6.7 8.9 52.2 48.8 34.4 10.7 3.4 1.2
Table 5
Noise metrics calculated for aircraft noise exposure at all sites in Hanoi.
Noise index (dB) Site 1 Site 2 Site 3 Site 4 Site 5 Site 6 Site 7 Site 8 Site 9
L
Aeq,day (07:00–22:00)
51 52 58.3 54.1 45.6 46.2 54.1 57 48
L
Aeq,night (22:00–07:00)
46.7 48.8 51.3 44.2 39.5 41.2 48.3 53.8 45.2
L
Aeq,evening (19:00–22:00)
52 51.7 59.3 53.9 44.2 44.1 53.5 55.3 45.1
L
dn
54 55.8 59.9 55.4 47.5 48.8 56.2 60.8 52.2
L
den
54.7 56.2 60.9 56.3 48 49.2 56.8 61.1 52.4
L
Aeq,24h
49.8 51 56.8 52.5 44.2 44.9 52.7 56.1 47.2
L
95
39.7 45.3 47.9 38.8 41.7 47.1 40.7 42.7 43.6
L
1
66.6 68.6 75.4 67.1 65.7 66.8 67.7 71.2 69.8
Average annoyance 3.3 3.5 7.6 7.9 4.2 3.7 3.8 5.3 4.1
% Highly annoyed 6.5 11.5 57.0 68.4 18.4 4.1 8.3 20.0 4.7
Table 6
Noise metrics calculated for combined noise exposure at all sites in Ho Chi Minh City.
Noise metrics (dB) Site 1 Site 2 Site 3 Site 4 Site 5 Site 6 Site 7 Site 8
L
Aeq,day (07:00–22:00)
72.5 77.6 70.8 72.1 76.4 75.8 75.4 72.6
L
Aeq,night (22:00–07:00)
67.5 75.5 64.9 66.2 73.7 70.5 69.5 70.5
L
Aeq,evening (19:00–22:00)
70.8 76.3 69.6 73 75.9 75 75.6 72.8
L
dn
75 82.2 72.8 74.1 80.6 78.2 77.4 77.3
L
den
75.5 82.5 73.4 74.9 81 78.7 78.1 77.7
L
Aeq,24h
71.2 76.9 69.4 70.7 75.6 74.5 74 71.9
L
95
41.4 64.7 43.5 49.1 56.9 53.4 45.7 53.8
L
1
81.5 85.8 78.5 79.9 83.9 84.6 83.2 80.0
Average annoyance 3.2 0.5 7.7 2.7 7.0 5.4 6.3 5.9
% Highly annoyed 4.7 0.0 50.0 0.0 34.5 25.3 26.4 25.9
Table 7
Noise metrics calculated for combined noise exposure at all sites in Hanoi.
Noise metrics (dB) Site 1 Site 2 Site 3 Site 4 Site 5 Site 7 Site 8 Site 9
L
Aeq,day (07:00–22:00)
68.2 73.5 73.6 70.3 72.4 72.5 79.4 66.9
L
Aeq,night (22:00–07:00)
61.2 71.8 71.8 65.3 67.1 67.1 72.5 62.8
L
Aeq, evening (19:00$22:00)
66.2 72.7 72.8 69.5 68.2 68.3 80.4 62.1
L
dn
69.6 78.5 78.5 72.8 74.8 74.8 80.9 70.1
L
den
70.1 78.8 78.8 73.3 75 75.1 81.8 70.3
L
Aeq,24h
66.6 73 73 69 71.1 71.1 77.9 65.8
L
95
36.1 47.6 47.6 45.9 41.4 41.4 51.4 42.3
L
1
76.3 82.9 82.9 80.2 80.4 80.4 86.5 76.4
Average annoyance 1.6 3.3 7.9 7.7 3.3 2.7 4.5 3.1
% Highly annoyed 4.0 10.1 73.1 61.5 7.5 2.6 33.3 3.2
T.L. Nguyen et al. /Applied Acoustics 72 (2011) 814–822
819
comparison with Sites 7 and 8, which have the equivalent noise
levels. Though respondents at Sites 3 and 8 were exposed to almost
the same aircraft noise levels, 60.9 and 61.1 dB, respectively, those
at Site 3 were found to be more highly annoyed by aircraft noise
than those at Site 8 as shown in Table 5 and Fig. 8. The same find-
ing was also gained between Site 4 (L
den
= 56.3 dB) and Site 7
(L
den
= 56.8 dB). These results suggest that annoyance is affected
not only by noise exposure levels but also by other factors.
It is noteworthy that Sites 3 and 4 and Sites 7 and 8 are, in pairs,
located under the landing and takeoff paths, respectively. In the
questionnaire survey, the respondents were asked to indicate
how frequently they were disturbed by the airborne vibration from
aircraft (Table 9). The results showed that, in the aircraft and com-
bined noise surveys, the residents at Sites 3 and 4 were more fre-
quently disturbed by the airborne vibration from aircrafts than
those at Sites 7 and 8.
In addition, the frequency of use of airplanes by the respon-
dents at each site was assessed. As can be seen in Table 10, the
percentages of respondents who did not use airplanes at all were
89% and 95% in the aircraft noise areas of Sites 3 and 4, while
these were only 50% and 57% at Sites 7 and 8, respectively. The
differences are slightly smaller when considering combined noise
areas at these sites. Since sleep disturbance is also a main effect
of noise on humans, the time at which respondents went to
bed was investigated (Table 11). The results indicated that, with
the exception of the aircraft noise area of Site 8, more respon-
dents at Sites 3 and 4 went to bed between 9 and 10 pm than
those at Sites 7 and 8. In addition, there are more landings than
takeoffs observed during this period of the night (Figs. 4 and 5).
These facts might cause higher sleep disturbances at Sites 3 and
4, which were under the landing path of the aircraft, than at Site
8 at the same noise level. All the above reasons could be used to
explain the higher annoyance found at Sites 3 and 4 than at the
other sites.
3.5. Difference in response between cities
The results of previous studies indicated that individuals tended
to judge the annoyance of an unwanted sound in terms of its rela-
tionship to background noise. The background noise level, in this
study, is defined as the 95th percentile (L
95
), as shown in Tables
4–7. It can be easily observed that the background noise levels at
almost all sites of Ho Chi Minh City are higher than at those of Ha-
noi. While the average L
95
values in Hanoi are 43 dB and 44 dB for
single and combined noise surveys, respectively, they are 45 and
51 dB in Ho Chi Minh City. The outstandingly larger traffic volume
in Ho Chi Minh City might yield the higher background noise level
0
20
40
60
80
100
40 50 60 70 80 90
% highly annoyed
Lden (dB)
Hanoi (Single noise survey)
HCM (Single noise survey)
Fig. 8. Dose–response relationships for general annoyance in single noise surveys.
Table 8
Estimated coefficients for the logistic equation of Fig. 10.
Parameter Estimate Std. error p Value
b
0
À7.741 0.532 <0.0001
b
1
0.107 0.009 <0.0001
b
0
: Intercept.
b
1
: Slope parameter of the logistic response function.
0
20
40
60
80
100
30 40 50 60 70 80
% Listening disturbed
LAeq,day 7:00-22:00 (dB)
Fig. 11. Dose–response relationships for listening disturbance using synthesized
data from single and combined noise surveys.
0
20
40
60
80
100
40 50 60 70 80 90
% highly annoyed
Lden (dB)
Hanoi (Combined noise survey)
Ho Chi Minh (Combined noise survey)
Fig. 9. Dose–response relationships for general annoyance in combined noise
surveys.
0
20
40
60
80
100
40 50 60 70 80 90
% highly annoyed
Lden (dB)
Fig. 10. The synthesized curve of Ho Chi Minh City 2008 and Hanoi 2009 surveys in
comparison with the EU’s curve.
820 T.L. Nguyen et al. /Applied Acoustics 72 (2011) 814–822
there. It can be speculated that the noise of aircraft events in Hanoi
when the background noise levels are lower might be generally
more noticeable than in Ho Chi Minh City.
Multiple logistic regression analysis was performed with high
annoyance as a dependent variable and independent variables
including L
den
, L
95
, and City factor (Hanoi: 0 and Ho Chi Minh: 1).
All L
den
, L
95
, and City factors were shown to be significantly effec-
tive for high annoyance. The results are shown in Table 12. Pear-
son’s correlation coefficients were calculated to measure the
relationship between aircraft annoyance and background noise
levels. In addition, L
den
and the 1st percentile (L
1
) were also in-
cluded in the analysis to compare the relationship between differ-
ent noise metrics and annoyance in Ho Chi Minh City and Hanoi.
L
den
represented the day–evening–night average aircraft noise,
while L
1
is used to give an indication of the upper limit of fluctuat-
ing aircraft noise. Bivariate correlations were calculated between
those noise metrics and each of three variables—individual annoy-
ance score, average annoyance score, and percent highly annoyed
(Table 13). The results showed that L
95
was statistically signifi-
cantly correlated at the 0.01 level with individual annoyance score
evaluated by the respondents of all surveys. No significant effects
were found between L
95
and average annoyance score and between
L
95
and percent highly annoyed.
It is worth noting that the coefficients between L
95
and annoy-
ance were negative for single noise surveys but positive for com-
bined noise surveys. These results indicate that at the areas
affected by a single aircraft noise the lower background noise level
yielded more annoyance. This finding is consistent with the results
of previous studies. However, the results for combined noise areas
showed that the annoyance becomes higher when the background
noise level increases. This finding emphasized the role of back-
ground noise level on the annoyance of respondents in Ho Chi
Minh City and Hanoi. The results drawn out from this study were
inconsistent with the main findings of Fields [15]. Fields’s study in-
cluded data from a total of 32 social surveys conducted in North
American and European countries. However, all the surveys were
conducted during the years from 1967 to 1990. According to the
‘‘ICAO Environmental Report 2007’’, aircraft noise has been re-
duced by 20 dB within the last 25 years. This means that the air-
craft noise nowadays has become much quieter than before and
can therefore be much more easily masked by background noise.
Moreover, the traffic situation in Vietnam was supposed to have
distinctive characteristics. Extremely high road traffic noise expo-
sure existed even in the vicinity of the airports. Furthermore, the
road traffic noise was contributed to by a huge amount of motor-
bikes but not cars or light trucks as in other countries. These indi-
cate different traffic situations in Vietnam compared with the
countries investigated in Fields’s study. Although Fields pointed
out that only 3 of 16 findings suggested an important reduction
of annoyance with the presence of high ambient noise levels, the
results found in this study fell into this exception. Research on a
similar topic in Korea by Lim et al. [16] also showed the same con-
clusion as ours [16].
Table 9
Chi-square test of frequencies of respondents almost every day and once or twice in a week disturbed by airborne vibration between sites under landing and takeoff routes.
Site 3 Site 8 Chi-square p Site 4 Site 7 Chi-square p
Single survey 55 45 1.9 >0.05 73 7 82.8 <0.001
Combined survey 64 43 5.4 <0.05 65 3 52.7 <0.001
Table 10
Chi-square test of frequencies of respondents who do not use airplanes at all between sites under landing and takeoff routes.
Site 3 Site 8 Chi-square p Site 4 Site 7 Chi-square p
Single survey 89 57 24.0 <0.001 95 50 44.6 <0.001
Combined survey 76 57 4.9 <0.05 77 55 3.9 <0.05
Table 11
Chi-square test of frequencies of respondents who go to bed up to 22:00 between sites under landing and takeoff routes.
Site 3 Site 8 Chi-square p Site 4 Site 7 Chi-square p
Single survey 34 33 0.0 >0.05 38 16 11.4 <0.001
Combined survey 21 15 1.9 >0.05 48 7 23.2 <0.001
Table 12
Results of multiple logistic regression analysis for high annoyance.
Estimate 95% Confidence interval p
L
den
0.148 0.128–0.168 0.000
L
95
À0.025 À0.042 to À0.007 0.006
City 0.436 0.326–0.546 0.000
Constant À8.991 À10.225 to À7.772 0.000
Dependent variable: HA(Dummy variable: 0–7:1, 8–10:0).
City: Hanoi(0), HCM(1).
Table 13
Pearson’s correlation.
Single noise surveys Combined noise surveys
Individual annoyance score
L
95
À0.088
**
0.165
**
L
den
0.348
**
0.245
**
L
1
0.190
**
0.215
**
Average annoyance score
L
95
À0.112 0.046
L
den
0.506
*
0.531
*
L
1
0.248 0.095
% Highly annoyed
L
95
À0.189 0.092
L
den
0.470
*
0.368
L
1
0.297 0.177
**
Significant at the 0.01 level.
*
Significant at the 0.05 level.
T.L. Nguyen et al. /Applied Acoustics 72 (2011) 814–822
821
4. Conclusions
This study provided a broader knowledge on exposure situa-
tions as well as annoyance of aircraft noise in Vietnam. Aircraft
and combined noise exposures ranged from 53 to 71 dB and 73
to 83 dB L
den
in Ho Chi Minh City and from 48 to 61 dB and 70 to
82 dB L
den
in Hanoi, respectively. The dose–response curve for air-
craft noise for Vietnam was established and fitted onto the curve
for the EU. It has been found that the curve for Vietnam was
2–3 dB lower than that for the EU at the same percentage of high
annoyance. The non-acoustic factors such as frequency of annoy-
ance during exposures to airborne vibration, frequency of use of
airplanes, and time to go to bed seemed to moderate the response
difference among sites. These factors yielded the highest annoy-
ance at the sites under the landing routes of aircraft. Finally, for
the same noise exposure, the aircraft annoyance in Hanoi was
higher than that in Ho Chi Minh City probably because of the lower
background noise level in Hanoi.
Acknowledgments
The authors appreciate the support of Ms. T.B.N. Nguyen from
Ho Chi Minh City University of Architecture for the social surveys
and noise measurements in Ho Chi Minh City and Professor D.N.
Pham and Dr. T.H. Nguyen from Hanoi University of Civil Engineer-
ing for their vital help in conducting the surveys in Hanoi. We also
appreciate the enthusiastic assistance of the students from both
universities, who supported interviews and noise measurements.
References
[1] European Communities. Position paper on dose–response relationships
between transportation noise and annoyance. EU’s future noise policy, WG-
Dose/Effect; 2002.
[2] European Parliament and Council. European noise directive 2002/49/EC of the
European parliament and of the council, 25 June 2002, relating to the
assessment and management of environmental noise, END; 2002.
[3] Report on meeting. WHO noise technical meeting on exposure–response
relationships of noise on health, Bonn, Germany; 2002.
[4] Boegli H, Balmer M, Schaffner MH. Risk assessment of noise exposure – the
Swiss perspective. In: Proceeding of Euronoise 2006, Finland; 2006.
[5] Miedema HME, Vos H. Exposure–response relationship for transportation
noise. J Acoust Soc Am 1998;104(6):3432–45.
[6] World Health Organization. Guidelines for community noise; 1999.
[7] Yano T, Sato T, Bjorkman M, Rylander R. Comparison of community response to
road traffic noise in Japan and Sweden. J Sound Vib 2002;250(1):161–7.
[8] Pedersen E et al. Response to noise from modern wind farms in The
Netherlands. J Acoust Soc Am 2009;126(2).
[9] Fields JM. Effect of personal and situational variables on noise annoyance in
residential areas. J Acoust Soc Am 1993;93(5).
[10] Finegold L, Schwela D. Would Western noise policies be effective in developing
countries? J Acoust Soc Am 2010;127(3):1842.
[11] Phan HYT, Yano T, Phan HAT, Nishimura T, Sato T, Hashimoto Y. Community
responses to road traffic noise in Hanoi and Ho Chi Minh City. Appl Acoust
2010;71:107–14.
[12] ACI World in co-operation with Momberger Airport information. Airport
development news; 2006.
[13] Vietnam Aviation Magazine (Ta˛p chí Hàng không). Is a new international
airport in Hai Duong Province possible?, October 2007 issue (a magazine
published by the Vietnam Aviation Authority).
[14] Yano T, Ma H. Standardized noise annoyance scales in Chinese, Korean and
Vietnamese. J Sound Vib 2004;277(3):583–8.
[15] Fields JM. Reaction to environmental noise in an ambient noise context in
residential areas. J Acoust Soc Am 1993;93(5).
[16] Lim C, Kim J, Hong J, Lee S. Effect of background noise levels on community
annoyance from aircraft noise. J Acoust Soc Am 2008;123(2):766–71.
Appendix A
A. Verbal annoyance question:
Thinking about the last 12 months or so, when you are here at home, how much are you bothered, disturbed, or annoyed by the follow-
ing factors?
123 45
Not at all Slightly Moderately Very Extremely
Aircraft noise () () () () ()
Road traffic noise () () () () ()
Combined noise of aircraft and road traffic () () () () ()
B. Numeric annoyance question:
Thinking about the last 12 months or so, what number from 0 to 10 best shows how much are you bothered, disturbed, or annoyed by
aircraft noise, road traffic noise, and combined noise of aircraft and road traffic?
(Aircraft noise)
0 12345678910
Not at all Extremely
(Road traffic noise)
0 12345678910
Not at all Extremely
(Combined noise of aircraft and road traffic)
0 12345678910
Not at all Extremely
822 T.L. Nguyen et al. /Applied Acoustics 72 (2011) 814–822