Báo cáo hóa học: " Single-trial classification of motor imagery differing in task complexity: a functional near-infrared spectroscopy study" ppt
Bạn đang xem bản rút gọn của tài liệu. Xem và tải ngay bản đầy đủ của tài liệu tại đây (1.28 MB, 13 trang )
RESEARC H Open Access
Single-trial classification of motor imagery differing
in task complexity: a functional near-infrared
spectroscopy study
Lisa Holper
1,2*
and Martin Wolf
1
Abstract
Background: For brain computer interfaces (BCIs), which may be valuab le in neurorehabilitation, brain signals
derived from mental activation can be monitored by non-invasive methods, such as functional near-infrared
spectroscopy (fNIRS). Single-trial classification is important for this purpose and this was the aim of the presented
study. In particular, we aimed to investigate a combined approach: 1) offline single-trial classification of brain
signals derived from a novel wireless fNIRS instrument; 2) to use motor imagery (MI) as mental task thereby
discriminating between MI signals in response to different tasks complexities, i.e. simple and complex MI tasks.
Methods: 12 subjects were asked to imagine either a simple finger-tapping task using their right thumb or a
complex sequential finger-tapping task using all fingers of their right hand. fNIRS was recorded over secondary
motor areas of the contralateral hemisphere. Using Fisher’ s linear discriminant analysis (FLDA) and cross validation,
we selected for each subject a best-performing feature combination consisting of 1) one out of three channel,
2) an analysis time interval ranging from 5-15 s after stimul ation onset and 3) up to four Δ[O
2
Hb] signal features
(Δ[O
2
Hb] mean signal amplitudes, variance, skewness and kurtosis).
Results: The results of our single-trial classification showed that using the simple combination set of channels,
time intervals and up to four Δ[O
2
Hb] signal features comprising Δ[O
2
Hb] mean signal amp litudes, variance,
skewness and kurtosis, it was possible to discriminate single-trials of MI tasks differing in complexity, i.e. simple
versus complex tasks (inter-task paired t-test p ≤ 0.001), over secondary motor areas with an average classification
accuracy of 81%.
Conclusions: Although the classification accuracies look promising they are nevertheless subject of considerable
subject-to-subject variability. In the discussion we address each of these aspects, their limitations for future
approaches in single-trial classification and their relevance for neurorehabilitation.
Keywords: wireless functional near-infrared spectroscopy (fNIRS), motor imagery, motor execution, single-trial clas-
sification, linear discriminant analysis, brain computer interface (BCI)
1 Introduction
Direct neural interfaces, i.e. brain computer interfaces
(BCIs), can provide users in neurorehabilita tion, such as
individuals with severe brain disorders, with basic com-
munication capabilities or the control over ext ernal
devices thr ough their mental processes alone, bypassing
the muscular system [1]. To develop a given method for
use in BCI systems, a reliable single-trial classification of
the brain signals derived from mental activation is
important for this purpose and this was the aim of the
presented study.
A relatively new method that has only recently
attracted researchers’ attention in the context of neural
interface development is functional near-infrared spec-
troscopy (fNIRS). fNIRS is a non-invasive technique
based on neurovascular coupling, which uses the tight
coupling between neuronal activity and localized
* Correspondence:
1
Biomedical Optics Research Laboratory (BORL), Division of Neonatology,
Department of Obstetrics and Gynecology, University Hospital Zurich,
Frauenklinikstrasse 10, 8091 Zurich, Switzerland
Full list of author information is available at the end of the article
Holper and Wolf Journal of NeuroEngineering and Rehabilitation 2011, 8:34
/>JNER
JOURNAL OF NEUROENGINEERING
AND REHABILITATION
© 2011 Holper and Wolf; licensee BioMed Central Ltd. This is an Open Access article di stributed under the terms of the Creative
Commons Attribution License (http://creative commons.org/licenses/b y/2.0), which permits unrestricted use, distribution, and
reproduction in any mediu m, provided the original work is properly c ited.
cerebral blood flow to monitor hemodynamic changes
associated with cortical activation [2]. Hence, in contrast
to traditional neural interfaces approaches based on
electroencephalography (EEG) that rely on electrical
brain signals, fNIRS relies on the measurement of the
task-induced hemodynamic changes in the cortex, simi-
lar to those signal obtain in functional magnetic reso-
nance imaging (fMRI). This study presents an attempt
of offline classification of single trials derived from a
novel developed wireless fNIRS instrument [3].
1.1 Single-trial classification of fNIRS data
Previous studies investigating single-trial classifications
of fNIRS hemodynamic data included different combina-
tions of mental tasks, signal features and classifiers.
Sitaram et al. [4] performed offline classification of hand
motor imagery (MI) using mean amplitude changes in
Δ[O
2
Hb] and Δ[HHb] as the class discriminatory fea-
tures; a maximum accuracy of 89% was achieved using a
hidden Markov model (HMM). Coyle et al. [5] per-
formed online classification by asking subjects to control
a binary switch by modulating changes in mean
Δ[O
2
Hb] over the motor cortex and achieved 50-85%
accuracy in online trials. Naito et al. [6] investigated
over the prefrontal cortex in locked-in patients who
were requested to perform different high-level mental
tasks corresponding to ‘yes’ and ‘no’ in response to a
series of questions. An average offline classification
accuracy of 80% was achieved in 40% of the locked-in
part icipa nts using maximum and mean Δ[O
2
Hb] as f ea-
tures and a non-linear discriminant classifier. Tai and
Chau [7] c lassified offline vis ually-cued positively and
negatively emotional induction tasks. Using mean
Δ[O
2
Hb] amplitude, variance, skewness and kurtosis as
features combined with linear discriminant analysis
(LDA) and support vector machine (SVM) classifiers the
authors a chieved accuracies upwards of 75.0%. Luu and
Chau [8] decoded neural correlates of decision making
by asking subjects to mentally evaluate two possible
drinks and decide which they preferred. Using mean
Δ[O
2
Hb] amplit ude as feature and Fisher’s linear discri-
minant analysis (FLDA), they achieved an average accu-
racy of 80%.
1.2 Motor imagery as mental task
In this study we aimed to focus on the offline classifica-
tion of single trials derived from kinaesthetic MI. MI is
described as the mental rehearsal of voluntary move-
ment [9]. According to the so-called simulation hypoth-
esis [10,11], MI activates a cortical network located in
primary motor co rtex (M1) and secondary motor areas,
such as premotor cortex (PMC), supplementary motor
area (SMA) and parietal cortices [12] which is thought
to overlap with those areas responsible for motor
execution (ME) of the same motor action [13,14].
Besides its relevance in BCI development, decoding MI
signals is particularly appealing from a neurorehabilita-
tion perspective. Due to its effect on brain activation MI
is thought to access the motor network independently
of motor recovery even in patients with impaired or
paralysed motor function. MI could therefore be inte-
grated into usual neurorehabilitative training [15] with
or without combination with neural interface applica-
tions [16,17].
Further, to use a certain MI task for such purposes, it
is of major advantage if the given method not only
detects related signal changes, but also that it differenti-
ates between different degrees of complexity of a given
task. In addition, for future BCI applications the poten-
tial signal parameters of those tasks that allow for differ-
ent iation between simple versus complex tasks are then
required to be classified on the single-trial level. In this
study, we therefore aimed to extend previous studies by
addressing this combined approach in evaluating the
classification of two MI tasks differing in complexity, i.e.
simple and complex finger-tapping tasks; these tasks
closely correspond to tasks used in various fMRI studi es
and those investigating patients in neurorehabilitation
[18-21]. To test this we made use of a novel wireless
fNIRS instrument t hat we h ave previously tested t o be
capable of detecting oxygenation changes in response to
MI [22,23].
Taken together, in the presented study, we aimed to
investigate a combined approach which has not been
addressed in this extent by previous studies using
fNIRS: 1) offline single-trial classification of brain signals
derived from a novel wireless fNIRS instrument using a
simple combination of features and Fisher’s linear discri-
minant analysis (FLDA ) as classi fier aimed to 2) discri-
minate between MI signals in response to different tasks
complexities, i.e. simple and complex MI tasks. This
paper aims to describe our findings and to discuss the
potential relevance and limitations of our observations
for future neurorehabilitative applications.
2 Materials and methods
2.1 Subjects
12 healthy subjects were included (6 males, mean age 29
years, range 26 - 33 years). Exclusion criteria were any
history of visual, neurological or psychiatric disorders or
any current medication. All subjects gave informed con-
sent. All subjects had normal or corrected-to-normal
vision. The study was approved by the et hics committee
of the Ca nton of Zurich and was in accordance with the
latest version of the Helsinki declaration.
All subjects were right-handed (mean Laterality Quoti-
ent (LQ) of 83, range 72 - 100; mean deciles level of 6.6,
range 4 - 10) according to the Edinburgh Handedness
Holper and Wolf Journal of NeuroEngineering and Rehabilitation 2011, 8:34
/>Page 2 of 13
Inventory (EHI) [24]. The self-administered Vividness of
Movement Imag ery Questionnaire (VMIQ) [25] revealed
an overall relative imagery ability of 82.43 ± 13.21 (range
73 - 107). Compared with the cut-off-point established
by Whetstone [26] that estimates imagery ability in rela-
tion to a total score of 75, eight of our subjects had a
comparatively good and four subjects a lower imagery
ability.
2.2 Experimental protocol
Each subject participated in one session. All experiments
were conducted in a quiet room. Subjects were asked to
sit in front of a LCD monitor (94 cm diagonal, 1366 ×
768 pixels) at a comfortable distance of approximately
60 cm from the eyes. A wireless numerical keyboard
(Logitech
®
Cordless Number Pad) was placed in front
the subjects.
2.2.1 Motor imagery (MI) tasks
The experiment consisted of the following two task con-
ditions:
• MI-simple: subjects were asked to imagine a simple
finger-tapping task by repetitively pressing button
‘zero’ (0) of a number keyboard using their thumb of
the right hand with a frequency o f approximately 3
Hz. The start of the trial was indicated by a visual
stimulus ‘GO - 0’ on the screen.
• MI-comple x: subjects were asked to imagine a com-
plex sequential fing er-tapping task by repetitively
pressing a predefined seq uence on the keyboard
using all fingers of their right hand with the same fre-
quency as in MI-simple. The sequence was presented
at the start of the trial on the screen: e.g. ‘GO - 2-2-5-
3-4’. The number stimuli symbolized the numbered
fingers of a hand, 1 = thumb, 2 = index finger, 3 =
middle finger, 4 = ring finger and 5 = little finger. For
example, the sequence 2-2-5-3-4 indicated the follow-
ing task: index finger twice, little finger once, middle
finger once, and ring finger once. Five sequences of
similar complexity were presented in a randomized
order each compr ising five tapping acts. This task is
sim ilar to that use d in various fMRI studies of stroke
and stroke recovery [18-21].
Prior to recording, subjects completed a practice trial
to familiarise with and properly understand the tasks. A n
example of the trial layout is shown in Figure 1: in total,
12 trials of each condition consisting of stimul ation
phases (15 s) were presented alternating with rest phases
(20 s); resulting in 24 trials per subject with a total dura-
tion of 14 min. During the rest phases a fixation cross
was presented and subjects were instructed to simply
watch the screen and remain motionless. All trials were
randomized between the two tasks and between the five
different task sequences. Subjects were reminded to per-
form the executed and imagined movements as precise
and as fast as possible. All finger-tapping tasks were self-
paced, however subjects were asked to perform finger-
tapping with freque ncies of approximately 2 Hz. Stimuli
were presented using white numbers on the screen gen-
erated by the software Presentation
®
(Neurobehavioral
systems, Albany, USA).
Subjects were asked to use kinesthe tic MI (i.e. indivi-
duals using imagery to imagine how movements feel,
supposedly associated with kinesthetic feeling) since
recent studies demonstrated that kinesthetic rather than
visual imagery (i.e. individuals imagine watching them-
selves performing a task) modulates cortico-motor excit-
ability [27,28].
2.2.2 Control motor execution (ME) measurements
After the experiment, subjects were asked to complete
two additional motor control measurements 1) to verify
the right positioning of the fNIRS instrument (see
details of positioning in the next section 2.3) and 2) to
support our hypothesis that the complex task was
indeed more difficult than the simple task. The control
ME measurements were conducted after the MI tasks
to avoid potential performance interference with a pre-
vious execution of the imagined movements. They con-
sisted of the same condit ions applied in the MI tasks
(Figure 1).
• ME-simple: same as MI-simple, but subjects were
asked to actually perform the simple task by pressing
button ‘zero’ (0) on the keyboard repetitively using
their thumb over the whole stimulation phase with a
frequency of approximately 3 Hz.
!"
!"
!#
!#
Figure 1 E xperimental design.Anexampleofthetriallayout
showing the stimulation periods (15 s) alternating with the rest
periods (20 s) during which subjects had to either execute or
imagine finger tapping on a keyboard. Start of the stimulation was
indicated by the word GO.
Holper and Wolf Journal of NeuroEngineering and Rehabilitation 2011, 8:34
/>Page 3 of 13
• ME-complex:sameasMI-simple,butsubjects
were asked to actually perform the complex task by
pressing five buttons on the keyboard using all fin-
gers in the same predefined sequences and frequency
as presented in MI-complex.
Timing and procedures were identical to the MI con-
ditions. All tasks were carried out using the wireless
numerical keyboard (Logitec h
®
Cordless Number Pad)
which allowed recording of all keystrokes of all five fin-
gers; data were transferred to PC via USB and stored for
further analysis.
2.3 fNIRS measurements
fNIRS is a non-invasive technique based on neurovascu-
lar coupling, which exploits the effect of metabolic activ-
ity due to neural processing on the oxygenation of
cerebral tissue. Utilizing this tight coupling bet ween
neuronal activity and localized cerebral blood flow,
fNIRS measures hemodynami c changes a ssociated with
cortical activation, i.e. typically an increase in oxy-hemo-
globin concentration Δ[O
2
Hb] and a decrease in deoxy-
hemoglobin concentration Δ[HHb] [2]. The Δ[O
2
Hb]
change usually has considerably higher amplitude than
the Δ[HHb]changeandalsoahighercontrasttonoise
ratio. The reason is that while an incre ased O
2
-con-
sumption reduces Δ[O
2
Hb], b oth the concurrent
increased cerebral blood flow and volume lead to an
increase in Δ[O
2
Hb]. For Δ[HHb] the increase in blood
flow and volume lead to opposite effects and thus, the
total change in Δ[HHb] has a smaller amplitude [29].
fNIRS was recorded using a novel miniaturized fNIRS
sensor previously described in detail [3]. This wireless
and portable fNIRS sensor does not require the subject’s
bod y or head to be restrained, and therefore can be used
as a brain monitoring tool in everyday environm ents.
The sensor components are mounted onto a four-layer
rigid-flexible printed circuit board (PCB) which, in com-
binationwithahighlyflexiblecasingmadeofmedical
grade silicone, enables the sensor to be aligned to curved
bodysurfacessuchasthehead.Thesizeofthedeviceis
92 × 40 × 22 mm and weighs 40 g. The optical system
comprises four light sourc es at two different waveleng ths
(760 nm and 870 nm) and four detectors (PIN silicon
photodiodes) with a source-detector distance of 12. 5 mm
(Figure 2). The power is provided by a rechargeable bat-
tery, which allows a continuous data acquisition for 180
minutes at full light emission power. The light intensity
is sampled at 100 Hz and the resulting data are trans-
mitted wirelessly to the host computer by Bluetooth. The
operating range of the sensor is about 5 m.
For fNIRS recording, one sensor was placed over the
subject’s left hemisphere over F3 according to the inter-
national 10-20 system [30]. With the comp act sensor of
37.5 mm length and 25 mm width, we assumed to cover
secondary motor areas, presumably including PMC and
SMA. Cortical activation in these areas has been pre-
viously described during MI performance [31,32]. The
sensor was fixed on the subject’s head using self-adhe-
sive bandages (Derma Plast CoFix 40 mm, IVF Hart-
mann, Neuhausen, Switzerland).
2.4 EMG measurements
Surface electromyogram (EMG) was monitored bilater-
ally in combination with fNIRS in all subjects to confirm
the absence of muscle activity during the MI tasks.
EMG was obtai ned using a customisable asymmetrical
dual channel digital EMG unit (NeuroTrac™ ETS, Ver-
ity M edical Ltd., Romsey, H ampshire, United Kingdom)
that detects e lectrical activity from 0.2 μV up to 200 0
μV. One pair o f electrodes was plac ed over musculus
extensor digitorum muscles to measure (1) the activity
during the MI tasks, (2) the level of muscle activity dur-
ing the rest phases and (3) the timing and frequency of
the finger-tapping during the ME control measurements.
After each session, EMG data were graphically displayed
and visually reviewed for task-unrelate d movements
using the automated EMG software application (Verity
Medical Ltd., Neur oTrac™EMG Sof tware). In all
recorded subjects, EMG graphics showed that subjects
performed the right hand button presses during the ME
control measurements with a suit able timing and fre-
quency; activity was lower during the rest phase com-
pared to the active stimulation phas es; there was no
activity recorded in the left (unused) hand during both
ME controls (< 20 μV). During the MI tasks, EMG of
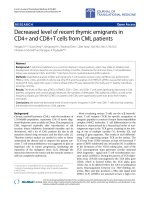
Figure 2 Wireless fNIRS sens or. a) Top- view: schematic of light
sources (L1, L2, L3, and L4) and detectors (D1, D2, D3, and D4) on
the sensor. b) Wireless fNIRS sensor with casing; (red) light sources,
(blue) detectors, (1) analog and wireless communications and
power-supply electronics, (2) optical probe [3]. The centre of the
sensor was positioned presumably covering position F3 according
to the 10-20 system [30]. Three channels were considered for
analysis. D1-L1 was positioned in cranial direction, D4-L4 in caudal
direction.
Holper and Wolf Journal of NeuroEngineering and Rehabilitation 2011, 8:34
/>Page 4 of 13
both forearms showed a constant electrical activity
below < 20 μV. In two subjects the electrical activity of
the right forearm seemed to be higher and more vari-
able in the MI-complex task than in MI-simple, but still
<20μV.
3 Data analysis
3.1 Data pre-processing
By measuring intensity of NIR light after its transmission
through tissue, it is possible to determine oxygenation
changes over time of oxy-hemoglobin (O
2
Hb) and deoxy-
hemoglobin (HHb), which represent the dominant light
absorbers for living tissue in the NIR spectral band. By
applying the modified Beer-Lambert law (MBLL), the con-
centration for O
2
Hb and HHb ( [O
2
Hb], [HHb]) were
computed from the measured absorption changes [33,34].
AprogramforMATLAB
®
(Version 2008a) was writ-
ten and applied to pre-process the raw light intensity
values and t o compute [O
2
Hb] and [HHb] changes. The
measurement files that were acquired during the fNIRS
experiment containing the intensity signals of the NIR
light, sampled at 100 Hz for all combinations of light-
sources, wavelengths and detectors, as well as the inten-
sity of the ambient light. The program subtracts the
ambient light intensities from the fNIRS measurement
values before low-pass filtering (7th order Chebyshew
with 20 dB attenuation at 5 Hz) and decimates the sig-
nals to a sampling rate of 10 Hz. Consecutively, the
MBLL is used to compute the changes of [O
2
Hb] and
[HHb] applying differential path lengths factors (DPF) of
6.75 for the 760 nm and 6.50 f or the 870 nm light-
sources [35]. The linear signal drift is then subtracted
from the resulting [O
2
Hb] and [HHb] signals.
Source-detector combinations (channels) that did not
show significant oxygenation changes in individual sub-
jects were excluded from further analysis, since it was
assumed that those channels did not cover the activat ed
cerebral region at all. For this reason the fourth channel
was excluded from analysis as its more lateral location
was prone to high artifacts and had a very low signal to
noise ratio. Further, subjects that did not show signifi-
cant oxygenation changes ( p > 0.05) in all channels in
the ME control measur ements and the MI tasks were
excluded from analysis.
Consecutively, dependent variables for further statisti-
cal analysis were derived from the non-excluded [O
2
Hb]
and [HHb] datasets. Specifically, the mean of the stimula-
tion phases ([HHb]
stim
,[O
2
Hb]
stim
,) and the mean of the
rest phases ([HHb]
rest
,[O
2
Hb]
rest
, baselines) were consid-
ered, calculated for each trial and channel per subject.
The statistical significance of the intra-condition differ-
ences between ([HHb]
rest
,[O
2
Hb]
rest
)and([HHb]
stim
,
[O
2
Hb]
stim
), later referred to as Δ[HHb] and Δ[O
2
Hb],
was analyzed over channels 1-3 for each condition, each
subject in the control ME tasks and the MI conditions
using the paired t-test (CI 95%, alpha level p ≤ 0.005,
power p = 0.764). The signal-to-noise ratio (SNR, defined
as the ratio of the mean signal to its standard deviation)
was calculated to evaluate the signal strength within each
channel.
3.2 Single-trial classification of MI signals
Single- trial classification was perfo rmed of the hemody-
namic signals obtained after processing using SPSS
(Version 16.0). Previous studies have either classified
light intensity directly [6] or converted the signals to
haemoglobin concentrations [4] prior to classification.
Sinceithasnotbeenshownthatonemethodismore
discriminating than the other, we classified the pro-
cessed optical signals.
The goal of the classification was to discriminate the two
MI tasks based on single-trial signals. In particular, we
aimed to classify Δ[O
2
Hb] signals derived from the differ-
ence between the baselines phases (20 s) and the stimula-
tion phases (15 s) of each single-tri al into one of the two
tasks (MI- simp le or MI-co mplex). The classification was
based on the definition of a best-performing combination
for each subject consisting of: 1) a specific channel, 2) a
specific analysis time interval within the stimulation phase
and 3) a set of up to four signal features.
1. Channels: each of the channels 1-3 w ere tested
separately for each subject and the best-performing
channel was selected.
2. Analysis time intervals: each time interval within the
stimulation phase (0-15 s in Figure 1) was defined by a
start time and an end time. Start times ranged from 1 - 11
s in 1 s increments, while end times spanned from 5 - 15
s, also in 1 s increments. All possible combinations of start
and end times were considered as valid time intervals for
classification. These start and end times were considered
according to the typical time course of the hemodynamic
response delay after stimulation onset [36,37].
3. Features: the following four features were selected
fromthosepreviouslypublishedandtestedby[7].All
features were calculated for each subject (N = 12 sub-
jects) and each trial (N = 12 trials):
○ Mean: average signal amplitude.
○ Variance: measure of signal spread.
○ Skewness: measure of the asymmetry of signal values
around its mean relative to a normal distribution.
○ Kurtosis: measure of the degree of peakedness of a
distribution of signal values relative to a normal
distribution.
Using Fisher’s linear discriminant analysis (FLDA) all
possible classification combinations were tested for each
subject. Classification accuracy was evaluated using
Holper and Wolf Journal of NeuroEngineering and Rehabilitation 2011, 8:34
/>Page 5 of 13
cross validation. Due to the relatively smal l size of the
feature space, an exhaustive search was performed for
each subject, and the best-performing combination was
reported.
Two-tailed Pearson’s correlation coefficients (r)with
p-value (significance level p ≤ 0.05) were calculated to
evaluate correlations between the mean values of the
four features and the classification accuracy within the
selected subjects.
4 Results
4.1 Control ME measurements
We first analysed the control ME measu rem ents to con-
firm our assumption that we were indeed recording from
motor-related cortical areas, i.e. presumably secondary
motor areas relevant for MI performance. Two subjects
were excluded at this stage as their data did not show sig-
nificant Δ[O
2
Hb] increases. In all remaining subjects (N =
12), the control ME measurements elicited significant
intra-control differences between baselines and stimula-
tion phases. On the overall-subject-level significant larger
averaged amplitudes were observed during ME-complex
(Δ[O
2
Hb] 0.453 ± 0.098 μmol/l; Δ[HHb] -0.06 75 ± 0.021
μmol/l) as compared to ME-simple (Δ[O
2
Hb] 0.189 ±
0.055 μmol/l; Δ[HHb] -0.032 ± 0.078 μmol/l) (inter-task
paired t-test overall channels: Δ[O
2
Hb] p =0.001,Δ[HHb]
p =0.012).
The keystroke data were used to confirm our hypothesis
that the complex task was indeed more difficul t than the
simple task. The errors of the individual button presses
were defined as any finger taps occurring outside the one
of the prescribed sequences and the error rate was defined
as the (total number of errors)/(total number of finger
taps). Results revealed a lower number of total taps and a
larger error rate in ME-complex (mean total taps 706 ±
254, mean error rate 0.09 ± 0.03) as compared to MI-sim-
ple (mea n total taps 912 ± 165, mean error rate < 0.001)
(p = 0.023). This finding confirmed our hypothesis and we
assumed that if performanc e of ME-complex was proven
as overall more difficult than ME-simple, the same could
be expected for t he mental effort required in the corre-
sponding MI tasks. Based on this estimated discrimination
between simple and complex imagined movements, we
expected a facilitation of the following classification.
4.2 MI tasks
On the overall-subject-level, we first plotted the oxyge-
nation patterns of Δ[O
2
Hb] and Δ[HHb]averagedover
all subjects and all trials for each of the channels 1-3.
As observed in the control measurements, the same
characteristic patterns w as found between the two MI
tasks reflecting the effect of ta sk complexity (Figure 3,
Table 1, top): MI-complex (Δ[O
2
Hb] 0.118 ± 0.011
μmol/l; Δ[HHb] -0.009 ± 0.003 μmol/l) revealed larger
oxygenation responses as compared to MI-simple (Δ
[O
2
Hb] 0.064 ± 0.012 μmol/l; Δ[HHb] -0.014 ± 0.003
μmol/l) (inter-task paired t-test overall c hannels: Δ
[O
2
Hb] p = 0.001, Δ[HHb] p =0.029).Thiswasconsis-
tent over all channels reaching significance in channel 1
(Δ[O
2
Hb] p ≤ 0.001) and 2 (Δ[O
2
Hb] p =0.018).In
both conditions, channel 1 revealed the largest Δ[O
2
Hb]
changes, followed by channel 2 and 3. We suggested
that this distribution might be an indicator for the
underlying topography, i.e. the cortical regions activated
within secondary motor areas: stronger oxygenation
changes in the medial (channel 1 and 2) as compared to
the more lateral parts (channel 3).
On the single-subject-level, similar patterns were
observed within each subject: all subjects showed a sig-
nificant effect of task complexity with larger Δ[O
2
Hb]
changes in MI-co mplex as compared to MI-simple
(measured overall channels, while in some subjects sin-
gle channels did not show significant changes, see Table
1, bottom); and, in nine subjects (75%) larger Δ[O
2
Hb]
changes were found in channel 1 as compared to 2 and
3. Taken together, these findings showed that the indivi-
dual data contained significant task-related Δ[O
2
Hb]
changes within each task and that the simple and com-
plex task could be discriminated.
4.3 Classification of MI signals
Using FLDA we classified the MI signals by selecting the
best-performing combination based on one channel, a
MI-sim
p
le MI-com
p
lex
Channel 1
Channel 2
Channel 3
p 0.001*
p = 0.018*
ǻ[
O
2
Hb]
S
NR
0.00
1.00
2.00
1.551.231.040.99 0.54 1.08
0.10
0.05
0.00
0.15
0.20
ǻ[HHb] ǻ[O
2
Hb] (mean ± SE μmol/l)
Figure 3 Mean Δ [O
2
Hb] and Δ[HHb] profile. Mean Δ[O
2
Hb] and Δ
[HHb] (mean ± SE μmol/l) on the overall-subject-level averaged over
12 trials for each channel separately (channel 1 [black], channel 2
[dark gray], channel 3 [light gray]), of the contralateral (right)
hemispheres during performance of MI-simple and MI-complex.
Shown are also relevant significances of paired t-test (CI 95%, p-
values) of Δ[O
2
Hb] between the two tasks. The second y-axis (green)
represents the Δ[O
2
Hb] signal-to-noise ratio (SNR, defined as the
ratio of the mean signal to its standard deviation) for each channel;
the values of each SNR are shown below.
Holper and Wolf Journal of NeuroEngineering and Rehabilitation 2011, 8:34
/>Page 6 of 13
certain time interval and up to four of the features (Δ
[O
2
Hb] mean amplitude, variance skewness, kurtosis)
for each subject. We concentrated on the Δ [O
2
Hb] sig-
nal only, since classification of Δ[HHb] signals did not
reveal comparable accuracies. The accuracy of the classi-
fication averaged on the overall-subject-level was 81.3 ±
7.0% (range 70.8% - 91.7%) (Table 2). However, consid-
erably subject-to-subject variability was observed in the
classification combinations as documented by the fol-
lowing results:
Most frequently selected was channel 3 which might
indicate that the data derived from the more medial posi-
tioned part of the sensor (channel 1 and 2) were less sui-
table for discrimination the MI signals investigated in
this study. From the analysis on the overall-subject-level
we knew that channel 3 elicited smaller overall oxygen a-
tion changes as compared to channel 1 and 2. To test
why the signal amplitudes in the different channels
obviously influenced the classification selection, we cal-
culated the signal-to-noise ratio (SNR, defined as the
ratio of the mean signal to its standard deviation) within
each channel (Table 1, top, Figure 3). The results showed
that the signals derived from channel 3 had a proportion-
ally larger SNR as compared to c hannel 1 and 2 in both
condition MI-simple (channel 1 = 0.99; channel 2 = 0.54;
channel 3 = 1.08) and MI-complex (channel 1 = 1.04;
channel 2 = 1.23; channel 3 = 1.55).
Further, the response latency in the trial-averaged
hemodynamic signals varied among subjects between
the 5
th
to the 15
th
second of the stimulation phase;
accordingly, the best-performing time intervals selected
for classification differed between subjects. Figure 4
summarizes the optimal an alysis interval lengths across
subjects. The figure showed an overall tendency that the
longer the time intervals available for classification ana-
lysis t he higher the classification accuracy ranged. Each
horizontal bar represents the analysis interval range for
which significant activation was detected for a partici-
pant. To illustrate examples of the analysis time inter-
vals within a specific channel, the oxygenation responses
of two sample subjects (subject 1 and 2) were plotted
(Figure 5); shown are examples of channels 2 and 3
Table 1 Mean Δ[O
2
Hb] and Δ[HHb] profiles
Mean Δ[O
2
Hb] Δ[HHb] Overall-subjects Channel 1 Channel 2 Channel 3 Overall channels
MI-simple
Δ[O
2
Hb] μmol/l 0.101 ± 0.013 0.054 ± 0.014 0.038 ± 0.011 0.064 ± 0.012
Δ[HHb] μmol/l -0.017 ± 0.002 -0.0130 ± 0.003 -0.011 ± 0.003 -0.014 ± 0.003
Δ[O
2
Hb] SNR 0.99 0.54 1.08 0.87
MI-complex
Δ[O
2
Hb] μmol/l 0.192 ± 0.012 0.095 ± 0.012 0.065 ± 0.010 0.118 ± 0.011
Δ[HHb] μmol/l -0.008 ± 0.006 -0.010 ± 0.003 -0.007 ± 0.003 -0.009 ± 0.003
Δ[O
2
Hb] SNR 1.04 1.23 1.55 1.27
Inter-task paired t-test [simple vs complex] Channel 1 Channel 2 Channel 3 Overall channels
Δ[O
2
Hb]
(p-values)
Δ[O
2
Hb]
(p-values)
Δ[O
2
Hb]
(p-values)
Δ[O
2
Hb]
(p-values)
Overall-subjects ≤ 0.001* 0.018* 0.064 ≤ 0.001*
Subject 1 ≤ 0.001* ≤ 0.001* ≤ 0.001* ≤ 0.001*
Subject 2 0.341 ≤ 0.001* ≤ 0.001* ≤ 0.001*
Subject 3 1.000 0.003* ≤ 0.001* 0.032*
Subject 4 1.000 ≤ 0.001* ≤ 0.001* ≤ 0.001*
Subject 5 ≤ 0.001* ≤ 0.001* ≤ 0.001* ≤ 0.001*
Subject 6 0.105 0.007* 0.002* 0.046*
Subject 7 ≤ 0.001* 0.023* ≤ 0.001* ≤ 0.001*
Subject 8 0.086 ≤ 0.001* 0.004* 0.002*
Subject 9 ≤ 0.001* ≤ 0.001* ≤ 0.001* ≤ 0.001*
Subject 10 0.976 ≤ 0.001* ≤ 0.001* ≤ 0.001*
Subject 11 0.181 ≤ 0.001* ≤ 0.001* ≤ 0.001*
Subject 12 0.324 0.026* ≤ 0.001* 0.039*
(Top) Mean Δ[O
2
Hb] and Δ[HHb] (mean ± SE μmol/l) and Δ[O
2
Hb] signal-to-noise ratio (SNR, defined as the ratio of the mean signal to its standard deviation) on
the overall-subject-level averaged over channels 1-3 and for each channel separately, of the contralateral (right) hemispheres during performance of MI-simple
and MI-complex (Bottom) Inter-task paired t-test (CI 95%, p-values) for each subject of Δ[O
2
Hb] between the two tasks, MI-simple and ME-complex.
Significant values are highlighted with (*).
Holper and Wolf Journal of NeuroEngineering and Rehabilitation 2011, 8:34
/>Page 7 of 13
during both conditions MI-simple and MI-complex. The
regions highlighted with a box correspond to the time
intervals selected for the classificati on as specified in
Table 2. Last, also the f our features selected differed
between subjects. The most commonly used feature was
Δ[O
2
Hb] variance (N = 10 (83%)), followed by mean
amplitude (N = 8 (66%)), skewness (N = 6 (12%)) and
kurtosis (N = 5 (41%)).
To determine potential relations between the signal
features and the resulting classification accuracy, corre-
lations were calculated between the mean value of the
Table 2 Classification accuracy for each subject
Best-performing combination
Subject No. Channel Time interval Optimal feature set Classification accuracy
1 3 9-15 s Δ[O
2
Hb] mean, variance, skewness, kurtosis 91.7%
2 2 5-15 s Δ[O
2
Hb] mean, variance 79.2%
3 3 9-15 s Δ[O
2
Hb] variance, skewness, kurtosis 79.2%
4 2 8-14 s Δ[O
2
Hb] mean, variance 75.0%
5 3 9-15 s Δ[O
2
Hb] mean 75.0%
6 3 7-15 s Δ[O
2
Hb] mean, variance, skewness 91.7%
7 1 8-14 s Δ[O
2
Hb] skewness 70.8%
8 2 7-12 s Δ[O
2
Hb] mean, variance 75.0%
9 1 5-15 s Δ[O
2
Hb] mean, variance 83.3%
10 3 5-15 s Δ[O
2
Hb]variance, skewness, kurtosis 87.5%
11 3 7-15 s Δ[O
2
Hb]variance, kurtosis 87.5%
12 2 11-15 s Δ[O
2
Hb] mean, variance, skewness, kurtosis 79.2%
Overall 81.3 ± 7.0%
The results are shown for the best-performing combination of one channel, a certain time interval and the optimal feature set for each subject. Classification
accuracy was identified over 12 randomised trials by cross validation. Four features were used: mean Δ[O
2
Hb] amplitude, variance, skewness and kurtosis
Figure 4 Analysis time intervals. Results of the analysis time
intervals across subjects ranked by classification accuracy (%).
Shown are the ranges of individual analysis intervals used for
classification.
Figure 5 Sample subjects Δ[O
2
Hb] and Δ[HHb] profile. Averaged
Δ[O
2
Hb] (red) and Δ[HHb] (blue) responses in two sample subjects
(subject 1 and 2) corresponding to the classification defined in
Table 2. After the rest period (20 s) the on- and offset of the
stimulation period (15 s) are indicated by dashed lines from time =
0 - 15 s. The regions highlighted with a box correspond to the time
intervals selected for the classification as specified in Table 2.
Holper and Wolf Journal of NeuroEngineering and Rehabilitation 2011, 8:34
/>Page 8 of 13
four features and the classification accuracy. As shown
in Figure 6, significant correlations were observed in
both conditions MI-simple and MI-complex: Δ[O
2
Hb]
variance was negatively correlated with classification
accuracy in both conditions (MI-simple: r = -0.688* , p =
0.028; MI-complex: r = -0.701*, p = 0.024) and Δ[O
2
Hb]
skewness was negatively correlated with classification
accuracy in MI-simple (r = -0.850*, p = 0.032) and posi-
tively correlated in MI-complex (r = 0.854*, p = 0.031).
5 Discussion
We present results of single-trial classification of MI sig-
nals using a novel wireless fNIRS instrumen t. Our find-
ings show, that using a simple feature comb ination
selected by linear discriminant analysis, it is possible to
discriminate between single-trials in response to MI
tasks differing in tasks complexity, i.e. simple versus
complex tasks. Our results revealed an average accuracy
of 81% that was achieved by selecting for each subject a
best-performing combination consisting of one channel,
a certain time interval and up to four Δ[O
2
Hb] signal
features. In the following discussion we address each of
these aspects, their limitations for future single-trial
classification approaches and their relevance for
neurorehabilitation.
5.1 Channels selected for classification
As shown in Table 2, the signal locations, i.e. channels
selected for optimal classification, differed across sub-
jects. As a result of this subject-to-subject variability,
classification in our study required the individual selec-
tion of a suitable channel in which an appropriate time
interval with significant oxygenation changes was
detected in both task conditions MI-simple and MI-
complex. This is in line with previous studies which
selected channels and/or time intervals for individual
subjects [7,8].
In this study, the channel most frequently selected for
classification was channel 3 (N = 6 (50%)), followed by
channel 2 (N = 4 (33%)) and 1 (N = 2 (16%)). As illu-
strated in Figure 2, channel 3 was positioned more lateral
over the left hemisphere as compared to channel 1 and 2.
This might indicat e that either the signals obtained from
the very lateral positioned part of the sensor, i.e. channel
3, or the cortical areas cover ed by that part of the sensor
were better suitable for discrimination of the presented
MI tasks. Using an approximated topographical assump-
tion we suggested that while the medial part of the sensor
was detecting signal derived from SMA, the more lateral
part was detecting signal located in areas of PMC. Hence,
the signals originat ing from PMC might have been
favoured for greater classification accuracy in the given
MI tasks in our study. This might have been unexpected
considering that channel 3 elicited the smallest oxygena-
tion changes over all subjects both in response to
MI-simple and MI-complex (Figure 3). However, the pro-
portionally larger SNR associated with that smaller signal
in channel 3 (Table 1) might have allowed for better clas-
sification results. Hence, part of the subject-to-subject
variability in signal location might be explained by these
observations, i.e. indicating that the more lateral the posi-
tion of a specific sensor channel and the smaller the sig-
nal was - accompanied with a good SNR -, the higher the
resulting classification accuracy.
Furtherreasonsforthissubject-to-subject variability
in signal location might be explained by methodological
aspects of f NIRS which can be related to sensor posi-
tioning. Although, external landmarks can be used for
sensor positioning using the international 10-20 system
[38,39], these landmarks offer only probabilistic guide-
lines for individual differences in location. Hence, as
with several other non-invasive brain imaging methods
(e.g., EEG) anatomical information and variability
between individuals are not directly obtained, making
the localization of externally recorded signals difficult
with respect to the underlying brain. These and the lim-
itation of the usually restricted NIRS sample volume
[39] in our study may have lead to differences in exact
location of the interro gated tissue from subject to sub-
ject. Therefore, by using F3 as landmark, we could only
Figure 6 Correlations between classification accuracy and
feature value. Scatter plots illustrating the correlations between the
classification accuracies (%) and the averaged feature values over all
trials for each subject (each dot represents one subject, only those
subjects are shown for whom the feature was selected for
classification). Separate plots are shown for the significant findings
in two of the four feature: (Left) Δ[O
2
Hb] variance was negatively
correlated with classification accuracy in both conditions (MI-simple:
r = -0.688*, p = 0.028; MI-complex: r = -0.701*, p = 0.024); (Right)
Δ[O
2
Hb] skewness was negatively correlated with classification
accuracy in MI-simple (r = -0.850*, p = 0.032) and positively
correlated in MI-complex (r = 0.854*, p = 0.031).
Holper and Wolf Journal of NeuroEngineering and Rehabilitation 2011, 8:34
/>Page 9 of 13
assume to cover secondary motor areas such as SMA or
PMC in the individual subjects.
5.2 Analysis time intervals selected for classification
Similar t o the signal location, the individual t ime inter-
vals after onset of the st imulation phase that yielded the
best classification accuracy differed between subjects
from five to eleven seconds (Table 2, Figure 5). Conse-
quently, the analysis time intervals required for the best
classification accuracy varied between subj ects within a
range from four to ten seconds. This time frame is com-
parable to tho se reported by Sitaram et al. [4] who
required ten seconds of stimulation data in response to
MI of finger-tapping and by Tai et al. [7] who choose
intervals between four and 19 seconds during positively
and negatively-emotional induction tasks. However, it
needs to be taken into account that these time intervals
were obtained with offline classification, while online
classification has been shown to require at least 15 sec-
onds of MI performance [5]. We suggest that the sub-
ject-to-subject variations in t he selected time intervals
are most likely due to individual latency differences in
the delay of the Δ[O
2
Hb] response after onset o f the
imagination t ask. Part of these subject-to-subje ct varia-
tions might be explained by differences in the cognitive
processes underlying MI performance in our experimen-
tal tasks. Although, subjects were explicitly instructed to
perform kinesthetic MI, i.e. using imagery to imagine
how movements feel, instead of visual imagery, i.e. ima-
gine watching oneself performing a task, or any other
form of imagination, we can not provide a measure for
the individual strategies used. Another explanation
might be the training status of our subjects. Although
the a nswers of the VMIQ reveal ed relatively good ima-
gery ability among subjects, none of them were explicitly
trained in the use of MI. Hence, it might be suggested
that subject-to-subject variability may have been lower if
recorded in experienced or trained subjects.
5.3 Δ[O
2
Hb] signal features selected for classification
Previous studies investigating fNIRS single-trial classifica-
tion reported the use of different signal features and
diverse numbers of trials collected per subject. The major-
ity of studies used mean Δ[O
2
Hb] and/or Δ[HHb] ampli-
tude changes in the hemodynamic response and collected
from ten trials per subject during MI [5] to 60 trials per
subject during emotional induction [7]. The feature set
used in our study - Δ[O
2
Hb] mean amplitude, variance,
skewness and kurtosis - was chosen from the selection
reported by Tai et al. [7] who found classification accura-
cies between 75% and 94.67% using these features. We
hypothesized that using these additional four features,
instead of only the mean amplitude, would enhance poten-
tial classifi cation accuracies. This was confirmed in some
of our subjects which required up to four of the features
to reach higher classification accuracies as compared to
only using the mean amplitude. Overall, as with channel
and time interval selection, subject-to-subject variability
was found also in the feature set selection:
• Δ[O
2
Hb] variance (N = 10 (83%)): This feature was
selected most frequently indicating that our data
contained a large variation in variance between indi-
vidual signals and between the two task conditions,
MI-simple and MI-complex. However, the value of
the variance within an individual signal was relatively
stable fro m trial-to-trial, t herefore serving a suitable
feature for discrimination between the two tasks.
Overall subjects, t he averaged value of Δ[O
2
Hb] var-
iance revealed a significant negative correlation with
the classification accuracies in both conditions, i.e.
classification rates improved with decreasing var-
iance (MI-simple: r = -0.688*, p =0.028;MI-com-
plex: r = -0.701*, p = 0.024) (Figure 6). This finding
is in line with the tendency that has been observed
for the selection of channels (section 5.1), i.e. chan-
nels with larger SNR (in particular channel 3)
revealed higher classification accuracies.
• Δ[O
2
Hb] mean a mplitude (N = 8 (66%)): The
mean amplitude as feature reflected those individual
time intervals in which both a significant increase
within a given condition and a significant difference
between the two conditions was found. As shown by
the previous studies the mean amplitude is a reliable
feature selected for classification, in particular for
classification of two different conditions as in our
case. In our study, as again discussed for the selec-
tion of channels (section 5.1), t here was a slight ten-
dency that smaller mean amplitudes did reveal
higher classification accuracies, but no significant
correlations were found.
• Δ[O
2
Hb] skewness (N = 6 (12%)): Classification
rates also impro ved in relation to skewness. How-
ever, the relationship differed between the two con-
ditions. Skewness of signals in response to MI-
simple were negatively correlated with increasing
accuracy (r = -0.850*, p = 0.03 2), i.e. the smaller the
value of the skewness the higher the accuracy of
classification in a given subject. In contra st, in MI-
complex a positive correlation was observed (r =
0.854*, p = 0.031), i.e. the higher the skewn ess the
higher the accuracy of classification in a given sub-
ject (Figure 6). This finding may reflect di fferences
intheshapeofthesignalbetweenthesimpleand
the complex imagery task. While in response to the
simple task, h igher accuracies may have favoured a
slower signal increase, i.e. the tail on the left side of
the p robability density function was longer than the
Holper and Wolf Journal of NeuroEngineering and Rehabilitation 2011, 8:34
/>Page 10 of 13
right side and the bulk of the values was located to
the right of the peak; contrary, in response to the
complex task a faster signal increase may have been
favoured reflected by a positive skewness, i.e. the tail
on the right side was longer than on the left side.
• Δ[O
2
Hb] kurtosis (N = 5 (41%)): The last feature
was selected only in a few subjects, but was relevant
in these to achieve the reported classification accura-
cies. No correlations were found with the classifica-
tion accuracy.
Although the classification accuracies look promising
they are nevertheless subject of limitations. We hypothe-
sized that the use of simple feature sets would faci litate
potential implementation in future applications. How-
ever, due to the observed subject-to-subject variability
such an implementation would require quite different
feature sets per subject to achieve sufficient classification
accuracy. Although, the necessity fo r individualized clas-
sifier training has been recognized as a well-known issue
in single-trial classification [4], the following aspects
might have accounted for the subject-to-subject variabil-
ityobservedinourstudyandcouldbeconsideredin
future classification studies:
First, the number of trials on our study was 12 which
is comparable to previous studies [7]. However, it is
conceivable that the number of features required for
individual subjects may have b een lower if more trials
were collected. On the other side, the experimental
length was inherently limited by the repeti tive nature of
the protocol and the mental demand of the task on the
participant. Future study may explore different numbers
of trials to find a suitable balance betw een features
needed, classification accuracy and the demand of the
task.
Second, subject-to-subject variability in the hemody-
namic onset latency in response to MI performance may
be improved. The hemodynamic response measured by
fNIRS is temporally delayed from the onset of the underly-
ing neural activity about 6 s. Further, it is known that MI
signals generally exhibit longer onset latencies as com-
pared to ME signals. Previous studies found that Δ[O
2
Hb]
in response to MI increased about 2 s later compared to
real movement execution [40]. However, envisioning an
appli cation in neural interfaces, MI as mental task there-
fore still limits the practical use of NIRS based systems.
Compared to other m ental tasks this delay might be
expl ained by the training status of the individual subject.
For example, while mental tasks such as preference deci-
sion making [8] or emotional evaluation [7] might be per-
formed more intuitively without training, MI for use in
neural interfaces does require considerable training as
shown by recent evidence from both neurorehabilitation
applications [41] and operating BCIs [42]. It might be
therefore suggested that subjects experienced or trained in
MI might have elicited faster and less variable responses.
5.4 Future work
Considering future applications, while MI traini ng may
be possible in most healthy subjects and the majority of
patients, some patients, especially those severely
impaired, may not provide sufficient cognitive capabil-
ities to train MI. This might further limit the use of MI
in neural interfaces as compared to alternative BCI para-
digms using more intuitive mental tasks [8]. To evaluate
the potential use in a BCI or in neurorehabilitation, it
would be t herefore necessary to t est our classification
approach in several patient groups, such as affected by
stroke, cerebral palsy, amyotrophic lateral sclerosis, and
other motor neuron diseases. Such future work would
further require including solutions for the reduction of
subject-to-subject variability, such as specifically
designed training sessions.
Last, future studies could also address method ological
options to reduce the hemodynamic response delay in
NIRS signal. A recent example has been given by Cu i et
al. 2010 [43] who reported that it may be possible to
decode the true behavioral state from t he measured
neural signal - instead of the hemodynamic signal -
using fNIRS. The authors reported that using a multi-
variate pattern classification technique (linear support
vector machine, SVM) and systematically evaluation of
the performance of different feature spaces (signal his-
tory, history gradient, signal and spatial pattern of
Δ[O
2
Hb] and Δ[HHb]), the latency to decode a change
in behavioral state could be reduced by 50% (from 4.8 s
to 2.4 s), which would enhance the feasibility of MI
based real-time NIRS applications.
5.5 Relevance of MI classification for neurorehabilitation
Our experimental design was motivated by two aspects
related to the use of MI as mental task in neurorehabil-
itation. First, our attempt to classify two tasks differing in
complexity was motivated by the known fact that there is
a difference in (re)learning a simple as compared to a
complex task. One hypothesis is that the cognitive pro-
cessing demands may b e inherently greater for the learn-
ing of complex tasks [44]. This has demonstrated the
need to use both simple and complex skills in motor-
learning research in order to gain further insights into
these potentially distinct learning processes and - in our
case - the underlying signal features. Therefore, current
neurorehabilitation st rategies usually address tasks differ-
ing in complexity, e.g. fine coordination and precise dex-
terity versus gross movements, single finger versus whole
hand or arm movements or with versus without the use
of objects for goal-directed actions such as in our case
the keyboard. Thus, we suggested that our approach of
Holper and Wolf Journal of NeuroEngineering and Rehabilitation 2011, 8:34
/>Page 11 of 13
evaluation tasks differing in complexity, i.e. both simple
and complex finger-tapping tasks for single-trial classifi-
cation is of relevance for neurorehabilitative applications.
Second, several mental tasks have been recently inves-
tigated in the development of neural interfaces, e.g.
mental arithmetic tasks [45], language-, visual- and audi-
tory-based imagery tasks or spatial navigation imagery
[46]. Those mental tasks are suitable to fulfil the main
goals of neural interfaces, i.e. communication such as
using spelling devices or the control of external devices
such as neuroprostheses. In neurorehabilitation an addi-
tional goal is to combine neura l interfaces with the
training or relearning of impaired motor function [47].
An example for such a combined approach would be a
combination of BCI training and physical therapy such
as in stroke patients [48]. For such applicat ions, MI has
been suggested as a suitable mental task as it - accord-
ing to the simulatio n hypot hesis - not only activates the
impaired motor areas responsible for task execution
[11], but also accesses the motor network independently
of the impaired function thereby improving recovery
[49]. Especially in less severe disabled persons, e.g. in
individuals with upper-limb paralysis, MI based BCI sys-
tems could be used as tools to recruit and reinforce
spared cortical networks by activating the corresponding
neural representations. As Dobkin [50] suggested, using
such a combined training-BCI a pproach, researchers
and therapists may be able to improve the effects o f a
rehabilitation treatment a imed at im pairment and dis-
ability. Further, MI signals may enhance training possi-
bilities by providing insight whether an indivi dual is
indeed engaging the network for mental rehearsal. For
example, therapists could use the change in the MI sig-
nal to get immediate feedback about whether an indivi-
dual is optimally focussing on the i magined movement
thereby monitoring treatment progress. Last, signals
derived from MI performance may be used as direct
online feedback for the individual. Such feedback may
represent the Δ[O
2
Hb] amplitudes of the recruited
motor pools elicited in the individual’s brain, which in
turn may motivate for increased subsequent MI output
and improve the timing and completeness of imagined
movements. As a result , individuals may regain stren gth
and precision if they can find a way to pract ise with MI
signals thereby accelerating normal recovery.
6 Conclusion
To summarize, the results of our single-trial classifica-
tion showed that using the simple com bination set of
channels, time interva ls and up to four Δ[O
2
Hb] signal
features comprising Δ[O
2
Hb] mean signal amplitudes,
variance, skewness and kurtosis, it was possible t o dis-
criminate single trials of MI tasks differing in complex-
ity, i.e. simple versus complex tasks, over secondary
motor areas with an average accuracy of 81%. Although
the classification accuracies look promising they are
nevertheless subject of subject-to-subject variability and
limitations that require further evaluation. Since MI is
now applied frequently as a valid tool in neurorehabilita-
tion, the results may be of relevance for future applica-
tion using MI as mental task in combined approaches of
neurorehabilitative training together with BCI use.
Acknowledgements
The authors thank all participants for assistance in carrying out this research,
Prof. Andrew Barbour and Steven Geinitz from the Institute of Mathematics,
University of Zurich, for statistical assistance and the Swiss Society for
Neuroscience (SSN), the International Brain Research Organization (IBRO) and
the Swiss National Science Foundation (SNF) for providing the funding.
Author details
1
Biomedical Optics Research Laboratory (BORL), Division of Neonatology,
Department of Obstetrics and Gynecology, University Hospital Zurich,
Frauenklinikstrasse 10, 8091 Zurich, Switzerland.
2
Institute of
Neuroinformatics (INI), University of Zurich and ETH Zurich,
Winterthurerstrasse 190, 8057 Zurich, Switzerland.
Authors’ contributions
LH conceived of the study, conducted the fNIRS recordings, carried out the
statistical analysis, and drafted the manuscript. MW participated in the
design and coordination of the study. Both authors read and approved the
final manuscript.
Declaration of competing interests
The authors declare that they have no competing interests.
Received: 14 December 2010 Accepted: 18 June 2011
Published: 18 June 2011
References
1. Wolpaw JR, et al: Brain-computer interfaces for communication and
control. Clinical Neurophysiology 2002, 113(6):767-791.
2. Hoshi Y, Tamura M: Detection of dynamic changes in cerebral
oxygenation coupled to neuronal function during mental work in men.
Neuroscience Letters 1993, 150:5-8.
3. Muehlemann T, Haensse D, Wolf M: Wireless miniaturized in-vivo near
infrared imaging. Optics Express 2008, 16(14):10323-30.
4. Sitaram R, et al: Temporal classification of multichannel near-infrared
spectroscopy signals of motor imagery for developing a brain-computer
interface. NeuroImage 2007, 34(4):1416-1427.
5. Coyle SM, Ward TE, Markham CM: Brain-computer interface using a
simplified functional near-infrared spectroscopy system. Journal of Neural
Engineering 2007, 4(3):219-226.
6. Naito M, et al: A Communication Means for Totally Locked-in ALS
Patients Based on Changes in Cerebral Blood Volume Measured with
Near-Infrared Light. IEICE T Inf Syst 2007, 90(7):1028-1037.
7. Tai K, Chau T: Single-trial classification of NIRS signals during emotional
induction tasks: towards a corporeal machine interface. Journal of
NeuroEngineering and Rehabilitation 2009, 6(1):39.
8. Luu S, Chau T: Decoding subjective preference from single-trial near-
infrared spectroscopy signals. Journal of Neural Engineering 2009,
6(1):016003.
9. Jeannerod M: Neural Simulation of Action: A Unifying Mechanism for
Motor Cognition. NeuroImage 2001, 14(1):S103-S109.
10. Rizzolatti G, Fogassi L, Gallese V: Neurophysiological mechanisms
underlying the understanding and imitation of actions. Nature Reviews
Neuroscience 2001, 2:661-670.
11. Jeannerod M: The representing brain: Neural correlates of motor
intention and imagery. Behavioural Brain Research 1994, 17:187-245.
12. Fadiga L, et al: Motor facilitation during action observation: a magnetic
stimulation study. Journal of Neurophysiology 1995, 73(6):2608-2611.
Holper and Wolf Journal of NeuroEngineering and Rehabilitation 2011, 8:34
/>Page 12 of 13
13. Decety J: Do imagined and executed actions share the same neural
substrate? Cognitive Brain Research 1996, 3(2):87-93.
14. Lotze M, et al: Activation of cortical and cerebellar motor areas during
executed and imagined hand movements: an fMRI study. Journal of
Cognitive Neuroscience 1999, 11(5):491-501.
15. Bovend’Eerdt TJ, et al: An Integrated Motor Imagery Program to Improve
Functional Task Performance in Neurorehabilitation: A Single-Blind
Randomized Controlled Trial. Archives of Physical Medicine and
Rehabilitation 2010, 91(6):939-946.
16. Pfurtscheller G, et al: Brain-computer communication based on the
dynamics of brain oscillations. Supplements to Clinical Neurophysiology
2004, 57:583-91.
17. Andersen R, Hwang E, Mulliken G: Cognitive Neural Prosthetics. Annual
Review of Psychology 2010, 61(1):169-190.
18. Seitz RJ, et al: Role of the Premotor Cortex in Recovery From Middle
Cerebral Artery Infarction. Arch Neurol 1998, 55(8):1081-1088.
19. Chollet F, et al: The functional anatomy of motor recovery after stroke in
humans: a study with positron emission tomography. Ann Neurol 1991,
29(1):63-71.
20. Cao Y, et al: Pilot Study of Functional MRI to Assess Cerebral Activation
of Motor Function after Poststroke Hemiparesis. Stroke 1998,
29(1):112-122.
21. Weiller C, et al: Individual patterns of functional reorganization in the
human cerebral cortex after capsular infarction. Ann Neurol 1993,
33(2):181-9.
22. Holper L, et al: Testing the potential of a virtual reality
neurorehabilitation system during performance of observation, imagery
and imitation of motor actions recorded by wireless functional near-
infrared spectroscopy (fNIRS). Journal of NeuroEngineering and
Rehabilitation 2010, 7(1):57.
23. Holper L, et al: Extension of mental preparation positively affects motor
imagery: a functional near-infrared spectroscopy study. Cortex 2011.
24. Oldfield R: The assessment and analysis of handedness: the Edinburgh
inventory.
Neuropsychologia 1971, 9(1):97-113.
25. Isaac A, Marks D, Russell D: An instrument for assessing imagery of
movement: The vividness of movement imagery questionnaire (VMIQ).
Journal of Mental Imagery 1986, 10(4):23-30.
26. Whetstone T: Enhancing Psychomotor Skill Development Through the
Use of Mental Practice. Journal of Industrial Teacher Education 1995, 32(4).
27. Stinear C, et al: Kinesthetic, but not visual, motor imagery modulates
corticomotor excitability. Experimental Brain Research 2006, 168(1):57-164.
28. Neuper C, et al: Imagery of motor actions: Differential effects of
kinesthetic and visual-motor mode of imagery in single-trial EEG.
Cognitive Brain Research 2005, 25(3):668-677.
29. Wolf M, et al: Different time evolution of oxyhemoglobin and
deoxyhemoglobin concentration changes in the visual and motor
cortices during functional stimulation: a near-infrared spectroscopy
study. NeuroImage 2002, 16(3 Pt 1):704-12.
30. Jaspers H: The ten-twenty electrode system of the International
Federation. Electroencephalography and Clinical Neurophysiology 1958,
10:371-375.
31. Chen H, et al: Evaluation of the effective connectivity of supplementary
motor areas during motor imagery using Granger causality mapping.
NeuroImage 2009, 47(4):1844-1853.
32. Hanakawa T, et al: Functional Properties of Brain Areas Associated With
Motor Execution and Imagery. Journal of Neurophysiology 2003,
89(2):989-1002.
33. Delpy D, et al: Estimation of optical path length through tissue from
direct time of flight measurements. Physics in Medicine and Biology 1988,
33:1433-42.
34. Wray S, et al: Characterization of the near infrared absorption spectra of
cytochrome aa3 and haemoglobin for the non-invasive monitoring of
cerebral oxygenation. Biochimica et Biophysica Acta (BBA) - Bioenergetics
1988, 933(1):184-192.
35. Zhao H, et al: Maps of optical differential pathlength factor of human
adult forehead, somatosensory motor and occipital regions at multi-
wavelengths in NIR. Physics in Medicine and Biology 2002, 47:2075-2093.
36. Liao CH, et al: Estimating the Delay of the fMRI Response. NeuroImage
2002,
16(3 Part 1):593-606.
37. Logothetis NK, et al: Neurophysiological investigation of the basis of the
fMRI signal. Nature 2001, 412(6843):150-157.
38. Homan R, Herman J, Purdy P: Cerebral location of international 10-20
system electrode placement. Electroencephalogr Clin Neurophysiol 1987,
66(4):376-82.
39. Steinmetz H, Fürst G, Meyer B: Craniocerebral topography within the
international 10-20 system. Electroencephalogr Clin Neurophysiol 1989,
72(6):499-506.
40. Wriessnegger SC, Kurzmann J, Neuper C: Spatio-temporal differences in
brain oxygenation between movement execution and imagery: A
multichannel near-infrared spectroscopy study. International Journal of
Psychophysiology 2008, 67(1):54-63.
41. Olsson CJ, Nyberg L: Motor imagery: if you can’t do it, you won’t think it.
Scandinavian Journal of Medicine & Science in Sports 2010.
42. Grosse-Wentrup M: Biased feedback in brain-computer interfaces. Journal
of NeuroEngineering and Rehabilitation 2010, 7(1):34.
43. Cui X, Bray S, Reiss AL: Speeded Near Infrared Spectroscopy (NIRS)
Response Detection. PLoS ONE 2010, 5(11):e15474.
44. Wulf G, Shea CH: Principles derived from the study of simple skills do
not generalize to complex skill learning. Psychonomic Bulletin & Review
2002, 9(2):185-211.
45. Bauernfeind G, et al: Development, set-up and first results for a one-
channel near-infrared spectroscopy system. Biomed Tech 2008, 53:36-43.
46. Dyson MF, Gan JQ: Localisation of cognitive tasks used in EEG-based
BCIs. Clinical Neurophysiology 2010, 121(9):1481-1493.
47. Birbaumer N, Sauseng P: Brain-Computer Interface in Neurorehabilitation.
Brain-Computer Interfaces Springer Berlin Heidelberg; 2010, 155-169.
48. Broetz D, et al: Combination of Brain-Computer Interface Training and
Goal-Directed Physical Therapy in Chronic Stroke: A Case Report.
Neurorehabilitation and Neural Repair 2010, 24(7):674-679.
49. Sharma N, Pomeroy VM, Baron J-C: Motor Imagery: A Backdoor to the
Motor System After Stroke? Stroke 2006, 37(7):1941-1952.
50. Dobkin BH: Brain-computer interface technology as a tool to augment
plasticity and outcomes for neurological rehabilitation. The Journal of
Physiology 2007, 579(3):637-642.
doi:10.1186/1743-0003-8-34
Cite this article as: Holper and Wolf: Single-trial classification of motor
imagery differing in task complexity: a functional near-infrared
spectroscopy study. Journal of NeuroEngineering and Rehabilitation 2011 8:34.
Submit your next manuscript to BioMed Central
and take full advantage of:
• Convenient online submission
• Thorough peer review
• No space constraints or color figure charges
• Immediate publication on acceptance
• Inclusion in PubMed, CAS, Scopus and Google Scholar
• Research which is freely available for redistribution
Submit your manuscript at
www.biomedcentral.com/submit
Holper and Wolf Journal of NeuroEngineering and Rehabilitation 2011, 8:34
/>Page 13 of 13