WETLAND AND WATER RESOURCE MODELING AND ASSESSMENT: A Watershed Perspective - Chapter 18 potx
Bạn đang xem bản rút gọn của tài liệu. Xem và tải ngay bản đầy đủ của tài liệu tại đây (385.29 KB, 17 trang )
Part V
Watershed Assessment
and Management
© 2008 by Taylor & Francis Group, LLC
215
18
Geospatial Decision
Models for Assessing
the Vulnerability of
Wetlands to Potential
Human Impacts
Wei “Wayne” Ji and Jia Ma
18.1 INTRODUCTION
Characterized by a shallow water table (Sharitz and Batzer 1999), wetlands are tran-
sitional landscapes between open water systems and terrestrial uplands. They provide
many crucial ecosystem functions and values, such as ood control, groundwater
recharge, sediment and pollutant retention/stabilization, nutrient removal/transfor-
mation, and sh and wildlife habitat and diversity (Mitsch and Gosselink 2000).
Wetlands are prone to be lled in, drained, or ponded for a variety of human uses
including stream channelization and maintenance, urban development, transporta-
tion improvement, or conversion to agricultural uses (Dodds 2002). To protect wet-
land resources, many laws and regulatory programs have been established. Among
them, the Clean Water Act (CWA) Section 404 is the primary federal law aiming to
maintain and restore the chemical, physical, and biological integrity of the wetlands
in the United States. It authorizes U.S. federal agencies, mainly the U.S. Army Corps
of Engineers, to issue permits for the discharge of dredged or ll material into the
navigable waters at specic disposal sites, including wetlands (USACE: http://www.
usace.army.mil/cw/cecwo/reg/sec404.htm). To comprehensively evaluate individual
or cumulative impacts of human activities on existing wetlands, a regulatory per-
mit assessment requires quickly retrievable environmental and socioeconomic data,
and more importantly, a scientically justiable evaluation framework for analyz-
ing those data. In recent decades, GIS techniques have been increasingly used to
facilitate the data management and visualization in regulatory wetland assessments
or permit reviews, aiming to improve the efciency of the permit assessment pro-
cess. A pilot decision supporting GIS for the permit analysis was developed in the
early 1990s (Ji and Johnston 1994, 1995). The system was based on a widely used
commercial GIS (Arc/Info, ESRI, Inc.), with customized user interfaces for data
retrieval, visualization, and analysis. Other similar GIS-based technical tools were
also developed, such as the Permit Application Management System (PAMS) for
© 2008 by Taylor & Francis Group, LLC
216 Wetland and Water Resource Modeling and Assessment
evaluating and tracking the status of permit applications submitted for approval by
the Connecticut Department of Environmental Protection, and ERATools for man-
aging permit data and analyzing potential impacts of permitted activities by the
Florida Department of Environmental Protection. However, while these GIS tools
are powerful and useful in data management, visualization, and spatial analysis, they
usually lack the decision rules or models that can link geospatial data manipulations
to evaluating how vulnerable wetland functions and values would be under potential
human impacts in the context of regulatory assessment. Thus, rule-based decision
models need to be developed and incorporated with the GIS tools.
During recent decades, numerous environment assessment models have been
developed, which can be used, at least partially, to evaluate wetland functions and
values for various decision-making purposes. Examples of these models include
the Habitat Evaluation Procedure (HEP) (USFWS [U.S. Fish and Wildlife Ser-
vice] 1980), the Wetland Evaluation Technique (WET) (Adamus 1983), the Index
of Biological Integrity (IBI) (Karr 1997), the GIS-based Wetland Value Assessment
Methodology (Ji and Mitchell 1995), and the Hydrogeomorphic Approach (HGM)
(Hollands and Magee 1985, Brinson 1996). However, none of the existing models
can be effectively used with GIS data to assess wetlands for regulatory wetland
assessments, such as the Section 404 permit review. This is because (1) these models
were originally developed for other applications (e.g., wetland restoration planning
or wildlife habitat evaluation), and thus do not address all the functions, such as
socioeconomic function, of wetlands that need to be assessed in regulatory assess-
ments; and (2) all of these models require a great amount of eld data collection and
specialized expertise for implementation. Therefore, it is not effective and efcient
to directly adopt and integrate the existing models with GIS to address the needs in
wetland regulatory assessment. Clearly, there is a critical need for GIS-based deci-
sion models in order to handle increasing volumes of existing geospatial data for
rapidly assessing wetland vulnerability in management decision making (USEPA
2004 research solicitation: EPA FRL-OW-7620-6).
To address this objective, our efforts focused on the design of geospatial decision
models that generate a ranked wetland vulnerability index (WVI) based on geospa-
tial data and analysis. In addition, a user-friendly decision support GIS with custom-
ized user interfaces was developed to facilitate the implementation of the models.
The developed decision models were applied to the Little Blue River watershed in
the state of Missouri in the United States.
18.2 GEOSPATIAL DECISION MODELS
A geospatial decision model is one that generates output for management decision
support, such as ranked indices, based on geospatial data and analysis. In this study,
the models are to be used for assessing wetland vulnerability, which is dened as
the degradation likelihood of wetland functions and values under potential anthro-
pogenic pressures. Certain characteristics of wetlands (e.g., the size or recreational
usage) and the spatial occurrence of certain concerned entities (e.g., endangered spe-
cies or a historical site) related to particular wetlands may largely determine the
degree of vulnerability of the wetland’s functions and values. Thus, the geospatial
© 2008 by Taylor & Francis Group, LLC
Geospatial Decision Models for Assessing the Vulnerability of Wetlands 217
decision models were developed so they can be used to identify and evaluate these
characteristics and the concerned entities of wetlands with GIS-based data and anal-
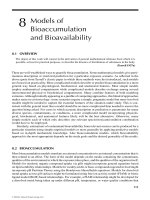
ysis; they follow a 3-step procedure (Figure 18.1):
18.2.1 DETERMINATION OF INDICATORS AND METRICS
To address the fundamental needs of the regulatory assessment of wetlands, four wet-
land functions were selected for our modeling: (1) biological supporting function, (2)
hydrological function, (3) physiographic function, and (4) socioeconomic function.
For each of these functions, three indicators were identied (Table 18.1). The selection
of the indicators for the geospatial decision models follows three considerations:
(a) the selected indicators of a particular wetland function should be able to
address major concerns of wetland regulatory assessment;
(b) the selected indicators should have been used in wetland assessment by
related environmental management agencies or identied in research pub-
lications; and
(c) the indicators can be evaluated using GIS-based data and analysis.
The indicator selection process involved consultations with related governmen-
tal agencies that are responsible for wetland regulatory assessment, including the
U.S. Army Corps of Engineers (USACOE) and the U.S. Environmental Protection
Agency. We also conducted literature reviews (e.g., USEPA 2002, Stein 1998, Ada-
mus 1983, USACOE 1997, Hollands and Magee 1985, Brinson 1996, Sousa 1985,
Cook et al. 1993, Karr and Chu 1998, Zampella 1994, Hruby et al. 1995). As shown
in Table 18.1, the measurement of an indicator is referred to as metrics. According
to the value of the metrics, the decision criteria (or decision boundaries) for evaluat-
ing a particular indicator are determined. Ranking scores are assigned based on the
decision criteria. When necessary, weights may be determined and applied to certain
ranking scores. To evaluate a particular indicator, appropriate GIS data and spa-
tial analysis operations need to be identied and used, as shown in the last column
of Table 18.1. The metrics are either geospatial or descriptive. Geospatial metrics
can measure the spatial occurrence and size of a wetland or concerned entities in
a potentially impacted area, or their spatial proximity to concerned human activity
locations. The descriptive metrics help identify certain characteristics or features of
Determination of indicators
and their metrics
Fuzzy math-based determination
of decision criteria
Generation of wetland
vulnerability indices
Use of appropriate geospatial data and
spatial analysis to evaluate the metrics
of indicators of particular wetland
functions
FIGURE 18.1 Wetland vulnerability assessment with geospatial decision models.
© 2008 by Taylor & Francis Group, LLC
218 Wetland and Water Resource Modeling and Assessment
TABLE 18.1
Structure of geospacial decision models. The indicators and metrics are for selected wetland functions. The decision criteria
and score/weight columns show the examples of possible metric values and scores. The GIS data column illustrates some
typical data sets that can be used to evaluate the metrics.
Indicator Metrics Decision criteria Score Weight GIS data
Biological supporting function
Total area of a target wetland (BV1) Total area of a wetland in a
potentially impacted location
>75 percentile 1.0 Wetland data and maps
≥ 25 and < 75 percentile 0.5
< 25 percentile 0.1
Proximity to species of concern (BV2) The number of species of concern
>5 species 1.0 3 Wildlife species data
≥2 and < 5 species 0.5 2
< 2 species 0.1 1
Habitat fragmentation (BV3) The density of road > 20% 1.0 Road density data
≥ 10% and < 20% 0.5
< 10% 0.1
Hydrological function
Flood risk (HV1)
The percentage of oodway >75 percentile
1.0 Stream/river data for high-risk
ooding regions
≥ 25 and < 75 percentile 0.5
< 25 percentile 0.1
Hydrological modication (HV2) The occurrence of dams Occurrence
Not occurrence
1 Datasets for dams
0
© 2008 by Taylor & Francis Group, LLC
Geospatial Decision Models for Assessing the Vulnerability of Wetlands 219
Pollution potential (HV2) The number of pollution sites >75 percentile 1.0 Landlls and mining wastes
data, etc.
≥ 25 and < 75 percentile 0.5
< 25 percentile 0.1
Physiographic function
Erosion potential (PV1) The percentage of erodible soil > 75 percentile
1.0 Soil data and maps
≥25 and < 75 percentile 0.5
<25 percentile 0.1
Drinking water relevance (PV2) The occurrence of public water
supply facilities
Occurrence
Not occurrence
1
0
PWS lakes, tanks, wells, and
springs data
Nearby land uses (PV3) The percentage of urban and
agricultural lands
>75 percentile 1.0 Land use/land cover data
≥ 25 and < 75 percentile 0.5
< 25 percentile 0.1
Socioeconomic function
Proximity to important public land (SV1) Percentage of public lands
>75 percentile 1.0 Data for public lands, national
wild lands, scenic rivers, etc.
≥ 25 and < 75 percentile 0.5
< 25 percentile 0.1
Recreation potential (SV2) Presence of public parks or
recreation areas
Occurrence 1 Data for federal, state, or city
parks, etc.
Not occurrence 0
Proximity to historic and cultural sites (SV3) The number of historic and
cultural sites
> 3 1.0 Historic or cultural sites
≥1 and < 3 percentile 0.5
None 0.1
© 2008 by Taylor & Francis Group, LLC
220 Wetland and Water Resource Modeling and Assessment
the wetlands or related entities under assessment, such as the usage of wetlands (e.g.,
for recreation), hydrological facilities near wetlands (e.g., a dam), and riparian land
use types and ownership.
18.2.2 DETERMINATION OF DECISION CRITERIA
Decision criteria are used to evaluate indicators based on the values of the corre-
sponding metrics (Table 18.1). In our study, three methods were employed to deter-
mine the decision criteria based on (a) spatial statistics, (b) published results, or (c)
professional judgments. The spatial statistics, such as the percentile, equal interval,
standard deviation, or user-dened interval of metric values, were used to determine
the decision criteria for ranking most of the selected indicators of wetlands. This
statistical approach considers the variation of values of a particular indicator across
the study area. Some decision criteria were adopted from the ndings of published
environmental studies or environmental management documents (e.g., ones relat-
ing to species density; USEPA 2002). As in many other instances of environmental
decision making, professional judgments also played a role in determination of deci-
sion criteria for some indicators. Taking the indicator “Proximity to species of con-
cerns (BV2),” for example, the decision criteria were adopted based on the published
guidelines (USEPA 2002):
If less than 2 species are found (“less vulnerable”) near a wetland, the indica-
tor receives a score of 0.1;
If 2–5 species (“vulnerable”), the indicator receives a score of 0.5;
If more than 5 species (“highly vulnerable”), the indicator receives a score of 1.0.
In addition, different weights were given to the species of concern based on their
conservation status as endangered (a weight of 3), threatened (a weight of 2), or at
risk (a weight of 1).
The decision criteria with the cutoff thresholds, like those above, may cause
imprecise evaluation of metrics, especially when the metric value is close to the
thresholds. For example, according to the thresholds of the decision criteria used for
the above species indicator, a wetland that supports 3 species is ranked the same (a
score of 0.5 or “vulnerable”) with a wetland supporting 4 species. To take account
of the vagueness and the nonspecicity of certain metrics values, a computational
method based on fuzzy math was developed and applied to the evaluation of some
indicators. With this method, the triangular-shaped fuzzy membership function
(Tran et al. 2002) is utilized to determine the degree of certainty (fuzzication)
of each metric value belonging to a certain vulnerability level, which is calculated
by combining the portioned degree of certainty of the metric values in each vul-
nerability level. Taking the “Proximity to species of concerns (BV2)” indicator, for
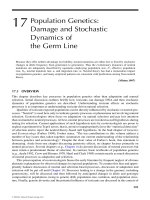
example, the fuzzication works as illustrated in Figure 18.2.
According to Figure 18.2, the wetland with 3 species of concern in its proximity
has a “certainty” value of 0.25 in the “less vulnerable” domain, the value of 0.75 in
the “vulnerable” domain, and the value of 0 for the “highly vulnerable” domain. For
the wetland with 4 species of concern, the certainty values in these domains are 0,
1.0, and 0, respectively. When combining these values:
© 2008 by Taylor & Francis Group, LLC
Geospatial Decision Models for Assessing the Vulnerability of Wetlands 221
Metric value = 0.25 * 0.1 + 0.75 * 0.5 + 0.0 * 1.0 = 0.4 (for the 3 species case)
Metric value = 0.0 * 0.1 + 1.0 * 0.5 + 0.0 * 1.0 = 0.5 (for the 4 species case)
Thus, the fuzzy math−based method is more precise for distinguishing the differ-
ence between wetlands with 3 species and 4 species than using the cutoff thresholds
that treats the two cases equally.
18.2.3 CALCULATION OF WETLAND VULNERABILITY INDEX
We developed calculations that incorporate the ranked scores of the indicators to
generate both the vulnerability index for individual wetland functions and the over-
all vulnerability index for all wetland functions together. The vulnerability index for
individual wetland functions is calculated using the following equation:
VI
k
= W
1
*V
1
+ W
1
*V
2
+ + W
n
*V
n
(18.1)
where:
VI
k
= vulnerability index for the wetland function k
K = denoting an individual function: b for biological supporting function, h for
hydrological function, p for physiographic function, and s for socioeconomic
function, respectively
V
n
= the ranked score value of the nth indicator of a particular function
W
n
= the weight of nth indicator when it applies
Then, the vulnerability index for each wetland function (VI
k
) is ranked in one of
three possible vulnerability levels, “highly vulnerable,” “vulnerable,” or “less vul-
nerable,” by evenly dividing the maximum value of VI
k
for the assessment area into
three intervals. To calculate the overall wetland vulnerability index, we rst normal-
ize each VI
k
using the range of the score value of each wetland function:
NVI
k
= (VI
k
– VI
min
)/ (VI
max
– VI
min
)(18.2)
Certainty
Metrics evaluation threshold
(the numer of species)
25
(1) (2) (3)
1.0
0.8
0.6
0.4
0.2
0.0
FIGURE 18.2 The triangular fuzzy membership functions for evaluating “species of con-
cern” indicator. Membership function (1) denotes the “less vulnerable” level (the metric value
= 0.1); (2) denotes the “vulnerable” level (the metric value = 0.5); (3) denotes the “highly
vulnerable” level (the metric value = 1.0).
© 2008 by Taylor & Francis Group, LLC
222 Wetland and Water Resource Modeling and Assessment
where:
NVI
k
= normalized vulnerability index of the wetland function k,
VI
min
= the sum of possible minimum score values of all indicators of the wetland
function k,
VI
max
= the sum of possible maximum score values of all indicators of the wetland
function k.
The objective of the normalization is to treat all the functions equally in the
index calculation by eliminating the effect of different score ranges among different
wetland functions. Then the overall wetland vulnerability index (WVI) is calculated
by combining the normalized vulnerability indices of all the wetland functions:
WVI = NVI
b
+ NVI
h
+ NVI
p
+ NVI
s
(18.3)
The overall wetland vulnerability indices are ranked by evenly dividing the maxi-
mum value of WVI for the assessment area into three possible vulnerability levels:
“highly vulnerable,” “vulnerable,” and “less vulnerable.”
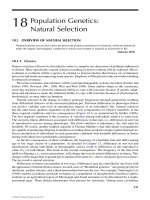
18.3 DECISION SUPPORT GIS FOR MODEL IMPLEMENTATION
Focusing on the implementation of the geospatial decision models for wetland
vulnerability assessment, a decision support GIS (Figure 18.3) was developed
with four major functions: (1) geospatial data management, (2) analytical query,
(3) vulnerability assessment modeling, and (4) assessment result output. This was
accomplished by customizing a widely used commercial GIS, ArcView (ESRI, Inc.),
in order to fully utilize its capabilities in geospatial data handling, and increase the
model’s applicability and transferability in the community of users. Visual Basic
of Application, an object-oriented language, was used to program ArcObject (the
customizable components available with ArcView) in creation of the user-friendly
graphical user interfaces (GUI) for implementing all the model functions.
18.3.1 GEOSPATIAL DATA MANAGEMENT FUNCTION
A comprehensive wetland vulnerability assessment relies on efciently retrieving
sufcient data and information that address major concerns of wetland conserva-
tion. Therefore, a geospatial database management function is fundamental to the
decision support GIS. This system function (Figure 18.4) is focused on two technical
objectives that allow users to efciently manage geospatial data for modeling:
1. Categorizing and organizing existing data sets. The interface shown in
Figure 18.4a provides the user a tool for categorizing miscellaneous unor-
ganized geospatial data into the classes that address major concerns in the
assessment of biological, hydrologic, physiographic, and socioeconomic
functions of a wetland.
2. Facilitating data retrieval in modeling. A dataset for addressing a particular
concern or a group of data sets for addressing multiple concerns can be ef-
ciently selected from corresponding data categories through the interface
shown by Figure 18.4b.
© 2008 by Taylor & Francis Group, LLC
Geospatial Decision Models for Assessing the Vulnerability of Wetlands 223
18.3.2 ANALYTICAL QUERY FUNCTION
As a GIS operation, the analytical query is referred to the retrieval, visualization,
spatial analysis, or modeling of geospatial data in order to evaluate specic criteria
or answer research questions quantitatively or qualitatively. A wetland vulnerability
assessment usually requires the verication of spatial proximity or other relation-
ships between the site of a proposed activity and a potentially impacted wetland
or the locations of other entities of concern, such as historical permit sites, impor-
tant habitats, biological resources, and cultural facilities. Therefore, the analytical
query function of the decision support GIS was developed for the following major
capabilities, which can be implemented through several customized interfaces
(Figure 18.5):
1. Identifying and displaying the spatial location of a proposed activity in
relation to a potentially affected wetland (Figure 18.5a). This is done by
searching the proposed activity site with its known geographic coordinates
or using the linguistic description (e.g., the name of a river) of the proposed
activity location to identify the site on a background map.
Decision Support GIS
Analytical Query
Vulnerability Assessment Modeling
Assessment Result Output
Historical
activity
documents
Vulnerability
index map
Used
decision
criteria
Assessment
Implementation
Biological
Data
Geodatabase
(Data storage,
integration
and update)
Socioeconomic
Data
Geospatial Data Management
Hydrological
Data
Physiographic
Data
Activity
Site
FIGURE 18.3 Key functions and architecture diagram of the decision support GIS
described in section 18.3.
© 2008 by Taylor & Francis Group, LLC
224 Wetland and Water Resource Modeling and Assessment
2. Specifying spatial and temporal restrictions (e.g., distance, time, etc.), related
attribute characteristics, or a combination of search criteria to identify con-
cerned environmental or socioeconomic entities that might be affected
by the proposed activity (Figure 18.5b). Graphical buffer zones (e.g., 500
meters) can be specied and generated around the proposed activity site or
the wetland(s) to search the entities of concern within the buffer distance.
(a) (b)
FIGURE 18.4 Two example interfaces designed for the geospatial database management
function. Geospatial data are categorized into six classes for management in the modeling: (1)
jurisdictional and watershed boundaries, (2) physical geographical data, (3) water resources
and hydrological data, (4) public water supply and water quality data, (5) biological and envi-
ronmental data, (6) socioeconomic and cultural data. (a) Categorizing miscellaneous, unor-
ganized data into one of appropriate classes. (b) Facilitating geospatial data retrieval from
organized data category folders.
FIGURE 18.5 The illustration of user-friendly interfaces and capabilities for the analytical
query function. (a) Locating a proposed activity site. (b) Dening buffer size to search for
environmental and other entities of concern. (c) Identifying the spatial occurrences of con-
cerned entities in relation to a proposed activity site.
© 2008 by Taylor & Francis Group, LLC
Geospatial Decision Models for Assessing the Vulnerability of Wetlands 225
3. Identifying the spatial occurrences and measuring the spatial proximity of
concerned environmental or socioeconomic entities in relation to the pro-
posed activity site (Figure 18.5c). This will help answer specic analysis
questions, such as “Are there any endangered species or important cultural
facilities? How far are they from the proposed activity location?”
18.3.3 VULNERABILITY ASSESSMENT MODELING FUNCTION
When it comes to the implementation of geospatial decision models for wetland
vulnerability assessment, a fundamental task is to evaluate the metrics of indicators
based on geospatial data and analysis. A decision support GIS function was designed
for this capability and includes spatial buffer generation, entity retrieval and visu-
alization, spatial distance calculation, area measurement, and attribute information
retrieval and verication. For the model implementation, a decision rule wizard
(Figure 18.6a) was created to display all the indicators for each wetland function.
Additionally, the assessment wizard (Figure 18.6b) was designed for all the neces-
sary procedures ranging from indicator selection, metrics evaluation, decision crite-
ria determination, weight selection, to fuzzy math–based evaluation of metrics.
18.3.4 ASSESSMENT RESULT OUTPUT FUNCTION
The assessment result output function includes the following capabilities:
1. Generating the vulnerability index maps for assessed wetlands using specially
designed map symbols showing the levels of vulnerability. With these maps,
the user can efciently verify assessment results and make further decisions.
2. Storing the decision criteria used for assessed wetlands.
3. Managing historical activity documents for future reference.
18.4 MODEL APPLICATION
18.4.1 S
TUDY AREA AND GEOSPATIAL DATA
We applied developed decision models to the Little Blue River watershed, which
is located on the fringe of Kansas City in the state of Missouri (United States)
(Figure 18.7). The basin topography consists of rolling to hilly plains. The land cover
of the watershed is mostly rural and dominated by cropland and grassland in addition
to scattered forestland. Metropolitan Kansas City’s suburbs are expanding eastward
rapidly within the watershed, indicating the threats to the existing wetlands. Several
perennial and intermittent rivers falling within the area have been experiencing sub-
stantial harmful human alterations. A large number of habitats have been converted
to other land uses in order to enhance social benets. Natural riverine processes,
critical to providing ecosystem goods and services, have been greatly altered (U.S.
National Research Council 2002). Flowing through the Kansas City metropolitan
area, the Little Blue River is grossly polluted by point and nonpoint source pollutants
due to extensive channel alterations. Degraded wetland habitats are thus obviously
and continuously being modied in line with some human interests.
© 2008 by Taylor & Francis Group, LLC
226 Wetland and Water Resource Modeling and Assessment
(a)
(b)
FIGURE 18.6 Illustrations of (a) the decision rule wizard and (b) the assessment wizard
designed for implementation of geospatial decision models. (See color insert after p. 162.)
© 2008 by Taylor & Francis Group, LLC
Geospatial Decision Models for Assessing the Vulnerability of Wetlands 227
In the assessment, we adopted a 500-meter riparian buffer zone as the potential
impact area surrounding each wetland (Magee 1998). Our aim was to capture all the
possible entities that could be impacted directly or indirectly by modications of
wetland regimes.
The boundaries of the Little Blue River watershed and its subwatersheds were
delineated using the ArcHydro tool (Maidment and Djokic 2000) based on the 30-
meter DEM (digital elevation model) data downloaded from the Web site of the
Missouri Spatial Data Information Service ( Gen-
eral occurrences of wetlands (Figure 18.7) were obtained from the National Wetland
Inventory (NWI) maps at a scale of 1:24,000. To be compatible with the wetland def-
initions (1987) of the U.S. Army Corps of Engineers, preprocessing of the NWI data
was conducted to lter out non-wetlands, such as farm ponds, permanently ooded
areas, and other water regimes with drainages or other types of human activities.
The wetland regime data were further rened based on visual interpretations using
aerial photos (2003) obtained from the National Agricultural Inventory Program
(NAIP). The rened wetland data, as shown in Figure 18.8 (left), include features
of dominant (deciduous) forested wetlands located at water-accumulated spots near
stream conuences.
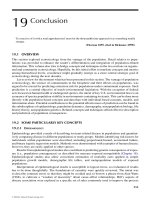
18.4.2 RESULTS AND VALIDATION
The map depicting overall vulnerability index values for all the wetlands in the Little
Blue River watershed is presented in Figure 18.8 (middle). The land cover types
were delineated by classifying satellite remote sensing data (Ji et al. 2006). The
general spatial patterns were identied based on the results of the wetland vulner-
ability assessment. The wetland regimes located near urban centers had relatively
high values of vulnerability. The wetlands that were more vulnerable are closer to
the streams of higher order. The wetlands close to man-made lakes also demon-
strated high vulnerability, probably caused by high water volumes impounding from
dams. In the middle part of the watershed, several wetlands were highly vulnerable,
as they are serving as natural buffers preventing residential areas downstream from
Legend
National Wetland Inventory
Kansas City
Missouri
Watershed Boundary
Interstate Highway
Kansas City Urban Clusters
FIGURE 18.7 The assessment area in the Little Blue River watershed, Kansas City, Mis-
souri. (See color insert after p. 162.)
© 2008 by Taylor & Francis Group, LLC
228 Wetland and Water Resource Modeling and Assessment
being ooded during heavy rainfall. These wetlands are worthy of special attention
and protection.
To validate the results of the assessment, we compared the regional wetland vul-
nerability map, which was generated using these models, with the locations of the
human activities that were previously permitted through Section 404 reviews (data
source: U.S. Army Corps of Engineers in Kansas City), assuming that the latter would
usually occur at the wetland regimes of low vulnerability. (Note: the activities per-
mitted under the mitigation bank option may be an exception to this assumption. In
this case such activity locations should be excluded from use in the validation.) The
permit location data show that between 1999 and 2000, there were 19 such permitted
human activities near the existing wetland regimes in the Little Blue River watershed
(Figure 18.8, right). The comparison indicated that none of the 19 sites were at highly
vulnerable wetland regimes, with 14 sites at less vulnerable wetlands and 5 sites by
vulnerable wetlands. This signicant agreement between the two data sets validates
the effectiveness of the geospatial decision models developed through this project.
18.5 CONCLUSIONS AND DISCUSSIONS
The test assessments in the Little Blue River watershed demonstrate the effective-
ness of geospatial decision models in identication of vulnerable wetlands. The wet-
land vulnerability across the watershed reveals distinguishable spatial variation in
relation to streams and land uses.
The model-generated wetland vulnerability indices and their distribution maps
can be used as the prewarning information for regulatory wetland assessment, such
as the CWA Section 404 permit review and other related wetland managements.
Together with the GIS-based decision support system, the geospatial decision
models demonstrate the following technical advantages, which make the geospatial
data–based wetland assessment an effective and efcient tool for management deci-
sion support:
Existing wetlands
Less Vulnerable
Vulnerable
Highly Vulnerable
* Historical Permit Sites
Wetland Vulnerability
Wetland Vulnerability
Land Cover Types
Less Vulnerable
Vulnerable
Highly
Vulnerable
Open Water
Built-up
Forestland
Non-forest land
FIGURE 18.8 Vulnerability assessment results for the Little Blue River watershed. (See
color insert after p. 162.)
© 2008 by Taylor & Francis Group, LLC
Geospatial Decision Models for Assessing the Vulnerability of Wetlands 229
1. Wetland vulnerability assessment can be carried out at any geographic scale
within a watershed, allowing the linkage between landscape characteristics
and wetland condition evaluation.
2. The indicators used in the models are designed such that they can be com-
pletely measured by analyzing geospatial data rather than through time-
consuming led surveys. As such, the decision criteria for evaluating
wetland vulnerability can be dynamically determined based on the geo-
spatial statistics of values of individual indicators across various landscape
conditions in a given geographic area. This provides a frequency basis of
land characteristics for reducing intrasite scale effects.
3. The fuzzy math–based algorithm can increase the precision of evaluations
of indicator metrics. The customized decision support GIS provides user-
friendly interfaces, which make it possible to rapidly assess wetlands with
multiple criteria at changing geospatial scales.
REFERENCES
Adamus, P. R. 1983. A method for wetland functional assessment. FHWA-IP-82-23. Wash-
ington, DC: U.S. Department of Transportation, Federal Highway Administration.
Brinson, M. M. 1996. Assessing wetland functions using HGM. National Wetlands Newslet-
ter 18(1):10−16.
Cook, R. A., A. J. Lindley Stone, and A. P. Ammann. 1993. Method for the evaluation and
inventory of vegetated tidal marshes in New Hampshire. Concord: Audubon Society
of New Hampshire.
Dodds, W. K. 2002. Freshwater ecology: Concepts and environmental applications. San
Diego, CA: Academic Press.
Hollands, G. G., and D. W. Magee. 1985. A method for assessing the functions of wetlands.
In Proceedings of the national wetland assessment symposium, ed. J. Kusler and P.
Riexinger. Berne, NY: Association of Wetland Managers, 108−118.
Hruby, T., W. R. Cesaneck, and K. E. Miller. 1995. Estimating relative wetland values for
regional planning. Wetlands 15(2):93−107.
Ji, W., J. Ma, R. A. Wahab, and K. Underhill. 2006. Characterizing urban sprawl using multi-
stage remote sensing images and landscape metrics. Computers, Environment and
Urban Systems 30:861−879.
Ji, W., and J. B. Johnston. 1994. A GIS-based decision support system for wetland permit
analysis. GIS/LIS’94 Proceedings. Bethesda: ACSM-ASPRS-AAG-URISA-AM/FM,
1994. 1:470–475.
Ji, W., and J. B. Johnston. 1995. Coastal ecosystem decision support GIS: Functions and meth-
odology. Marine & Coastal GIS issue (Ronxing Li, ed.), Marine Geodesy, 18(3):229
−241.
Ji, W., and L. C. Mitchell. 1995. An analytical model-based decision support GIS for wet
-
land resource management. In Wetland and environmental applications of geographic
information systems, ed. John Lyon and Jack McCarthy. Boca Raton, FL: Lewis Pub-
lishers, 31−45.
Karr, J. R. 1997. Measuring biological integrity. Essay 14A. In Principles of conservation biol-
ogy, 2nd ed., ed. G. K. Meffe and G. R. Carroll. Sunderland, MA: Sinauer, 483−485.
Karr, J. R., and E. W. Chu. 1998. Restoring life in running waters: Better biological monitor-
ing. Covelo, CA: Island Press.
© 2008 by Taylor & Francis Group, LLC
230 Wetland and Water Resource Modeling and Assessment
Magee, D. W. 1998. A rapid procedure for assessing wetland functional capacity based on
hydrogeomorphic classication. Bedford, NH: Normandeau Associates (available
from the Association of State Wetland Managers, Berne, NY).
Maidment, D., and D. Djokic. 2000. Hydrologic and hydraulic modeling support: With geo-
graphic information systems. Redlands, CA: ESRI Press.
Mitsch, W. J., and J. G. Gosselink. 2000. Wetland, 3
rd
ed. New York: John Wiley & Sons.
Sharitz, R. R., and D. P. Batzer. 1999. An introduction to freshwater wetlands in North Amer-
ican and their invertebrates. In Invertebrates in freshwater wetlands of North America:
Ecology and management, ed. D. P. Batzer, R. B. Rader, and S. A. Wissinger. New
York: Wiley, 1−22.
Sousa, P. J. 1985. Habitat suitability index models: Red spotted newt. U.S. Fish and Wild-
life Service, Biological Report 82 (10.111). Washington, DC: U.S. Fish and Wildlife
Service.
Stein, E. D. 1998. A rapid impact assessment method for use in a regulatory context. Wet-
lands 18(3):379−392.
Tran, L. T., C. G. Knight, B. V. O’Neill, E. R. Smith, K. H. Riitters, and J. Wickham. 2002.
Fuzzy decision analysis for integrated environmental vulnerability assessment of the
mid-Atlantic region. Environmental Management 29(6):845−859.
U.S. Army Corps of Engineers (USACOE). 1997. National action plan to implement the hydrogeo-
morphic approach to assessing wetland functions. Federal Register 62(119):33607−33620.
U.S. Environmental Protection Agency (USEPA). 2002. Index of watershed indicators: An
overview. Ofce of Wetlands, Oceans, and Watersheds. 38.
U.S. Fish and Wildlife Service (USFWS). 1980. Habitat evaluation procedure (HEP) manual
(102 ESM). Washington, DC: U.S. Fish and Wildlife Service.
U.S. National Research Council. 2002. Committee on Missouri River Ecosystem Science.
The Missouri River ecosystem: Exploring the prospects for recovery. National Acad-
emy Press, Washington, D.C.
Zampella, R. A., et al. 1994. A watershed-based wetland assessment method for the New
Jersey pinelands. New Lisbon, NJ: Pinelands Commission.
© 2008 by Taylor & Francis Group, LLC