báo cáo hóa học: " Identification of symptom domains in ulcerative colitis that occur frequently during flares and are responsive to changes in disease activity" ppt
Bạn đang xem bản rút gọn của tài liệu. Xem và tải ngay bản đầy đủ của tài liệu tại đây (1.6 MB, 12 trang )
BioMed Central
Page 1 of 12
(page number not for citation purposes)
Health and Quality of Life Outcomes
Open Access
Research
Identification of symptom domains in ulcerative colitis that occur
frequently during flares and are responsive to changes in disease
activity
Joel C Joyce
1
, Akbar K Waljee
2
, Tahira Khan
2
, Patricia A Wren
3
,
Maneesh Dave
4
, Ellen M Zimmermann
2
, Sijian Wang
5
, Ji Zhu
5
and
Peter DR Higgins*
2
Address:
1
Medical School, University of Michigan, Ann Arbor, MI, USA,
2
Division of Gastroenterology, Department of Internal Medicine,
University of Michigan, Ann Arbor, MI, USA,
3
School of Health Sciences, Oakland University, Rochester, MI, USA,
4
School of Public Health,
University of Michigan, Ann Arbor, MI, USA and
5
Department of Statistics, University of Michigan, Ann Arbor, MI, USA
Email: Joel C Joyce - ; Akbar K Waljee - ; Tahira Khan - ;
Patricia A Wren - ; Maneesh Dave - ; Ellen M Zimmermann - ;
Sijian Wang - ; Ji Zhu - ; Peter DR Higgins* -
* Corresponding author
Abstract
Background: Ulcerative colitis disease activity is determined by measuring symptoms and signs.
Our aim was to determine which symptom domains are frequent and responsive to change in the
evaluation of disease activity, which are those defined by three criteria: 1) they occur frequently
during flares; 2) they improve during effective therapy for ulcerative colitis; and 3) they resolve
during remission.
Methods: Twenty-eight symptom domains, 16 from standard indices and 12 novel domains
identified by ulcerative colitis patient focus groups, were evaluated. Sixty subjects with ulcerative
colitis were surveyed, rating each symptom on the three criteria with a 100 mm Visual Analogue
Scale. Frequent and responsive symptoms were defined a priori as those whose median Visual
Analogue Scale rating for all 3 criteria was significantly greater than 50.
Results: Thirteen of the 28 symptom domains were identified as both frequent in ulcerative colitis
flares and responsive to changes in disease activity. Seven of these 13 symptom domains were novel
symptoms derived from ulcerative colitis patient focus groups including stool mucus, tenesmus,
fatigue, rapid postprandial bowel movements, and inability to differentiate liquid or gas from solid
stool when rectal urgency occurs. Ten of the 16 symptom domains from standard indices were
either infrequent or unresponsive to changes in disease activity.
Conclusion: Only some of the symptoms of ulcerative colitis that are important to patients are
included in standard indices, and several symptoms currently measured are not frequent or
responsive to change in ulcerative colitis patients. Development of survey measures of these
symptom domains could significantly improve the assessment of disease activity in ulcerative colitis.
Published: 20 September 2008
Health and Quality of Life Outcomes 2008, 6:69 doi:10.1186/1477-7525-6-69
Received: 7 May 2008
Accepted: 20 September 2008
This article is available from: />© 2008 Joyce et al; licensee BioMed Central Ltd.
This is an Open Access article distributed under the terms of the Creative Commons Attribution License ( />),
which permits unrestricted use, distribution, and reproduction in any medium, provided the original work is properly cited.
Health and Quality of Life Outcomes 2008, 6:69 />Page 2 of 12
(page number not for citation purposes)
Background
Ulcerative colitis (UC) is a chronic inflammatory disease
that affects more than 600,000 Americans [1]. Controlling
inflammation and therefore symptoms are the primary
goals of treatment, but current therapies are only moder-
ately effective, as several population-based studies have
demonstrated that patients with UC have a 9–24% ten
year colectomy rate [2-4] and a 33–45% twenty-five year
cumulative colectomy rate [5,6]. Many potential new ther-
apies for ulcerative colitis are currently being developed in
preclinical testing and clinical trials, including molecules
targeting interleukin 12, interleukin 17, and endothelial
integrins.
The efficacy of UC therapies in clinical trials is assessed
with disease activity indices that typically combine clini-
cal symptoms, physician assessment, and endoscopy to
measure severity [7,8]. A large number of indices have
been developed over the past 50 years that attempt to
measure disease activity in ulcerative colitis, recently sum-
marized and reviewed in D'Haens et al [9]. These include
the Mayo Index [7], the UCDAI [8], the Seo Index [10], the
Ulcerative Colitis Clinical Score [11], the Simple Clinical
Colitis Activity Index [12], and the St. Mark's Index [13].
However, D'Haens et al notes that there has been "consid-
erable heterogeneity and confusion regarding the optimal
instruments (activity indices) and end points for assessing
the efficacy of medical therapies for UC" and that "an
'optimal' scoring index for UC is still to be developed" [9].
In addition, the European Crohn's and Colitis Organiza-
tion (ECCO) Consensus on UC recently stated that
"Instruments for measuring clinical and/or endoscopic
disease activity in UC are available, but none has been
subjected to an adequate validation process" [14].
Notably, it has never been established that any of these
indices actually measures all of the important compo-
nents of ulcerative colitis. Most current indices were devel-
oped without patient input and items were not tested for
their responsiveness to change. The lack of a patient-cen-
tered index raises the question of whether or not the avail-
able indices truly capture all of the symptoms that occur
during a flare for patients with UC.
Previously, we conducted focus group interviews with UC
patients who discussed their UC experience and how their
symptoms related to periods of flare or remission. We
were interested in capturing additional symptoms experi-
enced by UC patients that are not currently assessed in
commonly used indices. We recorded and qualitatively
analyzed all signs and symptoms discussed during these
group interviews and compared our findings with existing
index components [15]. We concluded that current indi-
ces capture only a portion of clinical symptoms and
include several symptoms not identified by patients. In
addition, patients identified new symptoms not previ-
ously assessed in UC disease activity indices. We believe
that current indices may not completely measure or reflect
patients' experience of UC.
The lack of a patient-centered index and the numerous
candidate therapies in developmental stages highlight the
need to develop a new UC activity index for clinical
research that is patient-centered, validated, and which will
provide a rigorous benchmark for determining the clinical
efficacy of new UC therapies. An ideal index for the meas-
urement of disease activity in UC would include the
symptom domains important to patients and would focus
on symptoms that occur in most patients and are respon-
sive to changes in disease activity (i.e., have a good
dynamic range). Symptom domains that are responsive to
changes in disease activity would reproducibly worsen
during flares, improve with effective therapy, and be
absent during remission. We chose to evaluate 16 symp-
tom domains from currently existing UC disease activity
indices as well as 12 novel symptom domains identified
in our previous focus group study [15]. All of these 28
symptom domains were identified as important by at least
one patient with ulcerative colitis in our focus groups. We
decided that we would include all 28 symptom domains
that were mentioned regardless of frequency in the focus
groups as our further validation and testing would iden-
tify those symptoms most frequent and responsive in the
experience of UC. Therefore, we aimed to determine
which symptom domains would be most useful for inclu-
sion in the development of a new patient-centered UC dis-
ease activity index by quantitatively evaluating symptom
frequency and responsiveness to change in patients with
ulcerative colitis.
Methods
Subjects
Our study was undertaken at the University of Michigan
Medical Center. On a weekly basis, the University of Mich-
igan Data Warehouse Team identified all patients with a
history of ulcerative colitis who had a scheduled outpa-
tient appointment to be seen at the University of Michi-
gan. Patients were identified as having a documented
history of UC using the ICD-9 code of 556. We also iden-
tified inpatients with UC through regular consultation
with the inpatient gastroenterology service. Recruitment
was performed face-to-face by a study team member either
in the outpatient setting (University of Michigan Gastro-
enterology Clinic or endoscopy unit) or on the hospital
inpatient service.
Inclusion criteria included age between 18 and 75 years,
diagnosis of UC as documented in the medical record,
and willingness and ability to understand and fill out the
questionnaire. Exclusion criteria included a history of
Health and Quality of Life Outcomes 2008, 6:69 />Page 3 of 12
(page number not for citation purposes)
colectomy or past participation in this study. Our study
was approved by the University of Michigan Institutional
Review Board on September 20, 2006. We obtained writ-
ten informed consent from all study participants prior to
participation.
Basic demographic and disease characteristics were col-
lected prior to distribution of the self-administered ques-
tionnaire. Disease location (proctitis, left-sided,
pancolitis, or unknown) was determined by asking the
patient if they knew the extent of their disease. Disease
extent was then verified in the medical record from either
a recent clinic note or colonoscopy report by the patient's
gastroenterologist. Disease severity (quiescent, mild,
moderate, severe, or unknown) was determined through
consultation with the patient's gastroenterologist at the
time of their participation in the study.
Questionnaire
We used a self-administered questionnaire to identify
symptom domains in UC that occur frequently during
flares and are responsive to changes in disease severity. We
defined symptom domains broadly as a symptom or sign
that could be used by the patient to assess their disease
activity level. Enrolled study participants were given the
symptom domain questionnaire to fill out and a study
team member was present to answer any questions that
arose.
The questionnaire consisted of three ratings of 28 symp-
tom domains found in UC. Sixteen of these symptom
domains were from standard UC disease activity indices
[7,8,10-12]. The remaining 12 symptom domains were
novel domains identified from focus group data [15] (Fig-
ure 1). Participants were asked to rate each of the 28
symptom domain using three separate 100 mm visual
analogue scales (VAS) for each of three endpoints: 1) the
symptom is present during flares; 2) if present during
flares, the symptom improves with effective therapy; and
3) the symptom is absent when in remission (Figure 2).
Study participants were instructed to mark with a single
line at whatever point they felt best represented their expe-
rience of that symptom domain. Study participation was
concluded upon successful completion of the survey ques-
tionnaire.
Data management and statistical analysis
Two study team members (J.C.J. and T.K.) determined
each symptom domain's rating for each of the three end-
points by independently measuring the distance in mil-
limeters from the left end of the Visual Analogue Scale (0
mm) to the point where a mark was made on the VAS line.
Measurements were made using the same ruler and to the
nearest millimeter at the point where the mark crossed the
VAS line. J.C.J. and T.K. independently entered these rat-
ings, along with demographic information, into a Micro-
soft Access (Microsoft Corporation, Redmond, WA)
database. The Access datasets were imported into Epi Info
v. 3.3.2 (Centers for Disease Control and Prevention,
Atlanta, GA) to perform error-checking. Any discrepancies
in ratings for a given symptom domain endpoint were
resolved by having J.C.J. and T.K. re-examine the original
questionnaire and re-measure the distance of the VAS rat-
ing in contention. Consensus was reached for all measure-
ments. The final, corrected Access dataset was imported
into Stata 9.2 statistical software (Stata Corporation, Col-
lege Station, TX) for analysis.
The assumption was made that study participants who
assigned a rating of less than 20 mm to the first endpoint
("the symptom is present during flares") for a given symp-
tom domain did not have that particular symptom
domain present during an active flare of their UC. There-
fore, it was not possible for these study participants to
accurately assess the second endpoint ("if present during
flares, the symptom improves with effective therapy")
since therapy would not have an affect on a symptom that
was not originally present during flare. For study partici-
pants in this situation, their rating for the second end-
point (improve with therapy) was dropped from the
dataset, regardless of its numerical value.
As the ratings for each of the three endpoints for the 28
symptom domains were found to have skewed distribu-
tions, medians and interquartile ranges were calculated
for all symptom domains for each endpoint for accurate
comparison. We also performed a nonparametric sign test
to determine if the medians for the endpoints were signif-
icantly greater than a cut-off of 50 mm on the Visual Ana-
logue Scale. A two-sided p-value of < 0.05 was used to
determine statistical significance for this test. We defined
a frequent and responsive symptom domain as one in
which ratings for all three VAS endpoints for that symp-
tom domain are significantly (two-sided p < 0.05) greater
than 50 mm (as diagrammed in Figure 1). Symptom
domains in which any of the three endpoints were not sig-
nificantly greater than 50 mm did not meet our criteria of
a frequent and responsive symptom domain.
We expected that some symptom domains would cluster
together, and might be highly correlated. In order to iden-
tify these clusters, we performed a cluster analysis and
used a dendrogram to present all symptoms domains to
show the correlations between the various symptom
domains.
While the multiple comparisons of the 84 planned sign
tests with an alpha of 0.05 would be expected to identify
approximately 4 positive results (1/20) by chance, the
probability of this occurring by chance in all 3 ratings of a
Health and Quality of Life Outcomes 2008, 6:69 />Page 4 of 12
(page number not for citation purposes)
single endpoint is 1/(20*20*20), or 1/8000. Therefore,
we chose not to use an adjustment for multiple compari-
sons.
The required sample size was calculated on the basis of a
t test to determine if the average ratings are significantly
greater than 50 (null hypothesis). We assumed a sample
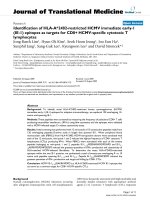
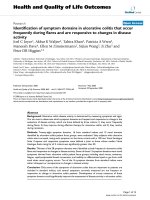
Flow diagram of 28 symptom domains in questionnaire and criteria for determining frequent and responsive symptom domainsFigure 1
Flow diagram of 28 symptom domains in questionnaire and criteria for determining frequent and responsive
symptom domains. Sixteen symptom domains were included from commonly used indices of ulcerative colitis disease activ-
ity (Truelove and Witts, St. Mark's Index, CAI, SCCAI, UCSS, Mayo, and UCDAI), and twelve novel symptom domains were
included from previously conducted focus group input [15]. The questionnaire required ratings of the three criteria listed on a
100 mm Visual Analogue Scale for each of the 28 symptom domains. Symptom domains were determined to be either frequent
and responsive or infrequent or unresponsive for evaluation of disease activity based on significance of the sign test.
Symptom Domains Obtained
from Common Disease Activity Indices
and Endorsed by Patient Focus Groups (N=16)
Frequency Eye Pain / Redness
Urgency Fever
Loose stools Anti-diarrheal use
Night bowel movements Incontinence
Abdominal pain Nausea
Anorexia Cramping
Erythema Nodosum Joint Pain
Pyoderma Gangrenosum Stool blood
Novel Symptom Domains Obtained
from UC Patient Focus Groups (N=12)
Abdominal distention Flatulence
Stool mucus Tenesmus
Lightheadedness Mouth ulcers
Fatigue Insomnia
Loud bowel sounds Low back pain
Rapid bowel movements after eating
Inability to differentiate liquid or gas from solid
when rectal urgency occurs
Evaluate 28 Symptom Domains
with 100 point Visual Analog Scale
Ratings for 3 Criteria:
1. Occurs During Flares
2. Improves with Therapy
3. Absent During Remission
Determine whether each symptom domain is important:
defined as when all 3 median VAS scores are significantly
greater than 50 ( 2 sided p > 0.05) by the sign test.
Meets Criteria Does Not Meet Criteria
Frequent and Responsive
Symptom Domains
Infrequent or Unresponsive
Symptom Domains
Health and Quality of Life Outcomes 2008, 6:69 />Page 5 of 12
(page number not for citation purposes)
mean of 60, and a standard deviation of 18 points on the
0–100 scale. With an alpha of 0.05, and a power of 80%,
this would require a sample size of 26 subjects. We con-
servatively estimated that 4 subjects might fail to com-
plete the ratings or have uninterpretable responses. As this
power calculation assumes a normal distribution, and we
expected skewed samples, we doubled the predicted sam-
ple size from 30 to 60 to account for non-normality of the
ratings.
Results
Patient characteristics
A total of 60 UC patients were enrolled for participation
in our study between October, 2006 and February, 2007.
The demographic and disease characteristics of the
enrolled study participants are presented in Table 1. The
enrolled study population represented a broad range of
the UC patient population at the investigators' university-
based institution.
Incidence of symptom domains that are frequent or
responsive
Many (17 of 28) symptom domains were found to be fre-
quently present during a UC flare, as they had a median
VAS rating greater than 50 mm for our first endpoint (Fig-
ure 3). Likewise, nearly all symptoms (27 of 28, or all
except for mouth ulcers) were shown to improve with
therapy, as they also had a median VAS rating greater than
50 mm for the second endpoint (Figure 4). In addition, all
28 symptom domains were found to be absent in remis-
sion the majority of the time in most individuals (median
VAS rating greater than 50 mm for the third endpoint)
(Figure 8). However, our criteria for defining a frequent
and responsive symptom domain specifically stated that
all three endpoints for a particular symptom domain had
to have a median VAS rating that was significantly (p <
0.05) greater than 50 mm.
It is important to note that the decision to use 50 as the
cutoff for a significant VAS rating is arbitrary. Close exam-
ination of Figure 4 reveals that several symptoms barely
achieve this cutoff. If more stringent cutoffs, represented
by the dashed lines at 60 and 80 points on the VAS, this
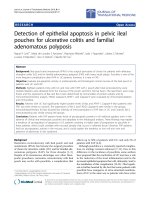
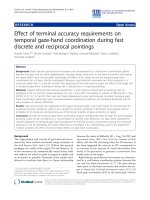
Visual analogue scale used on questionnaire for assessing each of three endpoints for all 28 symptom domainsFigure 2
Visual analogue scale used on questionnaire for assessing each of three endpoints for all 28 symptom domains.
An example of the 100 mm Visual Analogue Scales (VAS) used in the questionnaire to rate the three criteria for each of the 28
symptom domains.
Health and Quality of Life Outcomes 2008, 6:69 />Page 6 of 12
(page number not for citation purposes)
would exclude 2 or 21 symptoms from further considera-
tion in the development of a UC activity index.
Symptoms domains that are frequent and responsive to
change
Thirteen of the 28 symptom domains fulfilled the criteria
of a frequent and responsive symptom domain, defined as
a median VAS rating for all three endpoints significantly
(p < 0.05) greater than 50 mm (left half of Table 2).
Approximately half (6 of 13) of the frequent and respon-
sive symptom domains were derived from standard indi-
ces of UC disease activity (upper left quadrant of Table 2).
However, the remaining frequent and responsive symp-
tom domains (7 of 13, 54%) were novel symptom
domains elicited from previously conducted focus groups
[15] that were not found in standard UC indices. These
seven symptom domains are listed in the lower left quad-
rant of Table 2.
To illustrate the results for a representative frequent and
responsive symptom domain, the findings for the symp-
tom domain stool mucus are presented in Figure 6. In this
symptom domain, 48 of 60 individuals had a VAS rating
greater than 50 mm for the first endpoint ("present during
flare"), 46 of 53 individuals had a VAS rating greater than
50 mm for the second endpoint ("improved with ther-
apy"), and 56 of 60 had a VAS rating of greater than 50
mm for the third endpoint ("absent in remission"). In the
case of the second endpoint for stool mucus, seven indi-
viduals were not included because their ratings for first
endpoint were less than 20 mm (thus the symptom did
not frequently occur in these patients – see Methods). As
the median VAS rating for each of the three endpoints of
the symptom domain stool mucus were all greater than 50
mm, this is a representative example of a symptom
domain that fulfilled our criteria of an frequent and
responsive symptom domain (frequently present and
responsive to change).
Infrequent or unresponsive symptom domains
Fifteen of the 28 symptom domains did not fulfill the cri-
teria. These symptom domains are listed in the right half
Table 1: Demographics and disease characteristics of patients in the study
Characteristics Participants (n = 60) %
Gender
Male 31 51.7
Female 29 48.3
Median [range] age (years) 39.4 [18.6–72.8]
NIH Race
Caucasian 54 90.0
Asian or Pacific Islander 0 0.0
Black 3 5.0
American Indian/Alaskan 1 1.7
Hispanic 1 1.7
Other 1 1.7
Median [range] disease duration (years) 5.0 [1–37]
1 missing
Disease location
Proctitis 4 6.7
Left-sided 26 43.3
Pancolitis 28 46.7
Unknown 2 3.3
Disease Severity
Quiescent 3 5.0
Mild 24 40.0
Moderate 19 31.7
Severe 13 21.7
Unknown 1 1.7
Medications
Current rectal therapy 14 of 60 23.3
Current steroids 24 of 60 40.0
Current oral 5-ASA's 51 of 60 85.0
Current thiopurines 15 of 60 25.0
Current infliximab 4 of 60 6.7
Inpatient status
Yes 8 13.3
No 52 86.7
Health and Quality of Life Outcomes 2008, 6:69 />Page 7 of 12
(page number not for citation purposes)
of Table 2. Noteworthy among these were 10 symptom
domains commonly found in standard UC disease activity
indices but are infrequent symptoms domains in our
study (upper right quadrant of Table 2).
Anorexia was an example of a symptom domain that did
not fulfill this study's criteria. In the case of the symptom
domain anorexia, 34 of 60 individuals had a VAS rating
greater than 50 mm for the first endpoint ("present during
flare"), 39 of 47 individuals had a VAS rating greater than
50 mm for the second endpoint ("improved with ther-
apy"), and 55 of 60 individuals had a VAS rating of greater
than 50 mm for the third endpoint ("absent in remis-
sion") (Figure 7). As in the example with stool mucus, 13
individuals for the second endpoint in anorexia were not
included because their VAS ratings for the first endpoint in
anorexia were not greater than 20 mm (see Methods). As
the medians of the three endpoints for the symptom
domain anorexia were not all significantly greater than 50
by the sign test, this is an example of a symptom domain
found on commonly used indices that did not meet our
criteria and are thus classified as infrequent or unrespon-
sive symptom domains.
Discussion
Conventional assessment of disease activity in ulcerative
colitis is done using any one of a number of disease activ-
ity indices that measure various symptoms and signs that
have been deemed relevant by the designers of these indi-
ces. For the most part, items included in the various indi-
ces were determined solely by physician scientists without
patient input. Therefore, it is not surprising that we found
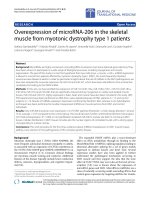
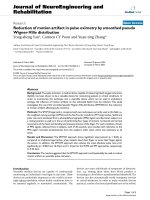
Visual analogue scale ratings of symptoms present during a flareFigure 3
Visual analogue scale ratings of symptoms present during a flare. A box plot of the VAS ratings of symptoms present
during flares for the 28 symptom domains is presented. Each box bounds the region from the 25
th
to 75
th
percentile of
responses. The vertical line in each box is the median. Lines connect the boxes to the next observation beyond the box and
the dots represent remaining outliers. The vertical line at VAS = 50 signifies the a priori cut-off rating establishing symptoms
that are frequent during flares. The symptoms presented in dark gray boxes are those that met all 3 criteria for symptom
importance. Only the 13 highest rated symptoms had VAS ratings significantly greater than 50 for presence during flares.
Health and Quality of Life Outcomes 2008, 6:69 />Page 8 of 12
(page number not for citation purposes)
that UC disease activity indices did not include all of the
symptoms that are frequent and responsive to change in
UC disease activity.
We determined that several novel symptoms identified by
UC patient focus groups qualify by our criteria as infre-
quent or unresponsive symptom domains. We also found
that while several symptoms derived from current UC dis-
ease activity indices qualify as frequent and responsive
symptom domains, many of the symptoms in current UC
disease activity indices do not qualify. The results of this
study provide us the opportunity to develop a UC disease
activity index that incorporates all of the symptom
domains that are frequently present during flares and are
responsive to changes in disease activity.
This research study had several limitations. First, the study
population was seen at a tertiary care medical center. This
population may be biased towards individuals with a
more severe UC disease course than is seen in the general
patient population. Second, we found that individuals
who did not experience a given symptom found it very
difficult to assign a VAS rating to the second endpoint,
"improves with therapy." We controlled for this using the
method outlined (excluding improvement ratings for sub-
jects who did not report frequently having the symptom
in question). Third, as we asked patients to recollect their
experience of disease flares and remissions both in the
present and past, there exists the possibility of recall bias.
Finally, it is possible that several of the symptoms that
were identified as frequent and responsive by our criteria
represent concurrent irritable bowel syndrome (IBS)
symptoms, and therefore are not directly related to IBD
disease activity. Post-inflammatory IBS symptoms have
been shown to be relatively common in patients with IBD
[16] and it is possible that IBS is part of what is being
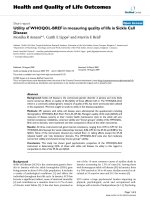
Visual analogue scale ratings of symptoms that improve during therapyFigure 4
Visual analogue scale ratings of symptoms that improve during therapy. A box plot of the VAS ratings of symptoms
is presented that improve during therapy All but the lowest-rated symptom, mouth ulcers, had VAS ratings significantly
greater than 50 for improvement during therapy. Additional more stringent cutoffs at 60 and 80 points are presented for illus-
tration.
Health and Quality of Life Outcomes 2008, 6:69 />Page 9 of 12
(page number not for citation purposes)
reported by participants in our study. Contrary to this
view is the recent report that IBS-related symptoms in
inflammatory bowel disease (IBD) correlate with
increased fecal calprotectin levels, a biomarker of inflam-
matory activity. This suggests that symptoms typically
attributed to IBS may actually indicate smoldering sub-
clinical inflammation in IBD patients [Keohane Gastro
2007]. At this point we do not wish to exclude symptoms
that may be indicative of inflammation from the evalua-
tion of UC disease activity.
In addition, it is important to note that this study was
undertaken to determine which symptom domains, as
identified in our previous focus groups of UC patients
[15], would be most valuable for inclusion in a new
patient-centered UC disease activity index. In this study,
we aimed to determine which symptom domains deserve
further investigation and validation as representative of
UC disease activity. This will be undertaken in develop-
ment of questions for assessment of disease activity based
on these frequent and responsive symptom domains and
item reduction will be done through prospective testing
and multivariate analysis. Validation of these questions
and correlation with current disease activity indices will
be undertaken in future longitudinal studies to assess for
responsiveness and correlation with activity over time.
Conclusion
The results of this study provide quantitative evidence that
a subset of the additional symptoms identified in our pre-
vious work with UC patient focus groups [15] are reason-
able choices for further development as part of a new
index to assess UC disease activity. These additional
symptoms have great value because they were identified
through patient input, which allows us to capture a com-
plete picture of disease activity in patients with ulcerative
colitis. The finding that a number of symptoms used at
this time in common UC disease activity indices are rarely
Visual analogue scale ratings of symptoms that are absent during remissionFigure 5
Visual analogue scale ratings of symptoms that are absent during remission. A box plot of the VAS ratings of symp-
toms that are absent during remission. All of the symptoms evaluated had VAS ratings significantly greater than 50 for
absence during remission.
Health and Quality of Life Outcomes 2008, 6:69 />Page 10 of 12
(page number not for citation purposes)
Table 2: Symptom domains and their frequency and responsiveness to changes in disease activity
Frequent and Responsive Symptoms (n = 13) Infrequent or Unresponsive Symptoms (n = 15)
Symptom Domains Derived from Common
Indices
Loose stools (consistency)
Stool blood
Urgency
Frequency
Nighttime bowel movements
Abdominal pain
Anorexia
Erythema nodosum
Pyoderma gangrenosum
Eye redness/pain
Fever
Use of anti-diarrheals
Incontinence
Nausea
Cramping
Joint pain
Symptom Domains Derived from Focus
Groups
Stool mucus
Tenesmus
Difficulty telling liquid or gas from solid stool
before evacuation
Rapid post-prandial bowel movements
Loud bowel sounds
Flatulence
Fatigue
Abdominal distension
Light-headedness
Mouth ulcers
Insomnia
Low back pain
Example of a symptom domain that meets a frequent symptom with good dynamic rangeFigure 6
Example of a symptom domain that meets a frequent symptom with good dynamic range. A dot plot of a symp-
tom domain (stool mucus) that meets criteria for a frequent and responsive symptom (one that is frequent with good dynamic
range). VAS ratings are from the 100 mm scale. Each dot represents one individual's response. The horizontal lines on the
graphs are as follows: 25 is the 25
th
percentile, M is the median, and 75 is the 75
th
percentile. The horizontal line at VAS = 50
signifies the a priori cut-off rating for frequent and responsive symptoms.
Health and Quality of Life Outcomes 2008, 6:69 />Page 11 of 12
(page number not for citation purposes)
Example of a symptom domain that did not meet criteria for a frequent symptom with good dynamic rangeFigure 7
Example of a symptom domain that did not meet criteria for a frequent symptom with good dynamic range.
Dot plot of a symptom domain (anorexia) that did not meet the criteria for a frequent and responsive symptom. VAS ratings
are from the 100 mm scale. Each dot represents one individual's response. The horizontal lines on the graphs are as follows: 25
is the 25
th
percentile, M is the median, and 75 is the 75
th
percentile. The horizontal line at VAS = 50 signifies the a priori cut-off
rating for frequent and responsive symptoms.
Cluster analysis of symptom domainsFigure 8
Cluster analysis of symptom domains. Using single clustering, a dendrogram of the 28 symptom domains is presented to
illustrate the likely redundancy in some items, and the potential for item reduction in future development of a UC activity
index.
ï
5DSLGSRVWïSUDQGLDO%
$QWLïGLDUUKHDOXVH
Publish with BioMed Central and every
scientist can read your work free of charge
"BioMed Central will be the most significant development for
disseminating the results of biomedical researc h in our lifetime."
Sir Paul Nurse, Cancer Research UK
Your research papers will be:
available free of charge to the entire biomedical community
peer reviewed and published immediately upon acceptance
cited in PubMed and archived on PubMed Central
yours — you keep the copyright
Submit your manuscript here:
/>BioMedcentral
Health and Quality of Life Outcomes 2008, 6:69 />Page 12 of 12
(page number not for citation purposes)
present in UC flares and/or are less responsive to change
furthers the point that by using existing measures we may
not be optimally assessing a patient's UC activity. We
expect that the future combination of improved survey
questions for UC activity assessment and biomarkers of
UC inflammation will result in better assessment of dis-
ease activity and therefore better care for patients than is
possible with currently available indices.
Competing interests
The authors declare that they have no competing interests.
Authors' contributions
JCJ and AKW: conducted the study, analyzed and inter-
preted the data, and wrote the text of the article; TK:
assisted in designing the study, conducted the study, and
analyzed data; PAW: designed the study and contributed
to writing of the text of the article; MD: conducted the
study; EMZ: participated in study design and reviewed the
text; SW and JZ: assisted in statistical design and interpre-
tation of data; and PDRH: originated the idea for the
study, designed the study, interpreted the data, contrib-
uted to writing of the text, and guaranteed the work. All
authors have read and approved the final manuscript.
Acknowledgements
We thank the patients for their participation. This research was presented
at Digestive Disease Week in Washington, D.C., in May 2007.
JCJ was supported by a medical student clinical research grant from the
National Center for Research Resources, National Institutes of Health
(M01-RR000042). PDRH was supported by the Crohn's and Colitis Foun-
dation of America Senior Research Award.
References
1. Loftus EV Jr: Clinical epidemiology of inflammatory bowel dis-
ease: Incidence, prevalence, and environmental influences.
Gastroenterology 2004, 126(6):1504-17.
2. Langholz E, et al.: Course of ulcerative colitis: analysis of
changes in disease activity over years. Gastroenterology 1994,
107(1):3-11.
3. Jess T, et al.: Changes in clinical characteristics, course, and
prognosis of inflammatory bowel disease during the last 5
decades: a population-based study from Copenhagen, Den-
mark. Inflamm Bowel Dis 2007, 13(4):481-9.
4. Hoie O, et al.: Low colectomy rates in ulcerative colitis in an
unselected European cohort followed for 10 years. Gastroen-
terology 2007, 132(2):507-15.
5. Nguyen GC, et al.: Racial and geographic variations in colec-
tomy rates among hospitalized ulcerative colitis patients.
Clin Gastroenterol Hepatol 2006, 4(12):1507-1513.
6. Leijonmarck CE, Persson PG, Hellers G: Factors affecting colec-
tomy rate in ulcerative colitis: an epidemiologic study. Gut
1990, 31(3):329-33.
7. Schroeder KW, Tremaine WJ, Ilstrup DM: Coated oral 5-ami-
nosalicylic acid therapy for mildly to moderately active
ulcerative colitis. A randomized study. N Engl J Med 1987,
317(26):1625-9.
8. Sutherland LR, et al.: 5-Aminosalicylic acid enema in the treat-
ment of distal ulcerative colitis, proctosigmoiditis, and proc-
titis. Gastroenterology 1987, 92(6):1894-8.
9. D'Haens G, et al.: A review of activity indices and efficacy end
points for clinical trials of medical therapy in adults with
ulcerative colitis. Gastroenterology 2007, 132(2):763-86.
10. Seo M, et al.
: An index of disease activity in patients with ulcer-
ative colitis. Am J Gastroenterol 1992, 87(8):971-6.
11. Feagan BG, et al.: Treatment of ulcerative colitis with a human-
ized antibody to the alpha4beta7 integrin. N Engl J Med 2005,
352(24):2499-507.
12. Walmsley RS, et al.: A simple clinical colitis activity index. Gut
1998, 43(1):29-32.
13. Powell-Tuck J, Bown RL, Lennard-Jones JE: A comparison of oral
prednisolone given as single or multiple daily doses for active
proctocolitis. Scand J Gastroenterol 1978, 13(7):833-7.
14. Stange EF, et al.: European evidence-based Consensus on the
diagnosis and management of ulcerative colitis: Definitions
and diagnosis. Journal of Crohn's and Colitis 2008, 2(1):1-23.
15. Waljee A, et al.: Do Currently Available Disease Activity Indi-
ces Measure the Symptoms that Ulcerative Colitis Patients
Experience During A Flare? Gastroenterology 2007, 132(4):44.
(A191)
16. Minderhoud IM, et al.: IBS-like symptoms in patients with
inflammatory bowel disease in remission; relationships with
quality of life and coping behavior. Dig Dis Sci 2004,
49(3):469-74.