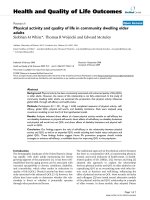
báo cáo hóa học: " Physical activity as a mediator of the impact of chronic conditions on quality of life in older adults" pptx
Bạn đang xem bản rút gọn của tài liệu. Xem và tải ngay bản đầy đủ của tài liệu tại đây (330.8 KB, 11 trang )
Health and Quality of Life Outcomes
BioMed Central
Open Access
Research
Physical activity as a mediator of the impact of chronic conditions
on quality of life in older adults
Richard Sawatzky*1, Teresa Liu-Ambrose2, William C Miller3,4 and
Carlo A Marra5,6
Address: 1Nursing Department, Trinity Western University, 7600 Langley, British Columbia, V2Y 1Y1, Canada, 2Department of Physical Therapy,
University of British Columbia, T325 2211 Wesbrook Mall, Vancouver, British Columbia, V6T 2B5, Canada, 3Department of Occupational Science
and Occupational Therapy, University of British Columbia, T325 2211 Wesbrook Mall, Vancouver, British Columbia, V6T 2B5, Canada, 4GF
Strong Rehabilitation Research Laboratory, University of British Columbia, T325 2211 Wesbrook Mall, Vancouver, British Columbia, V6T 2B5,
Canada, 5Faculty of Pharmaceutical Sciences, University of British Columbia, 2146 East Mall, Vancouver, British Columbia, V6T 1Z3, Canada and
6Centre for Health Evaluation and Outcomes Sciences, Providence Health Care, St Paul's Hospital, 620B 1081 Burrard Street, Vancouver, B.C., V6Z
1Y6, Canada
Email: Richard Sawatzky* - ; Teresa Liu-Ambrose - ; William C Miller - ;
Carlo A Marra -
* Corresponding author
Published: 19 December 2007
Health and Quality of Life Outcomes 2007, 5:68
doi:10.1186/1477-7525-5-68
Received: 29 September 2007
Accepted: 19 December 2007
This article is available from: />© 2007 Sawatzky et al; licensee BioMed Central Ltd.
This is an Open Access article distributed under the terms of the Creative Commons Attribution License ( />which permits unrestricted use, distribution, and reproduction in any medium, provided the original work is properly cited.
Abstract
Background: Chronic conditions could negatively affect the quality of life of older adults. This may be partially due to
a relative lack of physical activity. We examined whether physical activity mediates the relationship between different
chronic conditions and several health outcomes that are important to the quality of life of older adults.
Methods: The data were taken from the Canadian Community Health Survey (cycle 1.1), a cross-section survey
completed in 2001. Only respondents who were 65 years or older were included in our study (N = 22,432). The Health
Utilities Index Mark 3 (HUI3) was used to measure overall quality of life, and to measure selected health outcomes
(dexterity, mobility, pain, cognition, and emotional wellbeing) that are considered to be of importance to the quality of
life of older adults. Leisure-time physical activity was assessed by determining weekly energy expenditure (Kcal per week)
based on the metabolic equivalents of self-reported leisure activities. Linear and logistic regression models were used to
determine the mediating effect of leisure-time physical activity while controlling for demographic variables (age and sex),
substance use (tobacco use and alcohol consumption), and obesity.
Results: Having a chronic condition was associated with a relative decrease in health utility scores and a relative increase
in mobility limitations, dexterity problems, pain, emotional problems (i.e., decreased happiness), and cognitive limitations.
These negative consequences could be partially attributed to a relative lack of physical activity in older adults with a
chronic condition (14% mediation for the HUI3 score). The corresponding degree of mediation was 18% for mobility
limitations, 5% for pain, and 13% for emotional wellbeing (statistically significant mediation was not observed for the
other health attributes). These values varied with respect to the different chronic conditions examined in our study.
Conclusion: Older adults with chronic conditions are less likely to engage in leisure-time physical activities of at least
1,000 Kcal per week, and this association partially accounts for some negative consequences of chronic conditions,
including mobility limitations, pain, and emotional problems. These findings provide support for health promotion
programs that facilitate or encourage increased leisure-time physical activity in older people with chronic conditions.
Page 1 of 11
(page number not for citation purposes)
Health and Quality of Life Outcomes 2007, 5:68
Background
A chronic condition can be defined as a medical condition
that is slow in its progress and long in its continuance.
More than 80% of Canadians aged 65 and older report
having at least one chronic condition [1]. Chronic conditions contribute to disability via physical impairments
and functional limitations and consequently diminish
quality of life in older adults. In older adults, chronic conditions have been associated with an increased risk for a
variety of secondary health issues including medical conditions, such as disuse osteoporosis concomitant to sustaining a stroke, and psychosocial challenges, such as
those related to depression and pain [2-4]. Chronic conditions also increase the costs of health care and long-term
care [5]. Thus, the increased prevalence of chronic conditions in the aging population poses a significant challenge
to society and the health care system.
/>
The analytical objectives for this study are to: 1) examine
the degree to which the negative impact of chronic conditions on quality of life and various important health outcomes (e.g., emotional problems, mobility limitations,
pain, emotional wellbeing, and cognitive limitations) in
older adults could be attributed to a lack of physical activity; and 2) examine whether the hypothesized mediating
effect of physical activity is consistent with respect to some
of the most prevalent chronic conditions in older adults
(including musculoskeletal disorders, cardiovascular disorders, respiratory disorders, diabetes, urinary or bowel
disorders, and strokes). We specifically hypothesized that
those older adults who have a chronic condition but who
maintained the recommended amount of physically activity of 1,000 Kcal per week would experience better health
outcomes than those who are physically inactive.
Methods
Physical activity is a proven but remarkably underused
health promotion modality [6]. Evidence has shown that
regular physical activity contributes to healthy aging by
preventing disability, morbidity, and mortality in older
adults [7]. It has been demonstrated that physical activity
decreases the likelihood of dying with disability almost
two-fold when comparing those most physically active to
those who were sedentary [8]. A graded, inverse relationship between total physical activity and mortality has
been identified [9]. Regular physical activity can modify
the severity or the progression of chronic conditions,
thereby reducing both morbidity and mortality associated
with chronic conditions [7]. Physical activity has various
psychological and social benefits. For example, studies
have shown that exercise alleviates depression [10], and
provides additional therapeutic benefits beyond those
resulting from psychotherapy [11] and the use of psychotropic medications [12,13]. Despite its many benefits,
physical activity participation declines progressively with
age [14], particularly among older adults who have
chronic conditions.
The data were obtained from the Canadian Community
Health Survey (CCHS) cycle 1.1 (Statistics Canada): a
multi-cycle cross-sectional health survey of the Canadian
population that contains information about chronic conditions, various health outcomes, health resource utilization, socio-demographics, and physical activity [17]. The
sampling strategy included a stratified cluster design (83%
of total sample) to obtain proportional geographic and
socio-economic representation of dwelling units across
the 136 health regions in Canada. This sampling strategy
was supplemented with a random digit dialing approach
(10% of total sample) and a list frame of telephone numbers (7% of the total sample). This resulted in a total sample of 130,880 respondents who were all contacted by
telephone to complete the survey. The national nonresponse rate was estimated at 20.0% [17]. People living
in Indian Reserves, the Canadian Forces Bases, some
remote areas, and people who did not dwell in a household as defined by Statistics Canada were not included.
For this study, we utilized the data from respondents aged
65 years and older (N = 24,281).
Studies have demonstrated that physical activity can
improve quality of life in adults with chronic conditions
[15,16]. These associations have typically been examined
with respect to a particular chronic condition, such as
arthritis. However, it is unclear to what degree the negative impact of chronic conditions on quality of life and
important health outcomes in older adults can be attributed to a lack of physical activity. It is also unclear whether
this hypothesized mediating effect of physical activity is
consistent with respect to different chronic conditions.
This information is vital to understanding the role of
physical activity in promoting quality of life in older
adults.
The data were collected by Statistics Canada under the
authority of the Statistics Act. Access to the data was
granted by Statistics Canada based on a peer-reviewed
proposal for this study. The researchers did not have
access to any identifying information so that anonymity
of the respondents was protected. The opinions expressed
here do not represent the views of Statistics Canada.
Classification of chronic conditions
The respondents were asked to indicate whether they had
a disease or another health condition diagnosed by a
health professional that had lasted, or was expected to
last, 6 months or more. These data were used to classify
the older adults into the following overlapping groups
based on those chronic conditions that are similar with
Page 2 of 11
(page number not for citation purposes)
Health and Quality of Life Outcomes 2007, 5:68
/>
respect to the predominant body systems involved: 1) respiratory disorders (asthma, chronic bronchitis, emphysema or chronic obstructive pulmonary disease), 2)
musculoskeletal disorders (arthritis, fibromyalgia or back
problems), 3) cardiovascular disorders (high blood pressure or heart disease), 4) diabetes, 5) urinary or bowel
problems (urinary incontinence, Crohn's disease or colitis), and 6) those who were "suffering the effects of a
stroke". Older adults with cancer, Alzheimer's disease or
another form of dementia, Parkinson's disease, or multiple sclerosis were also included in our analyses. However,
older adults who did not have any of the above chronic
conditions but who did report having another chronic
condition were not included (n = 1,809). Some chronic
conditions, such as food or other allergies, cataracts, glaucoma, and thyroid conditions were not considered
because their impact on quality of life, as measured by the
Health Utilities Index [18], has previously shown to be
indiscernible or mild in older adults [19]. Migraine headaches and epilepsy were not considered because their sporadic nature did not lend itself well to a cross-sectional
analysis. We first compared the older adults who had one
or more of the selected chronic conditions (n = 19,475) to
those who reported having no chronic condition (n =
2,957), and we subsequently repeated these analyses for
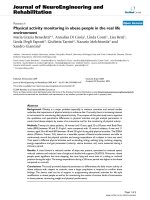
each of the above chronic condition groups (see Figure 1;
No chronic condition
(n = 2,957)
the corresponding sample sizes for the chronic condition
groups after listwise deletion are shown in Table 1).
Dependent variables
The dependent variables of interest were various health
outcomes that are generally considered to be of importance to quality of life. The Health Utility Index Mark 3
(HUI3) [18,20,21] was used in the CCHS for the measurement of these health outcomes. This instrument consists
of 31 questions pertaining to eight health attributes that
represent limitations associated with hearing, vision,
speech, cognition, mobility, dexterity, pain, and emotional wellbeing (happiness). Utility weights for several
health states were derived from the preferences obtained
from a community sample of 504 adults in the city of
Hamilton, Ontario, Canada [22]. Multi-attribute theory
was used to calculate a total health utility score that can
range from – 0.36 ("most disabled") to 1.00 ("perfect
health") [22].
The HUI3 was also used to examine the impact of chronic
conditions and physical activity on several distinct health
attributes (including cognition, mobility, dexterity, pain
and emotional wellbeing). The guidelines provided by the
instrument developers were followed to concatenate the
HUI3 questions to obtain ordinal summary scores for
Reference group in all analyses.
Musculoskeletal disorders (n = 12,858): arthritis or
rheumatism, fibromyalgia, or back problems.
Respiratory disorders (n = 3,106): asthma, chronic
bronchitis, COPD.
One or more selected
chronic conditions1
(n = 19,475)
Cardiovascular disorders (n = 12,030): high blood
pressure or heart disease.
Diabetes (n = 3,135).
Urinary or bowel problems (n = 2,790): urinary
S
One or more other chronic
conditions2 (n = 1,809) or
missing response (n = 40)
n = 1,139).
Excluded from all analyses (n = 1,849).
Figure 1
Classification of chronic conditions in the sample of older adults
Classification of chronic conditions in the sample of older adults. Notes:N = 24,281.
1 The following selected chronic conditions were included: asthma, fibromyalgia, arthritis or rheumatism, back problems, high blood pressure, chronic
bronchitis, emphysema or chronic obstructive pulmonary disease (COPD), diabetes, heart disease, cancer, stroke, urinary incontinence, Crohn's disease
or colitis, Alzheimer's disease or other dementia, Parkinson's disease, multiple sclerosis.
2 Excluded from all analyses were older adults who did not have any of the above chronic conditions but who did report having food or other allergies,
migraine headaches, epilepsy, stomach or intestinal ulcers, cataracts, glaucoma, a thyroid condition, chronic fatigue syndrome, chemical sensitivities, or any
other long-term chronic condition diagnosed by a health care professional.
Page 3 of 11
(page number not for citation purposes)
Health and Quality of Life Outcomes 2007, 5:68
/>
Table 1: Description of the chronic condition groups
Chronic condition groups
Category
Activity
≥ 1,000 Kcal/week
Age
65 – 74 yrs
75 – 79 yrs
> 84 yrs
Sex
Female
Smoking
Yes
Alcohol use
Does not use
alcohol
< 2 times/month
2 to 3 times/month
> 3 times/month
Obesity
BMI < 18.5
BMI 18.5 – 25
BMI ≥ 25
No chronic
condition
(n = 2,639)
One or more
Chronic
conditions
(n = 17,314)
Respiratory
disorders
(n = 2,722)
Musculo- skeletal
disorders
(n = 11,473)
Cardio- vascular
disorders
(n = 10,741)
Diabetes
(n = 2,754)
Urinary or
bowel disorders
(n = 2,399)
Stroke
(n = 894)
35.1%
25.8%
20.7%
24.8%
24.7%
24.3%
20.0%
17.2%
69.7%
17.1%
13.2%
58.3%
21.2%
20.5%
58.1%
22.2%
19.7%
57.4%
21.3%
21.3%
56.3%
22.5%
21.2%
61.2%
21.8%
17.0%
48.9%
21.9%
29.2%
43.1%
26.4%
30.5%
46.2%
59.6%
56.9%
65.0%
59.1%
50.8%
68.3%
50.7%
16.7%
11.6%
15.6%
11.8%
10.1%
9.0%
11.6%
11.5%
28.0%
34.4%
37.8%
34.5%
36.0%
47.1%
37.2%
44.8%
18.2%
14.4%
39.4%
21.7%
12.9%
31.0%
20.3%
11.9%
30.1%
22.3%
12.8%
30.4%
21.7%
12.8%
29.5%
21.7%
10.3%
21.0%
24.6%
12.5%
25.7%
19.8%
10.8%
24.7%
55.6%
2.8%
41.7%
42.5%
3.1%
54.4%
42.3%
4.4%
53.4%
40.6%
3.1%
56.2%
39.7%
2.6%
57.8%
30.9%
1.2%
67.9%
41.8%
3.3%
55.0%
46.2%
4.8%
49.0%
Notes: N = 19,953, including those older adults who had no chronic conditions or who had one of the selected chronic conditions and for whom there
was no missing data for any of the variables in our analyses.
these attributes. The resulting ordinal variables were collapsed into dichotomous variables as shown in Table 2.
Independent variables
The respondents were asked about the frequency and
amount of time that they engaged in physical leisure activities over the past three months (e.g., specific sports, gardening, exercise classes, etc.). A score for leisure-time
physical activity was obtained by calculating weekly
energy expenditure (kilocalories (Kcal) per week) based
on the metabolic equivalents for each of the self-reported
leisure activities [23]. We used the guidelines provided in
the US Surgeon General's 1996 report as the basis for collapsing this variable so as to specifically compare those
who had an energy expenditure of less than 1,000 Kcal per
week to those who met the minimally recommended
1,000 Kcal of weekly energy expenditure [24].
Tobacco use, alcohol consumption, and obesity were
included as additional health-related covariates in our
analyses. Older adults who reported smoking daily or
occasionally at the time of the survey were compared to
those who did not smoke. Alcohol consumption was
assessed based on responses to the question "During the
past 12 months, how often did you drink alcoholic beverages?" This variable was collapsed into four categories: 1)
no alcohol consumption, 2) between one and three times
a month, 3) once a week, and 4) more than once a week.
The body mass index (BMI) was used to classify the older
adults as being of normal weight (BMI ≥ 18.5 and < 25),
underweight (BMI < 18.5), or overweight or obese (≥ 25).
The respondent's age and sex were included as demographic covariates.
Analytical approach
We used ordinary least squares regression to estimate the
relationships between having a chronic condition, physical activity, and the HUI3 score while controlling for the
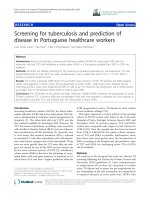
covariates mentioned above. As shown in Figure 2, the
HUI3 score was regressed on the chronic condition variable, and physical activity was specified as a mediator of
this relationship. The Pratt-Index (d) [25] was used to partition the R-square so as to determine the relative importance of the variables explaining the HUI3 score. This
index was calculated by multiplying the standardized
regression coefficients by the corresponding correlations
and dividing that value by the R-square. Thus, the PrattIndex value signifies the proportion of the R-square that is
attributable to each of the variables in the model. We subsequently used binary logistic regression to examine the
mediating effects of leisure-time physical activity independently for specific HUI3 attributes. The fit of the logistic models was assessed based on the likelihood ratio chi-
Page 4 of 11
(page number not for citation purposes)
Health and Quality of Life Outcomes 2007, 5:68
/>
Table 2: Bivariate associations among the HUI3 attributes having a chronic condition
No chronic condition
(n = 2,639)
Variable
Mobility
No difficulty walking (referent)
Difficulty walking or unable to walk
Dexterity
Full use of hands and fingers (referent)
Any limitation in the use of hands or fingers
Emotion
Happy or somewhat happy (referent)
Somewhat or very unhappy
Cognition
No cognitive limitations (referent)
Any cognitive limitations
Pain
Free of pain or discomfort (referent)
Mild, moderate, or severe pain
One or more chronic conditions
(n = 17,314)
Odds ratio1
(95% CI)
97.1%
2.9%
84.0%
16.0%
1.00
6.4 (4.7 – 8.7)
99.8%
0.2%
97.8%
2.2%
1.00
9.6 (3.7 – 24.9)
98.7%
1.3%
94.7%
5.4%
1.00
4.3 (2.7 – 6.8)
80.6%
19.4%
66.7%
33.3%
1.00
2.1 (1.8 – 2.4)
94.9%
5.1%
69.3%
30.7%
1.00
8.3 (6.2 – 11.0)
Notes: N = 19,953.
1 Bivariate logistic regression was used to calculate the confidence intervals.
square and the likelihood ratio R2 (also known as McFadden's R2) [26].
The degree of mediation was determined by calculating
the indirect effect as the product of the coefficients of the
relationships between the HUI3 attributes and physical
activity and having a chronic condition [27]. The standard
error for the indirect effect was estimated using the delta
method, which is similar to the approach of variance estimation used in the Sobel's test for mediating effects [28].
A simulation study by MacKinnon and Dwyer showed
that the delta method led to accurate estimates of indirect
effects and their standard errors when using binary data
[28]. We followed their recommendations to evaluate the
degree of mediation as the percentage of the total effect
that could be attributed to the indirect effect.
The SAS 9.1 software package [29] was used to obtain the
maximum likelihood estimates for each of the models.
The bootstrapped sampling weights provided by Statistics
Canada were used to obtain parameter estimates and their
standard errors based on 500 replications of each model.
All models were estimated using listwise deletion resulting in the exclusion of 2,479 (11.1%) respondents due to
missing responses for one or more of the analysis variables. The parameter estimates were compared to those
based on full information maximum likelihood estimation (FIML) (available in the Mplus 4.2 [30] software
package) by using all available data to assess whether the
estimates may have been biased by non-random missing
data patterns (n = 21,736; excluding 696 (3.1%) respondents who did not provide any information regarding their
HUI3 scores or any of the explanatory variable) [31,32].
Results
Chronic
condition
HUI3
attributes
Physical
activity
Covariates:
Age
Sex
BMI
Cigarette use
Alcohol consumption
Figure 2
Heuristic diagram of hypothesized relationships
Heuristic diagram of hypothesized relationships.
Sample description and bivariate associations
Most of the older adults (79%) had at least one of the
chronic conditions that were considered in our study, 8%
had a chronic condition other than the ones that were
considered in our study, and 13% had no chronic condition (Figure 1). Only 25% of the older adults achieved the
minimally recommended activity level of 1,000 Kcal per
week (64% did not achieve the recommended activity
level and 11% did not answer some or all questions about
their leisure-time physical activity). Descriptive findings
pertaining to each of the chronic condition groups are
shown in Table 1.
The distribution of the HUI3 score was negatively skewed
with a mean of 0.79 (SD = 0.25) and a median of 0.91 (N
= 19,953). With respect to specific HUI3 attributes, most
older adults reported having no limitations in cognition
Page 5 of 11
(page number not for citation purposes)
Health and Quality of Life Outcomes 2007, 5:68
/>
(69%), mobility (86%), and dexterity (98%). In addition,
73% reported having no pain, and 95% reported being
happy or somewhat happy in life.
Those who had a chronic condition had relatively lower
scores for each of the HUI3 attributes in comparison to
those who had no chronic condition (Table 2). At the
time of the survey, they were also less likely to have used
tobacco, less likely to have consumed alcohol and more
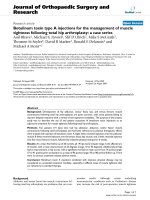
likely to be overweight (Figure 3). Fewer older adults who
had a chronic condition achieved the recommended physical activity level of 1,000 Kcal per week relative to those
older adults who did not have a chronic condition. The
corresponding odds ratio (OR) in the overall sample was
1.6 (95% CI = 1.5 – 1.8), and the ORs ranged from 1.6 to
2.6 in the chronic condition subsamples (Figure 4).
Multivariate analysis results
The F-test of model fit for the variables explaining the
total HUI3 score was statistically significant (F (11,
19,941) = 254, p < 0.01, R2 = 12%) (Table 3). The HUI3
score was predominantly explained by differences in age
(Pratt Index = 0.35), having a chronic condition (Pratt
Index = 0.28), leisure-time physical activity (Pratt Index =
0.19), and alcohol consumption (Pratt Index = 0.15).
Although the effects of the other variables were statistically significant, they only accounted for a total of 2% of
the explained variance. Relatively lower HUI3 scores were
observed for those who had a chronic condition (b = 0.13, p < 0.01), and relatively higher HUI3 scores were
observed for those who were physically active (b = 0.07, p
< 0.01) after controlling for differences in age, gender,
tobacco use, alcohol consumption, and obesity.
The relationship between having a chronic condition and
leisure-time physical activity was examined to determine
whether physical activity mediated the negative impact of
having a chronic condition on the HUI3 score. The likelihood ratio test of global model fit for variables explaining
the physical activity was statistically significant (LR χ2(10)
= 1,878.80, p < 0.01, LR R2 = 8%). Physical activity was significantly associated with differences in age, alcohol consumption, smoking status, and having a chronic
condition (last column Table 3). Thus, the negative
impact of having a chronic condition was partially mediated by physical activity (14% mediation), and the corresponding indirect effect was statistically significant (p <
0.01) after controlling for the covariates (Table 3). The
indirect effects for the HUI3 attributes were statistically
significant for mobility limitations, pain, and emotional
wellbeing (Table 3). The average percentages of the total
impact of having a chronic condition that could be attributed to the mediating role of physical activity were 18%
for mobility challenges, 13% for emotional problems,
and 5% for pain. We did not observe statistically significant (p <0.01) indirect effects for dexterity problems and
cognition.
The above associations were examined independently in
each of the six chronic condition subsamples (Table 4).
Having a chronic condition was significantly associated
with a relative increase in mobility limitations, pain, and
emotional problems in all chronic condition subsamples.
1.5
Age: 75 84 years versus < < 75years
Age: 75 - 84 years versus 75 years
1.9
Age: > 85 years versus < 75 years
1.7
Sex: female versus male)
Sex (female versus male
0.7
Smoking: yes versusno)
Smoking (yes versus no
1.0
Alcohol consumption: <(< 2 times per
Alcohol consumption 2 times per
month vs no alcohol)
month versus no alcohol
0.7
Alcohol consumption: 2 to 3 times per
Alcohol consumption (2 to 3 times
month versus alcohol)
per month vs no no alcohol
0.6
Alcohol consumption: > (> 3 times per
Alcohol consumption 4 times per
month versus no alcohol
month vs no alcohol)
1.5
Obesity: underweight versus normal
Obesity (underweight versus normal)
1.7
Obesity: overweight versus normal
Obesity (overweight versus normal)
0
0
0.5
0.5
1
1.0
1.5
1.5
2
2.0
2.5
1.0
OR (95% CI) Chronic condition versus no
OR (95% CI) Chronic condition versus no chronic conditio
chronic condition
Figure 3
Odds ratios for covariates
Odds ratios for covariates. Notes: N = 19,953.
Page 6 of 11
(page number not for citation purposes)
Health and Quality of Life Outcomes 2007, 5:68
/>
1.6
1.6
Musculoskeletal disorders versus
sorders no chronic condition (n(n =14,112)
versus no chronic condition = 14,112)
2.1
2.1
Respiratory disorders versus
disorders versus no chronic condition (n = 5,361)
no chronic condition (n = 5,361)
1.7
1.7
Heart disease versus
disease no chronic condition (n ==13,380)
versus no chronic condition (n 13,380)
1.7
1.7
Diabetes versus
Diabetes versus no chronic condition (n =5,393)
no chronic condition (n = 5,393)
2.6
2.6
Suffering the effects of a stroke versus
f a stroke versus no chronic condition (n = 3,533)
no chronic condition (n = 3,533)
2.2
2.2
Elimination disorders versus
disorders versus no chronic condition (n =5,038)
no chronic condition (n = 5,038)
1.6
1.6
One or more chronic conditions versus
nditions no chronic condition (n(n = 19,953)
versus no chronic condition = 19,953)
1.0
1
1.5
1.5
2.0
2
2.5
2.5
3.0
3
3.5
3.5
OR (95% CI) < 1,000 Kcal
week versus
1,000 Kcal per week
¢
¡
Figure 4
Odds ratios for physical activity in the chronic condition subsamples
Odds ratios for physical activity in the chronic condition subsamples.
Table 3: Regression model results in the full sample
Dependent variables
Variables
Physical activity (referent = ≥ 1,000 Kcal/
week)
< 1,000 Kcal/week
Age (referent = 65 – 74 yrs)
75 – 84 yrs
> 84 yrs
Sex (referent = male)
Female
Smoking status (referent = does not smoke)
Smokes daily or occasionally
Alcohol use (referent = does not use alcohol)
Less than two times/month
Two or three times/month
Four or more times/month
Obesity (referent = between 18.5 and 25)
Less than 18.5
More than or equal to 25
Chronic condition(s) (referent = no chronic
conditions)
One or more chronic conditions
Indirect effect1
% mediated by physical activity2
R2 (LR R2)
Likelihood ratio chi-square (Df = 11)
HUI total score
b(se)
Mobility
OR (95% CI)
Pain
OR (95% CI)
Emotion
OR (95% CI)
Physical activity
OR (95% CI)
-0.07 (0.00)
3.6 (4.3 – 3.0)
1.5 (1.7 – 1.3)
2.2 (1.6 – 3.0)
-
-0.04 (0.01)
-0.12 (0.01)
2.0 (1.8 – 2.4)
4.9 (4.2 – 5.6)
1.0 (0.9 – 1.2)
1.1 (1.0 – 1.2)
1.1 (0.8 – 1.5)
1.3 (1.0 – 1.6)
1.6 (1.4 – 1.9)
2.3 (2.0 – 2.6)
0.02 (0.01)
0.9 (0.8 – 1.0)
1.3 (1.2 – 1.4)
0.9 (0.7 – 1.1)
2.3 (2.1 – 2.6)
-0.04 (0.01)
1.5 (1.2 – 1.8)
1.2 (1.1 – 1.4)
1.8 (1.4 – 2.3)
2.0 (1.7 – 2.3)
0.03 (0.01)
0.06 (0.01)
0.07 (0.01)
0.9 (0.8 – 1.0)
0.6 (0.5 – 0.7)
0.6 (0.5 – 0.7)
0.9 (0.8 – 1.0)
0.8 (0.6 – 0.9)
0.7 (0.6 – 0.8)
0.7 (0.5 – 1.0)
0.5 (0.3 – 0.8)
0.4 (0.3 – 0.6)
0.8 (0.7 – 1.0)
0.7 (0.6 – 0.8)
0.6 (0.5 – 0.6)
-0.06 (0.02)
-0.01 (0.00)
1.6 (1.2 – 2.2)
1.5 (1.3 – 1.7)
1.4 (1.1 – 1.8)
1.2 (1.1 – 1.3)
2.1 (1.4 – 3.2)
0.9 (0.8 – 1.2)
3.7 (2.6 – 5.4)
1.0 (0.9 – 1.1)
-0.13 (0.00)
-0.02 (0.01)
14%
5.1 (3.8 – 7.0)
1.4 (1.2 – 1.7)
18%
7.6 (5.7 – 10.1)
1.1 (1.1 – 1.2)
5%
4.0 (2.5 – 6.3)
1.2 (1.1 – 1.2)
13%
1.3 (1.2 – 1.5)
-
12%
n/a
(15%)
2,358.59
(6%)
1,444.94
(6%)
423.90
(8%)
1,878.80
Notes: N = 19,953, including those older adults who had no chronic conditions or one of the selected chronic conditions and for whom there was no
missing data for any of the variables in our analyses. Only the results for the HUI3 attributes with statistically significant indirect effects (p < 0.01) are
shown. The reference groups for mobility, pain, and emotion are the same as in Table 2.
1 The indirect effect of having a chronic condition versus no chronic condition as mediated by physical activity.
2 Percentage of the total effect of having a chronic condition that is attributed to the mediating role of physical activity after controlling for the covariates
(based on the unexponentiated regression weights).
Page 7 of 11
(page number not for citation purposes)
Health and Quality of Life Outcomes 2007, 5:68
/>
Table 4: Odds ratios and % mediation for selected HUI3 attributes in the chronic condition subsamples
HUI3 attributes (dependent variables)
Independent variables
Dexterity
OR (95% CI)
Emotional
wellbeing
OR (95% CI)
Cognition
OR (95% CI)
Pain
OR (95% CI)
Mobility
OR (95% CI)
Musculoskeletal disorders versus no chronic
condition (n = 14,112)1
Physical activity < 1,000 Kcal/week2
% mediation3
11.0 (4.3 – 28.5)
4.7 (2.9 – 7.6)
2.2 (2.0 – 2.5)
12.0 (9.0 – 16.1)
6.6 (4.8 – 9.0)
1.5 (1.0 – 2.3)
5%
2.3 (1.6 – 3.3)
13%*
1.1 (1.0 – 1.3)
4%
1.4 (1.2 – 1.7)
4%*
3.7 (3.0 – 4.5)
16%*
Respiratory disorders versus no chronic
condition (n = 5,361)1
Physical activity < 1,000 Kcal/week2
% mediation3
10.4 (3.7 – 28.9)
5.0 (3.0 – 8.1)
2.2 (1.8 – 2.6)
10.7 (8.0 – 14.5)
7.6 (5.4 – 10.7)
0.8 (0.4 – 1.5)
0%
2.0 (0.9 – 4.5)
20%
1.2 (1.0 – 1.5)
13%
1.4 (1.0 – 1.8)
7%
3.9 (2.5 – 6.0)
27%*
Cardiovascular disorders versus no chronic
condition (n = 13,380)1
Physical activity < 1,000 Kcal/week2
% mediation3
7.8 (3.0 – 20.0)
4.0 (2.5 – 6.4)
1.9 (1.7 – 2.2)
7.2 (5.4 – 9.5)
5.6 (4.1 – 7.7)
1.4 (0.9 – 2.2)
5%
2.1 (1.4 – 3.2)
16%*
1.2 (1.0 – 1.3)
7%
1.6 (1.3 – 1.9)
8%*
3.3 (2.6 – 4.1)
19%*
Diabetes versus no chronic condition (n =
5,393)1
Physical activity < 1,000 Kcal/week2
% mediation3
10.6 (4.3 – 26.5)
5.0 (3.0 – 8.5)
1.9 (1.6 – 2.3)
7.1 (5.2 – 9.7)
6.6 (4.8 – 9.2)
1.2 (0.5 – 3.1)
3%
1.9 (0.8 – 4.1)
13%
1.2 (1.0 – 1.5)
10%
1.7 (1.3 – 2.3)
10%*
3.5 (2.3 – 5.3)
21%*
"Suffering the effects of a stroke" versus no
chronic condition (n = 3,533)1
Physical activity < 1,000 Kcal/week2
% mediation3
24.9 (7.9 – 78.1)
9.4 (5.1 – 17.5)
3.4 (2.7 – 4.3)
12.4 (8.7 – 17.7)
18.2 (12.7 – 26.1)
0.6 (0.2 – 2.4)
0%
1.2 (0.4 – 3.6)
5%
1.0 (0.8 – 1.4)
3%
1.3 (0.8 – 2.0)
7%
2.6 (1.5 – 4.6)
20%*
Urinary or bowel disorders versus no
chronic condition (n = 5,038)1
Physical activity < 1,000 Kcal/week2
% mediation3
15.3 (5.8 – 40.5)
7.7 (4.5 – 13.1)
3.1 (2.6 – 3.8)
14.4 (10.5 – 19.7)
9.9 (7.1 – 13.9)
1.0 (0.6 – 1.8)
0%
1.2 (0.7 – 2.1)
4%
1.1 (0.9 – 1.4)
6%
2.0 (1.5 – 2.7)
12%*
2.9 (2.0 – 4.2)
20%*
All odds ratios are adjusted for age, sex, cigarette use, alcohol consumption, and obesity. The reference groups for the HUI3 attributes are the same as
in Table 2.
1 Referent = no chronic condition.
2 Referent = ≥ 1,000 Kcal/week.
3 Percentage of the total effect that is attributable to the mediating effect of physical activity.
* Statistically significant indirect effects (p < 0.01).
The adjusted ORs for the effect of having a chronic condition on leisure-time physical activity when controlling for
the covariates ranged from 1.3 (95% CI = 1.1 – 1.5) for
older adults with a musculoskeletal disorder to 2.1 (95%
CI = 1.6 – 2.8) for older adults who suffered the consequences of a stroke. Those who were more physically
active reported relatively fewer mobility limitations (OR
ranging from 2.6 to 3.9) and less pain (OR ranging from
1.3 to 2.0) in the chronic condition subsamples (Table 4).
Increased physical activity was also associated with a relative increase in emotional wellbeing and relatively fewer
cognitive problems and dexterity limitations in some of
the chronic condition subsamples. The indirect effects
were statistically significant for mobility limitations
(ranging from 16% in the musculoskeletal disorders subsample to 27% in the respiratory disorders subsample) in
all of the chronic condition subsamples (last column
Table 4). Similar results with respect to the magnitude of
the parameters were obtained when these analyses were
replicated using FIML.
Discussion
To our knowledge, this is the first study that has specifically examined degree to which the negative impact of
chronic conditions on quality of life in older adults could
be attributed to a lack of physical activity. The results suggest that physical activity partially mediates the impact of
chronic conditions on several health outcomes that are
important to quality of life. Physical activity of at least
1,000 Kcal per week was associated with relatively fewer
mobility limitations, reduced pain, and greater emotional
wellbeing (i.e., happiness). The clinical relevance of the
mediating role of physical activity can be inferred by comparing the magnitude of the indirect effect to that of the
Page 8 of 11
(page number not for citation purposes)
Health and Quality of Life Outcomes 2007, 5:68
total effect, which indicated up to 27% mediation for
mobility limitation, up to 12% mediation for pain, and
up to 16% mediation for emotional wellbeing. These
findings concur with those of other studies. For example,
adequate physical activity was associated with a significant reduction in the number of days of poor physical and
mental health status in adults with arthritis [15].
The US Center for Disease Control and the American College of Sports Medicine guidelines [33] recommended
that individuals should engage in 30 minutes or more of
moderate-intensity physical activity on a daily basis
(equivalent to approximately 1,400 Kcal/week) while the
US Surgeon General's 1996 report classified moderate
physical activity as more than 1,000 Kcal/week [24]. We
found a low level of participation in leisure-time physical
activity regardless of chronic disease status among older
Canadians. Specifically, only 35% of older adults without
any chronic condition and 26% of those with one or more
chronic conditions met the 1,000 Kcal/week criterion.
Epidemiological data have established that physical inactivity decreases the incidence of at least 17 unhealthy conditions, most of which are chronic conditions or risk
factors [7]. Our study further elucidates the importance of
physical activity for older adults who have a chronic condition. We found that older adults with chronic conditions who were physical active (i.e., leisure-time physical
activity of at least 1,000 Kcal per week) reported better
health outcomes related to mobility, pain, and emotional
wellbeing than those who were physical inactive. Leisuretime physical activity likely mediates the negative association between chronic conditions and these specific selfreported health outcomes in older adults by: 1) maintaining or augmenting physiological functions (e.g., prevention of sarcopenia); 2) reducing the likelihood of
acquiring additional chronic conditions; 3) delaying the
progression of current chronic condition(s); and 4)
improving mental health and sense of wellbeing. In sum,
physical activity beneficially affects the human body in a
multifactorial manner.
Regular physical activity not only directly promotes
mobility in older adults via mechanisms such as
improved muscle strength and postural balance but also
indirectly by, for example, reducing the risk for falls and
fractures [34,35]. Maintaining the capacity for independent mobility and living is important to older adults and
contributes to their general sense of emotional wellbeing
[36,37]. Physical activity can enhance emotional wellbeing via increases in: 1) beta endorphins; 2) the availability
of brain neurotransmitters (e.g. serotonin); and 3) selfefficacy [38]. In addition, physical activity may mediate
the negative association between chronic conditions and
health outcomes by reducing the likelihood of acquiring
/>
additional chronic conditions and delaying the progression of current chronic condition(s). Most prevalent
chronic conditions have an association with physical inactivity, and a number of risk factors for chronic conditions
are precipitated by physical inactivity (e.g., obesity [39]
and insulin resistance [40]).
Unfortunately, individuals with chronic conditions are at
the highest risk of physical inactivity [24] – placing these
individuals at greater risk for acquiring additional chronic
conditions. According to Booth and coworkers [7], physical inactivity is the key environmental factor contributing
to the substantial increase in the incidence of chronic conditions in the latter part of the 20th century. Thus, physical
activity can prevent the onset of chronic conditions. Our
findings suggest that physical activity could also be beneficial for older adults who already have one or more
chronic conditions. These findings provide further support for health promotion programs that facilitate or
encourage increased leisure-time physical activity in older
people with chronic conditions.
In this study, physical activity is measured as the time
spent performing leisure-time activities. Despite the comprehensive nature of this information, daily activities performed by individuals are not represented in these data
and therefore physical activity was conservatively estimated. In addition, some respondents may not have been
able to accurately recall all their leisure-time physical
activities for a period of three months. This may explain
why the magnitude of the mediation effect that we
observed in this study was smaller than we had anticipated. We specifically expected that the OR for the association between having a chronic condition and physical
activity would have been larger. Non-response bias may
also have contributed to these results (e.g., older adults
with severe physical or mental health problems may have
been less likely to complete the survey).
A few other limitations should be noted. Although the
relationships were specified to examine the mediating
effects of physical activity, the direction of these relationships could also operate in the reverse. The cross-sectional
nature of the data does not allow us to confirm claims pertaining to the causality of these relationships. It seems just
as likely that poor ambulation will lead to a decrease in
physical activity which could lead to a variety of chronic
conditions. In addition, the utility weights for the HUI3
may not be generalizable considering that they are based
on a community sample of 504 adults in the city of Hamilton, Ontario, Canada [22]. Nevertheless, these weights
were only used for calculating the total HUI3 scores; they
were not used to measure each of the health attributes
which were included as binary variables in our analyses.
And, there is a lack of independence in our categories of
Page 9 of 11
(page number not for citation purposes)
Health and Quality of Life Outcomes 2007, 5:68
chronic conditions. For instance individuals who have
had a stroke are likely to have cardiovascular conditions as
well. Finally, some chronic conditions that may impact
quality of life in older adults (e.g., epilepsy and migraine
headaches) were not included in our analyses.
Conclusion
We observed that older adults with chronic conditions are
less likely to engage in leisure-time physical activities of at
least 1,000 Kcal per week, and that association partially
accounts for some negative consequences of chronic conditions, including mobility limitations, pain, and emotional problems. We recommend that increased attention
be paid to physical activity as a potential health promotion modality for older adults with chronic conditions.
Further studies are needed to determine the particular
types of physical activities that are most beneficial for
older adults with specific chronic conditions.
Abbreviations
BMI Body mass index
CI Confidence interval
CCHS Canadian Community Health Survey
/>
Acknowledgements
We wish to acknowledge the Physical Activity and Chronic Conditions
(PACC) Research Team for their support and contributions to the larger
research project that gave rise to this study, Dr. David Mackinnon for his
correspondence with us regarding the computation of mediating effects,
and Dr. Peilin Shi for conducting preliminary analyses. This project was supported by a Canadian Institutes of Health Research (CIHR) Team Development Grant. WCM is a funded scholar supported by the CIHR Institute of
Aging. TLA and CAM are Michael Smith Foundation for Health Research
Scholars. CAM is a Canada Research Chair in Pharmaceutical Outcomes.
References
1.
2.
3.
4.
5.
6.
7.
FIML Full information maximum likelihood
8.
HUI3 Health Utilities Index (Mark 3)
9.
Kcal Kilocalories
LR Likelihood ratio
10.
11.
OR Odds ratio
12.
SD Standard deviation
Competing interests
The author(s) declare that they have no competing interests.
13.
14.
Authors' contributions
RS designed and carried out the statistical analyses and
drafted the manuscript. TLA assisted with the interpretation of the results and contributed to the writing and editing of multiple drafts. WCM conceived and designed the
project, obtained funding, assisted with the interpretation
of the results and contributed to the writing and editing of
multiple drafts. CAM was involved in the design, assisted
in the interpretation of results and edited multiple drafts
of the manuscript. All authors read and approved the final
manuscript.
15.
16.
17.
18.
Gilmour H, Park J: Dependency, chronic conditions and pain in
seniors. Health Rep 2006, 16 Suppl:21-31.
Schnittker J: Chronic illness and depressive symptoms in late
life. Soc Sci Med 2004/10/16 edition. 2005, 60(1):13-23.
Lyness JM, Niculescu A, Tu X, Reynolds CF, Caine ED: The relationship of medical comorbidity and depression in older, primary
care patients.
Psychosomatics 2006/09/09 edition. 2006,
47(5):435-439.
Leong IY, Farrell MJ, Helme RD, Gibson SJ: The relationship
between medical comorbidity and self-rated pain, mood disturbance, and function in older people with chronic pain. J
Gerontol A Biol Sci Med Sci 2007/05/25 edition. 2007, 62(5):550-555.
Bean JF, Vora A, Frontera WR: Benefits of exercise for community-dwelling older adults. Arch Phys Med Rehabil 2004, 85(7
Suppl 3):S31-42.
Centers for Disease Control and Prevention (CDC): Missed opportunities in preventive counseling for cardiovascular disease-United States, 1995. MMWR Morb Mortal Wkly Rep 1998,
47(5):91-5.
Booth FW, Gordon SE, Carlson CJ, Hamilton MT: Waging war on
modern chronic diseases: primary prevention through exercise biology. J Appl Physiol 2000, 88(2):774-787.
Leveille SG, Guralnik JM, Ferrucci L, Langlois JA: Aging successfully
until death in old age: opportunities for increasing active life
expectancy. Am J Epidemiol 1999, 149(7):654-664.
Lee IM, Paffenbarger RS: Do physical activity and physical fitness
avert premature mortality? Exerc Sport Sci Rev 1996, 24:135-171.
DiLorenzo TM, Bargman EP, Stucky-Ropp R, Brassington GS, Frensch
PA, LaFontaine T: Long-term effects of aerobic exercise on psychological outcomes. Prev Med 1999, 28(1):75-85.
Greist JH, Klein MH, Eischens RR, Faris J, Gurman AS, Morgan WP:
Running as treatment for depression. Compr Psychiatry 1979,
20(1):41-54.
Blumenthal JA, Babyak MA, Moore KA, Craighead WE, Herman S,
Khatri P, Waugh R, Napolitano MA, Forman LM, Appelbaum M,
Doraiswamy PM, Krishnan KR: Effects of exercise training on
older patients with major depression. Arch Intern Med 1999,
159(19):2349-2356.
Babyak M, Blumenthal JA, Herman S, Khatri P, Doraiswamy M, Moore
K, Craighead WE, Baldewicz TT, Krishnan KR: Exercise treatment
for major depression: maintenance of therapeutic benefit at
10 months. Psychosom Med 2000, 62(5):633-638.
Centers for Disease Control and Prevention (CDC).: Centres for
Disease Control and Prevention: Surveillance for selected
public health indicators affecting older adults - United
States. MMWR CDC Surveill Summ 1999, 48(SS8): [http://
www.cdc.gov/mmwr/PDF/SS/SS4808.pdf].
Abell JE, Hootman JM, Zack MM, Moriarty D, Helmick CG: Physical
activity and health related quality of life among people with
arthritis. J Epidemiol Community Health 2005, 59(5):380-385.
Brown DW, Balluz LS, Heath GW, Moriarty DG, Ford ES, Giles WH,
Mokdad AH: Associations between recommended levels of
physical activity and health-related quality of life. Findings
from the 2001 Behavioral Risk Factor Surveillance System
(BRFSS) survey. Prev Med 2003, 37(5):520-528.
Beland Y: Canadian community health survey: methodological overview. Health Rep 2002, 13(3):9-14.
Furlong WJ, Feeny DH, Torrance GW, Barr RD: The Health Utilities Index (HUI) system for assessing health-related quality
of life in clinical studies. Ann Med 2001, 33(5):375-384.
Page 10 of 11
(page number not for citation purposes)
Health and Quality of Life Outcomes 2007, 5:68
19.
20.
21.
22.
23.
24.
25.
26.
27.
28.
29.
30.
31.
32.
33.
34.
35.
36.
37.
38.
39.
40.
Schultz S E, Kopec J A: Impact of chronic conditions. Health Rep
2003, 14(441-53 [ />archive/2003/14-4-c.pdf].
Torrance GW: Measurement of health state utilities for economic appraisal. J Health Econ 1986, 5(1):1-30.
Torrance GW, Boyle MH, Horwood SP: Application of multiattribute utility theory to measure social preferences for
health states. Oper Res 1982, 30(6):1043-1069.
Feeny D, Furlong W, Torrance GW, Goldsmith CH, Zhu Z, DePauw
S, Denton M, Boyle M: Multiattribute and single-attribute utility functions for the Health Utilities Index Mark 3 system.
Med Care 2002, 40(2):113-128.
Ainsworth BE, Haskell WL, Leon AS, Jacobs DR, Montoye HJ, Sallis JF,
Paffenbarger RS: Compendium of physical activities: classification of energy costs of human physical activities. Med Sci
Sports Exerc 1993, 25(1):71-80.
US Department of Health and Human Services: Physical activity
and health: a report of the surgeon general. 1996 [http://
www.cdc.gov/nccdphp/sgr/pdf/sgrfull.pdf]. Atlanta (GA) , US Department of Health and Human Services, Centre for Disease Control and
Prevention, National Centre for Chronic Disease Prevention and
Health Promotion
Thomas DR, Hughes E, Zumbo BD: On variable importance in
linear regression. Soc Indic Res 1998, 45:253-175.
Menard SW: Applied logistic regression analysis . 2nd edition.
Thousand Oaks , Sage; 2002.
MacKinnon DP, Lockwood CM, Hoffman JM, West SG, Sheets V: A
comparison of methods to test mediation and other intervening variable effects. Psychol Methods 2002, 7:83-104.
Mackinnon DP, Dwyer JH: Estimating mediated effects in prevention studies. Eval Rev 1993, 17:144-158.
SAS Institute: Statistical analysis software (version 9.2). Cary,
NC , Author; 2005.
Muthén B, Muthén LK: MPlus (version 4.2). Los Angeles , Statmodel; 2006.
Enders CK: Analyzing structural equation models with missing data. In Structural equation modeling: a second course Edited by:
Hancock GR, Mueller RO. Greenwich , Information Age Publishing;
2006:313-342.
Allison PD: Missing data. Thousand Oaks, CA , Sage; 2002.
Pate RR, Pratt M, Blair SN, Haskell WL, Macera CA, Bouchard C,
Buchner D, Ettinger W, Heath GW, King AC, et al.: Physical activity and public health. A recommendation from the Centers
for Disease Control and Prevention and the American College of Sports Medicine. Jama 1995, 273:402-407.
Campbell AJ, Robertson MC, Gardner MM, Norton RN, Buchner
DM: Falls prevention over 2 years: a randomized controlled
trial in women 80 years and older.
Age Ageing 1999,
28(6):513-518.
Campbell AJ: Preventing fractures by preventing falls in older
women. CMAJ 2002, 167(9):1005-6.
Salkeld G, Cameron ID, Cumming RG, Easter S, Seymour J, Kurrle SE,
Quine S: Quality of life related to fear of falling and hip fracture in older women: a time trade off study. BMJ 2000,
320(7231):341-346.
Gold DT: The nonskeletal consequences of osteoporotic fractures. Psychologic and social outcomes. Rheum Dis Clin North
Am 2001, 27(1):255-62.
Craft LL, Perna FM: The benefits of exercise for the clinically
depressed. Prim Care Companion J Clin Psychiatry 2004, 6(3):104-111.
Perusse L, Bouchard C: Genotype-environment interaction in
human obesity. Nutr Rev 1999, 57(5 Pt 2):S31-7; discussion S37-8.
Howard BV: Insulin resistance and lipid metabolism. Am J Cardiol 1999, 84(1A):28J-32J.
/>
Publish with Bio Med Central and every
scientist can read your work free of charge
"BioMed Central will be the most significant development for
disseminating the results of biomedical researc h in our lifetime."
Sir Paul Nurse, Cancer Research UK
Your research papers will be:
available free of charge to the entire biomedical community
peer reviewed and published immediately upon acceptance
cited in PubMed and archived on PubMed Central
yours — you keep the copyright
BioMedcentral
Submit your manuscript here:
/>
Page 11 of 11
(page number not for citation purposes)