Environmental Life Cycle Costing - Chapter 7 doc
Bạn đang xem bản rút gọn của tài liệu. Xem và tải ngay bản đầy đủ của tài liệu tại đây (626.76 KB, 39 trang )
113
7
Life Cycle Costing
Case Studies
Andreas Ciroth, Carl-Otto Gensch,
Edeltraud Günther, Holger Hoppe,
David Hunkeler, Gjalt Huppes,
Kerstin Lichtenvort, Kjerstin Ludvig,
Bruno Notarnicola, Andrea Pelzeter, Martina Prox,
Gerald Rebitzer, Ina Rüdenauer, and Karli Verghese
Summary
Examples are provided of environmental and conventional LCC for both dura-
ble and nondurable goods, as well as services. Common conventional LCC still
dominates the real case studies, with a few environmental LCC examples. As no
complete societal LCC was identied in the literature, a hypothetical applica-
tion related to data transmission is presented. The cases are intended to serve
as references as to how LCC results should be presented, the methodology that
is appropriate, and the level of documentation required. Products with different
market lives are discussed, with the technology spectrum varying from food to
high-tech electronics developments.
7.1 INTRODUCTION
Various studies are summarized that provide examples for conventional, environ-
mental, and societal life cycle costing. They are intended to describe the methodol-
ogy and provide specic examples of the data required, calculations, validation, and
presentation of the results. The cases include examples of durable, semidurable, and
nondurable goods, with product lifetimes ranging from months to decades. High-
tech and commodity examples are included, identifying cases where various materi-
als of choice (EcoDesign), downstream burdens (e.g., transport and disposal), and
process variations dominate the impact. Examples are generally based on real data
from the private sector, with 2 cases presented from the consumer perspective. There
is also 1 hypothetical case included to demonstrate the societal LCC methodology.
The case studies presented are as follows:
Organic versus conventional extra-virgin olive oil (Section 7.2)r
Wastewater treatment (Section 7.3)r
Energy-saving lamps versus incandescent lamps (light bulbs; Section 7.4)r
© 2008 by the Society of Environmental Toxicology and Chemistry (SETAC)
114 Environmental Life Cycle Costing
Different construction variants for a double-deck carriage oor, a compo-r
nent of a regional train (Section 7.5)
Washing machines (Section 7.6)r
Hypothetical case on data transmission (Section 7.7)r
A consumer perspective of the utilization of an automobile (Section 7.8)r
Residential buildings, including both static and dynamic evaluations (Sec-r
tion 7.9)
Table 7.1 characterizes the 7 cases based on real data. A variety of product life-
times are considered, from those that are consumed in months (olive oil) to those
with a durability measured in decades (e.g., water treatment and residential build-
ings). The cases also include technology-related products such as family transport
(automobiles) and data transport, those for which the use phase is critical (i.e., light
bulbs and washing machines), as well as services (transport carriage).
All case studies are summarized in Table 7.2, with the overall life cycle cost
expressed in monetary units (euros) as well as the key environmental impacts identi-
ed in the studies, as far as possible. In each subsection, detailed discussions of the
individual cases will be presented in a common format. Cases are presented where
maintenance dominates (train carriage) as well as others where the transport phase
greatly exceeds all other costs, and impacts, for a service (water treatment). Some
of the studies relied on very detailed engineering models and simulations, whereas
others were LCIA-based for which supplemental LCCs were added. As Table 7.2
demonstrates, the ratio of the LCC to the selling price can differ signicantly (from
a factor of 2 to more than 1000) depending on if the product use phase is important
to the overall operating costs. Interestingly, for the automobile, where the use phase
dominates the environmental impact, it accounts for only 50% of the life cycle cost.
For buildings, however, where construction is a major impact, the use phase is more
than 90% of the total cost. This implies that, for LCC to be normalized or bench-
marked, it must done within a very homogeneous product group.
Table 7.1 and Table 7.2 reveal that case studies having been carried out in prac-
tice are still predominantly applying conventional LCC (4 conventional LCC case
studies versus 2 environmental LCC and 1 societal LCC case study). The fact that
environmental LCC would add value to many of the conventional studies carried out
TABLE 7.1
Characterization of the life cycle costing case studies evaluated
Sector of activity Case studies evaluated Geographical region Type of life cycle costing
Manufacturing:
durable goods
Train carriage
Light bulbs
Washing machines
Automobiles
Europe (Germany)
Europe (Germany)
Europe (Germany)
Europe (Germany)
Environmental LCC
Conventional LCC
Conventional LCC
Conventional LCC
Manufacturing:
nondurables
Olive oil Europe (Italy) Societal LCC
Service Water treatment
Residential building
Europe (Switzerland)
Europe (Germany)
Environmental LCC
Conventional LCC
© 2008 by the Society of Environmental Toxicology and Chemistry (SETAC)
Life Cycle Costing Case Studies 115
is a valuable justication for the new method presented in this book. For example,
the light bulb case study considers only the energy consumption in the use phase,
admittedly the most important environmental impact. However, an environmental
LCC comprising a complete LCA would underpin the pros and cons of the currently
discussed phasing out of incandescent lamps in Australia and Europe; for example,
assessing properly the mercury used in the alternative compact uorescent lamps
(CFL) and internalizing CO
2
costs from emission trading. A societal LCC would
even assess the societal implications of a shift of incandescent lamp factories cur-
rently located in Europe to CFL factories in Asia.
Environmental LCC would require an assessment of the end-of-life phase in the
washing machine case study, which may put into perspective a too early substitution of a
less energy-efcient washing machine. It would require a complete LCA of the passen-
ger cars investigated in the automobile case study, which may prove, if the estimation of
environmental impacts of an entire car reects the environmental impacts accurately, an
important issue in the increasing public rating of cars in particular by NGOs. Environ-
mental LCC would also require sophisticated calculation of the energy consumption of
a building, based on U-values of different building elements, in relation to LCIA indica-
tors like global warming potential (GWP), ozone depletion potential (ODP), nitrication
potential (NP), eutrophication potential (EP), or photochemical ozone creation potential
(POCP) over the whole life cycle of a building, which may differentiate the results of the
building case study dependent on age, climate zone, and annual energy consumption per
m. For all conventional LCC case studies, it would be of interest to learn about the impli-
cation of the environmental costs under discussion, which are likely to become manda-
tory for the manufacturer in the decision-relevant future. These would include CO
2
costs
from emission trading, CO
2
taxes or binding targets for cars, minimum energy perfor-
mance standards (MEPS) for appliances, and compliance costs with legislation like the
European Environmental Performance of Buildings directive (European Union 2005a).
The 2 environmental LCC case studies, water treatment and train carriage, both
lead to airtight (and quite likely very nonintuitive) conclusions after having studied
all economic and environmental impacts over the whole life cycle. These are that
the transport of water treatment sludge to ultimate disposal dominates the environ-
mental impacts for distances above 40 km and that maintenance accounts for 75% of
train carriage LCC, whereas energy in use only sums up to 16%.
The olive oil case study demonstrates well the current state of the art of societal
LCC; in fact, key external costs are considered according to the path-breaking Extern-
E methodology (Bickel and Friedrich 2005). However, more societal impacts have not
been considered in the available real case studies. As a comprehensive example on soci-
etal LCC, considering mainly the government and society perspective, a hypothetical
high-tech case study on data transmission will be presented in Section 7.6. This case
study considers subsidies and VAT and internalizes all environmental damages, includ-
ing those for which there are no real money ows (yet) for data transmission companies.
Even this hypothetical societal LCC could better incorporate qualitative societal impacts,
as outlined in Chapter 4 (e.g., standard of living, employment, and working hours).
The cases selected for presentation were those that the working group, following the
3 years of deliberations, felt would pass review for an international standard should, for
example, ISO develop 1 for LCC in analogy to ISO 14040/44 (2006) dened for LCA.
© 2008 by the Society of Environmental Toxicology and Chemistry (SETAC)
116 Environmental Life Cycle Costing
TABLE 7.2
Summary of life cycle costing case studies
Case study Life cycle cost (€ per unit)
Selling price
(€ per unit)
Life cycle assessment
principal impacts Type of LCC Comments
Olive oil—organic
and traditional
Organic: 5680 € (internal
costs); traditional: 3796 €
(internal costs)
Organic: 1103 € (external
costs); traditional: 10403 €
(external costs)
N/A Considered pesticide and
fertilizer use, agricultural
activities on water,
transport, energy, and
packaging
Societal LCC, key
external costs
considered
Extern-E project
Water treatment $120 per person per year
(30% solids, 100 km
transport)
$80 per person per year (25%
solids, 40 km transport)
— Transport of sludge to
ultimate disposal dominates
the impacts for distances
above 40 km
Environmental LCC Transport dominates
environmental impact and LCC
Light bulbs Energy-saving type 1:
1808.68 €
Energy-saving type 2:
3595.06 €
Energy-saving type 1:
15.45 €
Energy-saving type 2:
7.60 €
Use phase (impacts not
assessed in traditional LCC)
Conventional LCC The inclusion of costs for CO
2
would now be easily possible
because of the European
emission-trading scheme, which
© 2008 by the Society of Environmental Toxicology and Chemistry (SETAC)
Life Cycle Costing Case Studies 117
Incandescent lamp:
5614.51 €
Incandescent lamp:
1.20 €
allocates a price to the emission
caused
Train carriage 248000 € (purchase: 3%;
maintenance: 75%; and
energy in use: 16%)
7440 € Use phase, and energy
related to transport
Environmental LCC Maintenance accounts for 75% of
LCC
Washing machine 1168 € (purchase: 43%;
energy supply: 22%; and
water supply: 35%)
500 € Not identied (only energy
for production and direct
energy consumption in use
phase)
Conventional LCC —
Automobile Corsa 1.0: 10945 €
Punto 1.2: 10890 €
Citroën C2: 10990 €
Corsa 1.0: 19964 €
Punto 1.2: 2116 €
Citroën C2: 19119 €
An overall measure of
environmental impact was
estimated using the VCD
methodology
Conventional LCC An environmental assessment is
included, though as the system
boundaries differ from the LCC,
the assessment remains
“conventional” rather than
“environmental”
Building Residential: 134471 €
Mixed-use: 1465 994 €
Residential: 2854340 €
Mixed-use: 17813 206 €
No LCA carried out Conventional LCC Inclusion of the time v
alue of
money as a scenario
© 2008 by the Society of Environmental Toxicology and Chemistry (SETAC)
118 Environmental Life Cycle Costing
7.2 ORGANIC VERSUS CONVENTIONAL EXTRA-VIRGIN OLIVE OIL
7.2.1 S
UMMARY
Organic olive oil production in Italy has grown in recent years, presently covering
1.2 million hectares (ha), though it still remains a niche product. The production sys-
tems for conventional and organic extra-virgin olive oil were compared, in order to
assess their environmental and cost proles, and to verify if the 2 dimensions, envi-
ronmental and economic, converge in the same direction (Notarnicola et al. 2003).
This case presents an example of a societal LCC, though it is incomplete as only key
external costs are considered.
7.2.2 DEFINITION OF THE CASE STUDY
Olive oil production in Puglia, a region of the south of Italy, represents 50% of the
entire Italian production and 18% of the EU production output. In recent years, the
production of organic extra-virgin olive oil has increased due to new consumer
behavior and to the high organoleptic, nutritional, and healthiness qualities of this
product. The total Italian “organic” growing area is approximately 1200000 ha, fea-
turing more than 60 000 farms. However, organic extra-virgin olive oil still remains
a niche product because of its higher market price than other oils and fats, and due
to the cost of labor in the extremely delicate operation of olive harvesting and the
additional costs due to the minor yields (about 30%) of the organic soil. The func-
tional unit was the conventional and organic production of 1 kg extra-virgin olive oil
(cradle-to-gate analysis). The internal and external costs are respectively shown in
Table 7.3 and Table 7.4.
7.2.3 ENTRY GATE AND DRIVERS
Various olivicultures and olive oil producers, both conventional and organic, have
been involved in supplying data and should be viewed as the entry gates. The higher
cost of the olive oil (both conventional and organic) compared to other oils and fats
was the driver for change.
7.2.4 IMPLEMENTATION
Barriers
There have been problems due to the use of fertilizer and pesticide diffusion models,
and enhanced scientic support to predict their fate in the environment is needed.
Process to Achieve Change
A rationalization of the use of fertilizers and pesticides could lead to a reduction in
the external costs in the olive oil life cycle. In regard to the internal costs, the labor
in the agricultural phase is the most relevant.
© 2008 by the Society of Environmental Toxicology and Chemistry (SETAC)
Life Cycle Costing Case Studies 119
Successes, Results, and Benefits
Detailed environmental and cost inventories of the 2 olive oils have been carried out
and disseminated.
TABLE 7.3
Internal costs of organic and conventional extra-virgin
olive oil production per functional unit (€)
Cost item Organic Conventional
Agricultural phase
Pesticides 0.171 0.117
Fertilizers 0.268 0.181
Lube oil 0.023 0.011
Electric energy 0.143 0.085
Water 0.077 0.046
Diesel 0.084 0.048
Labor 4.344 2.864
Organic certication costs 0.064 —
Total (agricultural phase) 5.174 3.352
Transport phase
Transport 0.078 0.039
Industrial phase
Electric energy 0.014 0.024
Labor 0.089 0.045
Water 0.002 0.022
Packaging 0.298 0.298
Waste authority 0.015 0.015
Organic certication costs 0.009 —
HACCP certication costs 0.0009 0.0009
Total (industrial phase) 0.428 0.405
Total 5.680 3.796
Source: Notarnicola et al. (2003).
TABLE 7.4
External costs of organic and conventional extra-virgin olive oil
production per functional unit (€)
Cost item Organic Conventional
External costs of energy 0.664 0.533
External costs of fertilizers and pesticides 0.439 9.870
Source: Notarnicola et al. (2003).
© 2008 by the Society of Environmental Toxicology and Chemistry (SETAC)
120 Environmental Life Cycle Costing
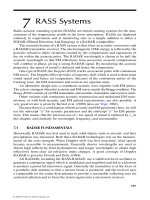
General Learnings
Figure 7.1 shows the differences between including and excluding external costs in
the LCC. If one does not consider the external costs, the organic oil has a higher cost
prole that is due to its lower agricultural yields. However, when external costs and less
tangible, hidden, and indirect costs are included, this results in the organic oil having
a lower total cost compared to the conventional oil. This result illustrates the need to
account for external costs, as has recently been initiated by the European Commission.
The options for environmental improvement in the conventional system are, primarily,
related to a more reasonable use of pesticides while, in the case of the organic system,
a reuse of the brushwood as fuel, rather than their uncontrolled burning on the elds,
which could lead to a better environmental prole both in the human toxicity (HT)
and in the photochemical ozone creation (POCP). Moreover, in the organic system the
traditional extraction method has been used in the inventory setup. It should be noted
that the Associazione Italiana per l’Agricoltura Biologica (AIAB) guidelines (2007)
permit organic oil producers to apply the “continuous-extraction method,” which is
characterized by energy consumption double that of the traditional process. It would
be desirable to note, in these guidelines, the relevance of energy consumption, since
the consumer who is interested in organic foods would like to buy a more ecocompat-
ible product, which is characterized not only by the absence of chemical fertilizers and
pesticides but also by an overall environmental advantage.
7.2.5 OVERVIEW OF TOOLS USED
The environmental LCC methodology used was based upon the guidelines stated by
White et al. (1996), which divide the costs into 3 categories: conventional corporate
costs (typical costs that appear in the company accounts); less tangible, hidden, and
indirect costs (less measurable and quantiable, often obscured by placement in an
overheads account); and external costs (the costs that are not paid by the polluter, but
by the polluted). The physical and economic data were collected directly from farms,
olive oil factories, and public databases, as will be highlighted below.
FIGURE 7.1 LCA–LCC with and without external costs for conventional and organic extra-
virgin olive oil production. Source: Notarnicola et al. (2003).
© 2008 by the Society of Environmental Toxicology and Chemistry (SETAC)
0%
10%
20%
30%
40%
50%
60%
70%
80%
90%
100%
Organic
Conventional
LCA LCC without External Costs LCC with External Costs
Life Cycle Costing Case Studies 121
The external costs relative to the energy have been taken from the ExternE
National Implementation Italian Report (FEEM 1997), while those relative to the
use of pesticides and fertilizers were taken from a study of the Bocconi, Milan,
Italy, in which the production and social costs of organic and conventional agricul-
ture have been compared. The study took into account the impact of the agricul-
tural activities on the water and monetized these impacts, showing that the damage
caused by conventional agriculture due to fertilizers and pesticides in terms of rec-
lamation and decontamination costs is 33 times higher than that caused by organic
agriculture. The Department of Commodity Science, Faculty of Economics, Bari,
undertook the study.
7.3 WASTEWATER TREATMENT
7.3.1 S
UMMARY
An environmental life cycle costing study of municipal wastewater treatment in
Switzerland was undertaken, with the results being directly applicable also to other
European countries. It was found that the inclusion of both upstream and downstream
processes is essential for determining improved options for wastewater treatment.
7.3.2 DEFINITION OF THE CASE STUDY
When assessing options for the treatment of municipal wastewater and supporting
decision making in this context, one must focus not only on the quality of the end
product, the cleaned water, but also on the costs for the operation of the wastewater
treatment plant. The impacts and costs caused by the operation of the plant as well
as by upstream processes (e.g., the production of ancillaries) and downstream opera-
tions (e.g., treatment and transport of produced sludge) also need to be taken into
account. The aim of this case study was to analyze both environmental impacts and
costs of the complete life cycle of wastewater treatment, in order to identify the driv-
ers for environmental impacts and costs, to identify trade-offs, and to give recom-
mendations for improved and more sustainable wastewater management. A detailed
elaboration of the case study is given by Rebitzer et al. (2003). The study examined
medium-sized (50000 person equivalents) municipal wastewater treatments, with
biological treatment followed by sludge digestion.
In this study typical municipal wastewater treatment options in Switzerland were
assessed, with the general ndings being transferable to other European countries.
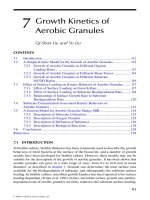
The complete system of wastewater treatment was examined, taking all involved
processes into account as illustrated in Figure 7.2.
The reference ow, which was identical with the functional unit in LCA terms, to
be assessed was the treatment of the average amount of a typical municipal wastewa-
ter per year and person in Switzerland. The perspective of a company or municipality
operating the wastewater treatment plant is chosen because these are the organiza-
tions concerned with the costs of the treatment and associated processes. Addition-
ally, and even more importantly, these organizations can inuence the system of
wastewater treatment.
© 2008 by the Society of Environmental Toxicology and Chemistry (SETAC)
122 Environmental Life Cycle Costing
The results were used to create a basis for the planning of new wastewater treat-
ment plants (in the sense of design for environment), as well as to assist decisions
in existing plants for the treatment of municipal wastewater. The different options
(scenarios and assumptions) assessed are listed in Table 7.5.
The methodology of life cycle inventory–based LCC was employed for this case
study, where the life cycle cost assessment is based on the life cycle inventory of an
LCA and where both LCC and LCA are separately considered for decision making
(for a detailed presentation of this approach, see Chapter 3 of this book). In this
specic case, since no long-term intervals are involved, discounting was not applied.
The results of the different options were elaborated in detail, also analyzing the
contributions of single elements of the system (see Figure 7.3 as an example for 1
scenario) and the most important parameters (Figure 7.4).
The case study demonstrates that dry substance of the sludge and transport dis-
tance are extremely important parameters, which can lead to differences in variable
costs up to a factor of 3 (Figure 7.3). The additional costs for advanced occulants
for achieving a higher dry content are very small in relation to the cost savings
that occur downstream. If the results of the LCA are compared (see Rebitzer et al.
FIGURE 7.2 Model of the LCA system for municipal wastewater treatment. Source:
Rebitzer et al. (2002).
© 2008 by the Society of Environmental Toxicology and Chemistry (SETAC)
Waste Water
Treatment Plant
Treated Waste
Water
Municipal Waste
Water
Sludge
Treatment
Energy
Generation
Ancillaries
Production
Raw Materials
Extraction
Waste
Treatment
Transport
Elementary Flows
(input)
Elementary Flows
(output)
Expanded System Boundaries
Fertilizer
Production
Energy
Generation
Life Cycle Costing Case Studies 123
2003), the same parameters also highly inuence the environmental impacts, lead-
ing to a comparable ranking of the options. Therefore, the use of advanced (highly
soluble, generating higher sludge dry material) occulants can be seen as an envi-
ronmental-economic win–win situation and an important contribution to the goals
of sustainable development. Overall, it is the environmental cost, as well as burden,
$ per Person and Year
Sludge incineration
Nat. gas subst. by digestor gas
Solid waste management
Sludge drying
Sludge transport
Polymeric flocculants
Iron Sulfate (inorganic flocculant)
Electricity for treatment plant
403020100–10
FIGURE 7.3 Costs of the different elements of the system of wastewater treatment (scenario
C, with incineration of sludge). Note: Assuming 40 km transport distance and sludge with a
dry content of 35% leaving the wastewater treatment plant. Source: Rebitzer et al. (2003).
TABLE 7.5
Studied wastewater treatment scenarios and assumptions for the treatment
of typical municipal wastewater in Switzerland
Scenario A Scenario B Scenario C
Inorganic chemical for
phosphorous removal
(coagulation)
— Iron sulphate Iron sulphate
Organic chemical for
sludge dewatering
(occulation)
— — Cationic
polyacrylamides
Specication of
wastewater treatment
plant
10000- to
50000-person
equivalents
10000- to
50000-person
equivalents, adapted to
aforementioned
chemical use
10000- to
50000-person
equivalents, adapted to
aforementioned
chemical use
Sludge disposal Incineration or
agriculture
Incineration or
agriculture
Incineration or
agriculture
Transport distances for
sludge disposal
40,100, and 200 km 40,100, and 200 km 40,100, and 200 km
Source: Rebitzer et al. (2003).
© 2008 by the Society of Environmental Toxicology and Chemistry (SETAC)
124 Environmental Life Cycle Costing
of the truck transport of high-water-containing residues that dominates. Reducing
the water level (i.e., via better chemical drying) is essential to improve the environ-
mental cost or impact. A “green” occulant is not one that is made from a naturally
extracted macromolecule but one that can provide highly dry material and reduce
the transport burden.
Both the environmental analysis and the life cycle costing study were carried
out by the Life Cycle Systems group of the Swiss Federal Institute of Technology
Lausanne (.ch; Ecole Polytechnique Fédérale de Lausanne 2007)
in close cooperation with the rm AQUA+TECH (;
AQUA+TECH n.d.), a developer and provider of occulants for wastewater treat-
ment and other applications.
7.3.3 ENTRY GATE AND DRIVERS
The entry gate of the rm (AQUA+TECH) was through the top management of the
company. The director initiated the study, delivered the required information, and
supported any internal staff necessary for the study.
In the process industries, which deal with wastewater treatment, as well as in
municipalities and other operators of municipal wastewater treatment plants, there
is high cost pressure and the need for efcient solutions that fulll the requirements
of environmental regulations. On the other hand, the costs are often only addressed
for single elements of the life cycle of water treatment. Specically, many opera-
tors of treatment plants try to optimize their internal costs without looking at the
downstream implications. Therefore, the study was driven by the aim to make the
overall costs as well as the interactions between the different elements of the system
transparent in order to raise awareness and to gain understanding for economically
FIGURE 7.4 Signicant variable costs of municipal wastewater treatment as a function of
sludge dry substance and disposal transport distance. Source: Rebitzer et al. (2003).
© 2008 by the Society of Environmental Toxicology and Chemistry (SETAC)
0
50
100
150
200
250
Transport cost 100 km
Transport cost 40 km
Flocculant
Drying cost
40 km
100 km
$ per Person and Year
15 20 25 30 35 40 45
Life Cycle Costing Case Studies 125
and environmentally improved options. If operators realize what a difference they
can make in regard to the downstream operations of sludge transport and disposal,
one can create incentives for sharing small additional costs that yield much greater
overall savings. In this context, the study was also driven by the requirement to use
such results for the sales and marketing of advanced* occulants.
7.3.4 IMPLEMENTATION
The main barrier for the implementation of the ndings was that, often, different
actors control the different elements of the life cycle, and each actor (e.g., operator of
water treatment plant and companies, or municipalities running the sludge transport
and disposal business) tries to optimize its own costs and revenues, which often does
not lead to an overall optimum. There may, for example, be conicting interests
if reduced transport costs lead to a decrease of revenue for the transport business.
This is exacerbated by the accounting practices of some communities, where water
treatment and sludge transport are in separate budgets. Such conicts of interest
sometimes even occur if the different processes are part of 1 organization, speci-
cally if they have to operate as prot centers. Other barriers include the perceived
communization of the market, which implies that clients, often municipalities, seek
to purchase inexpensive product, on a per kg basis, rather than economically effec-
tive solutions (e.g., euro per ton of water treated).
The key to achieve changes and enable the implementation of life cycle thinking
is awareness rising and education for all actors involved. In addition, the targeted
communication of the results of the life cycle costing study is essential. Further steps
could include the organization of round tables and supplier–customer interaction in
the sense of supply chain management (see Slagmulder 2002).
The case study shows that, using the life cycle approach, environmental-eco-
nomic win–win situations can be identied. For the rst time, the benets of oc-
culants could be demonstrated from a systems perspective. This can be seen as a
central step in moving wastewater treatment to a more sustainable practice, in spite
of the barriers for implementation that still exist (see above). However, as many
municipalities separate the chemical budget from transport in different cost centers,
life cycle thinking, while understood in European water treatment, has been slow in
integrating into purchase decisions.
In addition to the aforementioned learnings, this case demonstrated that life
cycle costing, if based on the life cycle inventory of an LCA, is an easy-to-apply and
efcient approach for assessing the economic dimension of sustainability. From a
life cycle management point of view, one can conclude that the “reuse” of LCA data
for LCC is a promising way to better integrate life cycle thinking into decision mak-
ing in industry and other organizations.
* Historically, a occulant that could provide higher dry material levels for the cake had a dosage, and
cost, penalty. A newer generation of synthetic materials, entering the market in approximately the year
2000, overcame this disadvantage, basically with improved solubility. These “advanced” materials
are so named as they permit the simultaneous improvement of the cost and environmental attributes
related to water treatment.
© 2008 by the Society of Environmental Toxicology and Chemistry (SETAC)
126 Environmental Life Cycle Costing
7.3.5 OVERVIEW OF TOOLS USED
The tools that were applied in this case study were life cycle assessment methodol-
ogy according to ISO 14040/44 (2006), life cycle inventory–based life cycle costing
according to Rebitzer (2005; see also Chapter 3 of this book), and physical-chemical
process modeling of wastewater treatment as presented in Braune (2002).
7.4 A COMPARISON OF ENERGY SAVING AND
INCANDESCENT LIGHT BULBS
7.4.1 S
UMMARY
This case study compares 3 types of bulbs (i.e., 2 different types of energy-saving
lamps and 1 incandescent lamp) using conventional LCC in combination with a
qualitative analysis of the ecological aspects (Günther and Kriegbaum 1999). The
data for the production of lamps are directly supplied from the producer. The case is
presented from the customer’s perspective.
7.4.2 DEFINITION OF THE CASE STUDY
In order to identify the best solution for lighting a room, the conventional LCC
method has been applied. As a basis for the calculation, an ofce with 50 sockets
for light bulbs with a maximum of 75W is chosen. All sockets were assumed to be
employed. The case study was conducted by a large German lamp producer in coop-
eration with academics in order to compare different types of lamps and to show the
economic superiority of energy-saving lamps.
In the analysis, 2 different types of energy-saving lamps (one high-price, high-
tech product and one low-price, low-tech product) are compared to a traditional
incandescent lamp. For data concerning the different types of lamps, see Table 7.6.
Furthermore, the duration of use per day and the days of use per month have to be
determined in order to calculate the use time in months or years. In the case study, 12
hours of use per day and 21 workdays per month were applied as bases.
In addition to the information provided above, the company supplied further
documentation concerning the amount of CO
2
produced in the production process of
TABLE 7.6
Life cycle costing data for 3 alternative bulbs
Alternative Incandescent lamp
Energy-saving lamps
Type 1 Type 2
Acquisition costs 1.20 € 15.45 € 7.60 €
Life span 1000 h 10000 h 3000 h
Energy consumption 75 watt 15 watt 30 watt
Energy costs 0.225 €/kWh 0.225 €/kWh 0.225 €/kWh
Disposal costs None 0.625 € 0.625 €
© 2008 by the Society of Environmental Toxicology and Chemistry (SETAC)
Life Cycle Costing Case Studies 127
the lamps. Therefore, in combination with the energy consumption data, an environ-
mental evaluation on the basis of CO
2
was also possible.
A conventional LCC, from the customer’s perspective, was the method of
choice. The costs included are acquisition price, energy consumption costs, and
disposal costs. The ination is considered with a rate of 2%, and a discounting
rate based on the cost of capital is used (4.7% per annum). Moreover, time (e.g.,
useful life) and performance (e.g., energy consumption) have to be considered as
well. All economic results are assessed using sensitivity analysis. The ecological
information (energy consumption for production and use, the related CO
2
equiva-
lents, the amount of waste produced, and hazardous materials) were assessed in a
qualitative way.
7.4.3 ENTRY GATE AND DRIVERS
The objective of the study was to assess the economic benets of the use of
energy-saving lamps as seen by the purchaser. Therefore, the results of the study
should promote the use of high-quality energy-saving lamps. Data for the case
study were provided from internal company sources (e.g., life span) and publicly
available sources (e.g., energy prices).
Normally, conventional LCC is used for expensive products or projects. This
case study shows the usefulness and impact of the LCC results even for day-to-
day utility-driven “services.” The impact of 1 lamp seems minor, though if one
considers the number of lamps used, the impact becomes large. In addition, the
identication of all relevant measures for the decision is important. Therefore, a
combination with an ecological assessment could be carried out to identify the
true relevance of the decision even if this is not the scope of conventional LCC.
It should be noted that this case, given its limited internalization of externalities,
and the reduced system boundary are neither, respectively, a societal nor an envi-
ronmental LCC.
7.4.4 IMPLEMENTATION
A problem arises from the existence of different prices for energy for different users.
Furthermore, the discounting rate is unique for every user. A fact that may inuence
the useful life is the duration of use per day and the number of switches. Costs for the
replacement of the lamps, potential inventory costs, and overheads (e.g., for ordering
lamps and acquiring information) are difcult to calculate; they are excluded from
this case study. One also has to deal with the different useful lives of the objects
analyzed (i.e., a benchmark has to be dened). The company supplying the data for
the case study intended to show the advantages (economic and ecological) of its new
products to potential customers.
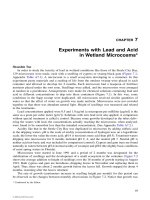
The results of the case study (see, for example, Figure 7.5) were included in the
advertisement of the company.
In addition, the absolute volume of the LCC costs of energy-saving lamps is
low compared to that of the incandescent lamp (see also Okada et al. 2002). For the
energy-saving lamp type 1, the LCC costs are approximately 32% of those of an
© 2008 by the Society of Environmental Toxicology and Chemistry (SETAC)
128 Environmental Life Cycle Costing
incandescent lamp (1808.68 €), and for the energy-saving type 2 lamp, they are 64%
(3595.06 €) of the LCC costs (5614.51 €).
The data can be further assessed using sensitivity and/or breakeven analysis.
Table 7.7 shows the results of such a breakeven analysis. Here the question is analyzed
when an energy-saving lamp (type 1) is no longer better than an incandescent lamp.
The LCC reveals that there may be a nancing problem in the short run (i.e., the
acquisition costs are higher), and this could inuence liquidity. Furthermore, it was
shown that LCC is a useful instrument to demonstrate economic consequences in
the long run and that it might be combined with an ecological assessment using the
same data.
7.4.5 OVERVIEW OF THE TOOLS USED
The conventional life cycle costing approach has been applied, as summarized in
Chapter 1. The results are calculated using Excel spreadsheets. The results are fur-
ther veried using breakeven and sensitivity analyses.
55.7
56
89.7
30.1
9.2
42.7
10.6
01.6
3.3
0
1.1
0%
20%
40%
60%
80%
100%
Disposal cost Energy cost Replacement cost Initial investment
Energy Saving Type 1 Energy Saving Type 2 Incandescent Lamp
FIGURE 7.5 Structure of life cycle costs for different lamps.
TABLE 7.7
Breakeven calculation for the type 1 (energy-saving)
versus type 2 (incandescent) lamp
Parameter Breakeven point
Price 91615 €
Energy consumption 71.6 W
Disposal cost 83.30 €
Monthly interest rate 19%
Energy price 0.0075 €/kWh
© 2008 by the Society of Environmental Toxicology and Chemistry (SETAC)
Life Cycle Costing Case Studies 129
7.5 DOUBLE-DECK CARRIAGE FLOOR (BAHNKREIS PROJECT)
7.5.1 S
UMMARY
The Bahnkreis project (Fleischer et al. 2000) was concerned with the development
of a method to operate railways in a sustainable way through the use of internal
life cycle cost and environmental assessments. The study involved the gathering of
interested parties and stakeholders through the life cycle of railway vehicles such as
railway consultants and scientists, railway-operating companies, as well as railway-
producing companies. Specically, this environmental LCC investigated life cycle
costs plus environmental impacts, via a life cycle assessment, of a double-deck car-
riage oor from a specic train system operating in Germany.
7.5.2 DEFINITION OF THE CASE STUDY
The investigation was motivated by the fact that decisions needed to be made on the
construction of the oor and on cleaning, maintenance, and disposal of the carriage.
It involved personnel from the railway carriage–producing company and the operat-
ing company.
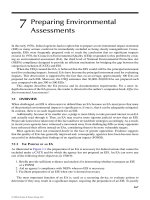
The oor in a double-deck railway carriage (i.e., load-bearing frame, cover,
nish, plywood, and aluminum structure) was investigated. Figure 7.6 provides an
illustration of the railway carriage. The oor was constructed from plywood with an
aluminum sandwich prole. The functional unit was 1 oor of a specic train operat-
ing in the Ruhrgebiet-Aachen area in Germany, with an annual operating distance of
377 238 km, and operating for 30 years. The oor measures approximately 42.5 m
2
and comprises a rubber coverage on a weight-bearing construction. A life cycle inven-
tory and life cycle costing were performed in parallel with the total life cycle costs,
arriving at 123374 € when discounted by 5%, and 248 000 € for the nondiscounted
costs (as is the norm for environmental LCC). The costs considered were production,
operation, cleaning, maintenance, modernization, and disposal. The purchase cost of
materials was found to be 3% of the overall life cycle costs, while cleaning and main-
tenance costs over the life cycle were 75% and use costs (allocated energy consump-
tion due to the weight of the oor) contributed 16%. Other information collected was
the reliability of oor covers to determine maintenance frequency.
The approach taken was to assess the life cycle costs on the basis of a life cycle
inventory. Therefore, the similarity in the functional unit and system boundary to
LCA, as well as the supplemental environmental analysis, renders this case an envi-
ronmental LCC. The materials within the inventory were multiplied with specic
prices, including working and machine hours in the inventory. Specic prices per
person-hour and machine-hour (distinguished by type of machine and type of work)
were also included. All other costs were allocated on the level of processes in the
inventory. The time (years) for each process was estimated. To do so, starting from
a maintenance regime (maintenance processes at scheduled time or distance inter-
vals), with stochastic additions by unplanned repairs due to component failures, and
completed by duration dened for every process, the inventory was modeled over
time. Inventory costs were aggregated per year and then discounted (5% rate) per
© 2008 by the Society of Environmental Toxicology and Chemistry (SETAC)
130 Environmental Life Cycle Costing
year. A software program was developed to enable the calculations. Figure 7.7 shows
combined results for the climate change indicator results and life cycle cost gures
for the oor, with a lifetime of 30 years.
The study was conducted by internal company sources in conjunction with an
external consultant and a university in Germany during 1998–2000. Personnel who
were involved included the railway consultants and scientists, the railway-operating
company, and railway-producing companies.
7.5.3 ENTRY GATE AND DRIVERS
The project’s entry gates comprised senior management and senior construction engi-
neers who were supported by external consultants and by a public project sponsor.
FIGURE 7.6 Floor in a double-deck carriage operating in Germany. Source:Picture cour-
tesy Bombardier Transportation.
© 2008 by the Society of Environmental Toxicology and Chemistry (SETAC)
50K
47.5
????
????
0.5
1999.5
758.5
610
480
526
2000
Life Cycle Costing Case Studies 131
In the railway sector, purchase costs make up only a small portion of the overall
costs of ownership and of the life cycle costs. Hence when answering a call for tender,
providing and guaranteeing life cycle costs in addition to purchase prices is becoming
increasingly common, and this can be viewed as the driver for the case. A reason for
launching the project was a fragmentation of individual solutions in industry and a need
for networking between industry, consulting, and railway operators. The environmental
assessment was added due to a general interest in the industry and was also motivated
by the project sponsor. In the case study, a lightweight metal frame was clearly prefera-
ble to a traditional wood construction, from both economic and environmental aspects.
7.5.4 IMPLEMENTATION
Several barriers existed with implementation. First, cost data are sensitive data and
their exchange along the supply chain can be a problem. Different cost denitions and
allocations of costs can hamper consistent decision support, as can the lack of adequate
tools for providing accepted and sound decision support gures. The process to achieve
change in the project included intensive, and open, communication between academia,
–6000
–4000
1)
2) 1,3) 2) 4)
–2000
0
2000
4000
6000
8000
10000
2000
2002
2004
2006
2008
2010
2012
2014
2016
2018
2020
2022
2024
2026
2028
2030
2032
Annual life cycle costs (€)
Traction-related energy costs (€)
Climate change potential (kg CO
2
-equiv.)
FIGURE 7.7 Results of life cycle costs (€) and climate change potential per year, for the
wooden oor variant. Note: Costs are discounted by 5%. 1) Negative potential due to incor-
porated CO
2
, 2) revision of the train, 3) modernization and reproduction of the oor, and 4)
disposal (waste incineration plant).
© 2008 by the Society of Environmental Toxicology and Chemistry (SETAC)
132 Environmental Life Cycle Costing
those involved in methodology, consultants, construction engineers, and middle man-
agement. It included the development of a tool for calculating the life cycle of a train,
over time, consistently for LCC and LCA. By the end of the project, understanding
between stakeholders was obtained. Continuity within the project team was an issue,
which hampered communication progress. A tool was developed and used by the proj-
ect partners. The tool incorporated methods for a consistent coupling of LCC and
LCA. The applicability of the tool and the methods developed could be demonstrated
with the case study, which showed a clear preference for a new construction variant.
A combination of different assessment methods allows coping with different
backgrounds and interests in interdisciplinary projects and allows answering pur-
chase or product design questions that inuence a multitude of different areas such as
costs and the environment. It was important that there existed a general understand-
ing and trustworthiness in the tool’s result prior to using it to make decisions.
7.5.5 OVERVIEW OF THE TOOLS USED
The tools applied in this case study were life cycle assessment according to ISO
14040/44 (2006), Siemens’ compass method, life cycle costing, and relative costing
according to VDI (1984). For more information on the software tools developed,
refer to Ciroth (2002) and Ciroth et al. (2003). The later includes specications of the
Siemens’ compass method as used in the Bahnkreis project.
7.6 WASHING MACHINES
The case study described in this section is based on real data, as were the preced-
ing 4 applications. This case serves as a basis for the idealized case study boxes that
can be found throughout the book. In order to prepare boxes that illustrate the wide
range of LCC applications and the impacts of different methodological choices, the
case at hand was partly extended with assumptions of the authors (Table 7.8). The
real case documents a conventional LCC, while the hypothetical extensions lead to
environmental and societal LCC, respectively.
The following description refers only to the underlying real case on a summary
level. A detailed description of the complete study can be found in Rüdenauer et al.
(2004) and Rüdenauer and Gensch (2005a). A description of the study that was another
basis for the case study boxes can be found in Rüdenauer and Grießhammer (2004).
7.6.1 SUMMARY
The study “Eco-Efciency Analysis of Washing Machines — Life Cycle Assessment and
Determination of Optimal Life Span,” conducted by Öko-Institute for the manufacturers
Electrolux-AEG Hausgeräte GmbH and BSH Bosch und Siemens Hausgeräte GmbH
(Rüdenauer et al. 2004), aimed to answer, among others, the following questions:
1) What are the environmental impacts of a washing machine over its whole
life cycle (production, distribution, use, and end-of-life treatment)?
2) Does it make sense from the economic and the environmental points of view
to further use an old washing machine, or is it better to buy a new one?
© 2008 by the Society of Environmental Toxicology and Chemistry (SETAC)
Life Cycle Costing Case Studies 133
TABLE 7.8
Overview of all washing machine case study boxes: real case study and hypothetical extensions
Case study box Section Theme Real case study
Hypothetical additional features of environmental
and societal LCC
1 1.4.1 Goal and scope
denition
Consumer oriented, government and society oriented
(Rüdenauer and Grießhammer 2004)
Manufacturer, supplier, and end-of-life service
provider–oriented
2 2.3 Cost categories Main cost categories, 3rd and 4th level (Rüdenauer
and Grießhammer 2004; Kunst 2003)
Some cost categories of manufacturer and end-of-life
service provider
3 2.4 Perspectives Consumer perspective (Rüdenauer and Grießhammer
2004)
Different perspectives of manufacturer, and
government and society
4 2.6.1.1 Long-term discounting
of results
Not available Discounted result
5 3.3.3 Calculation with
discounted cash ow
Discounted cash ow (Rüdenauer and Gensch
2005a)
Not necessary
6 3.3.4 Calculation of life
cycle costs
Calculation equation not revealed Equation for calculation and aggregation of life cycle
costs
7 3.4 Different types of LCC Conventional LCC (Rüdenauer and Grießhammer
2004), LCIA (Kunst 2003)
Environmental LCC, parts of conventional LCC, and
societal LCC
8 3.5.2.2 Input–output analysis Internal cost (Kondo and Nakamura 2004) Carbon tax considered
9 4.4 Externalities and
internalizing
externalities
Not available Externalities
10 5.2 Presentation of LCC
results
Consumer perspective (Rüdenauer and Grießhammer
2004)
Whole life cycle
© 2008 by the Society of Environmental Toxicology and Chemistry (SETAC)
134 Environmental Life Cycle Costing
To answer the rst question, an existing LCA study of 1995 has been updated,
and additionally an LCC has been conducted. To answer the 2nd question, the fur-
ther use of washing machines of different ages has been compared with the acquisi-
tion and use of a new washing machine bought in 2004.
7.6.2 DEFINITION OF THE CASE STUDY
Due to technological advances during the past 10 to 15 years, in both washing
machines and detergents, signicant reductions of energy and water consumption
could be realized in the eld of private laundry. LCA has shown that the use phase
is dominant compared to the production or end-of-life phase of washing machines.
However, these LCA results are relatively old. In the meantime, several parameters
affecting the results of the LCA may have changed: for example, machine technol-
ogy has changed (more plastic and electronic components), and through the WEEE
directive the end-of-life management of washing machines is modied and consumer
behavior (choice of washing temperature and loading) has also evolved.
Against the aforementioned background, 2 major tasks of the study were to
update the LCA for washing machines and to additionally calculate the life cycle
costs (task 1) and to analyze if it makes sense to further use an old washing machine
or if it is better (in environmental and economic terms) to buy a new one (task 4 of
the study).* In a supplementary study (Rüdenauer and Gensch 2005a), task 4 was
rened with more detailed data, and several sensitivity analyses were conducted.
For task 1 (which serves as a base model for task 4), the environmental impacts
and costs were calculated for a “current” washing machine model of 2004. The func-
tional unit was dened as “washing of 8080 kg of laundry (i.e., the amount of laundry
that can be washed within the life span of a washing machine) in a private household
of 3 people.” The life cycle costs were calculated under private households’ perspec-
tive. Therefore, the costs for production and delivery of the washing machine were
not examined in detail. Instead, the transfer price of a washing machine was taken.
Table 7.9 provides an overview of the considered costs.
The costs over the total life span of 2000 washing cycles were calculated (without
discounting of the future costs) as the rst deliverable or task in the project. In the case
of a household of 3 people (175 washing cycles per annum), this results in 11.4 years.
Figures 7.8 and 7.9 show the cumulative energy demand (CED, representing 1
environmental aspect) and the life cycle costs as results of the conducted LCA and
LCC. Table 7.10 summarizes the cumulative energy demand and the life cycle costs.
The most obvious result from this comparison is the difference of the contribution
of the production or acquisition, the energy supply, and the water supply to the total
CED and the total costs respectively.
The environmental impacts and the costs of the use of existing washing machines
in stock were compared (task 4 of the project) to those of the production or purchase
* Two other tasks (which are not of particular interest with regard to the examples chosen in the case
study boxes) were to compare the environmental and economic consequences of using a washing
machine with a rated capacity of 5 kg with those of using a larger washing machine (task 2), and to
determine the optimal life span of a washing machine regarding the next approximately 20 years (tak-
ing into account potential future developments; task 3).
© 2008 by the Society of Environmental Toxicology and Chemistry (SETAC)
Life Cycle Costing Case Studies 135
and the use of a “current” washing machine. Therefore, the time required to save the
additional impacts and costs caused by the acquisition of a new washing machine
with potentially lower environmental impact and costs during the use phase was
analyzed. Here, in addition to the washing process, the drying of clothes was also
included, as the energy consumption of the drying process is inuenced by the spin
speed of washing machines, which also increased during recent years.
TABLE 7.9
Overview of the costs considered in the washing machine case study
Cost category Cost per unit Comment
Acquisition costs 500 €/machine Internet research (in 2004)
Energy supply 0.18 €/kWh Own compilation (in 2/2003), linear increase to
0.249 €/kWh in 2020
Water supply (including
wastewater treatment)
4 €/m
3
Own assumption, increase by 2% per annum
Detergent supply — Not considered, as being irrelevant for task 4
Repair and maintenance — Not considered due to data uncertainty
Disposal 0 € Disposal free of charge in most German cities; according
to WEEE, the costs will be borne by manufacturers.
CED (prod.
& use washing machine)
17%
77%
4%
2%
0%
Material supply (production)
Manufacturing (production)
Distribution (production)
Energy supply (use phase)
Water supply (use phase)
FIGURE 7.8 CED of the life cycle phases of a washing machine (without considering recy-
cling credits).
Life Cycle Costs
43%
22%
35%
Acquisition
Energy supply (use phase)
Water supply (use phase)
FIGURE 7.9 Life cycle costs of a washing machine.
© 2008 by the Society of Environmental Toxicology and Chemistry (SETAC)
136 Environmental Life Cycle Costing
The functional unit was dened as “washing and drying of annually 707 kg of
laundry (i.e., the annual amount of laundry in a household of 3 people) over a period
of 10 years in a private household of 3 people.” Five options were compared: the
further use of 4 washing machines of different ages (bought in 1985, 1990, 1995,
and 2000), and the acquisition and use of a new one in 2004. For each option, the
environmental impacts and the life cycle costs were calculated on an annual basis
(per year). These annual values are then cumulated to give the total environmental
impacts and costs after 1, 2, 3, and up to 10 years of use. All future annual costs (costs
for energy and water demand for the washing process, costs for the energy demand
of the drying process, and, where applicable, the acquisition costs) that occur in the
years between 2004 and 2025 were discounted with an annual discount rate of 5% to
give the net present value (NPV) in 2004.
Table 7.11 and Figure 7.10 show the cumulated energy demand of the 5 options. It
can be seen that the differences of the CED between the alternatives are quite small.
Nevertheless, the additional CED for the production of a new washing machine is
amortized in all cases within the following 10 years. The years where the acquisi-
tion of a new washing machine in 2004 is amortized are highlighted in gray in the
tables.
Table 7.12 and Figure 7.11 summarize the life cycle costs for the aforementioned
5 options. One can observe that the life cycle costs skewed toward longer time frames
than the CED owing to the fact that there is an acquisition cost that inuences the
economic (LCC) variable at the outset, though it does not apply to the environmental
(CED) impact to such a high extent. This LCC demonstrates the need for consider-
ation of marginal costs (i.e., given the fact that the washing machine functions and
alternatives are compared).
7.6.3 ENTRY GATE AND DRIVERS
Both studies were commissioned by the household appliances industry, and hence
the entry gate was from the private sector. The rst initiative started on a national
TABLE 7.10
CED and LCC of the production or acquisition and use of a washing machine
Item CED (per washing machine) LCC (per washing machine)
Material supply (production) 3074 MJ —
Manufacturing (production) 406 MJ —
Distribution (production) 28 MJ —
Subtotal production or acquisition
costs
3508 MJ 500 €
Energy supply (use phase) 13248 MJ 262 €
Water supply (use phase) 711 MJ 406 €
Subtotal use phase 13959 MJ 746 €
Total 17567 MJ 1221 €
© 2008 by the Society of Environmental Toxicology and Chemistry (SETAC)
Life Cycle Costing Case Studies 137
TABLE 7.11
Cumulated CED for the use of an old or new washing machine
CED (in MJ) (base case)
2004 2005 2006 2007 2008 2009 2010 2011 2012 2013
1985
6.937 13.860 20.766 27.658 34.534 41.395 48.240 55.070 61.884 68.684
1990
6.436 12.857 19.264 25.657 32.036 38.400 44.750 51.086 57.408 63.715
1995
6.161 12.308 18.441 24.561 30.667 36.759 42.838 48.903 54.954 60.992
2000
5.675 11.338 16.988 22.625 28.250 33.862 39.462 45.049 50.624 56.186
2004
7.994 13.260 18.516 23.759 28.991 34.211 39.419 44.616 49.801 54.975
Cumulated CED
0
10.000
20.000
30.000
40.000
50.000
60.000
70.000
80.000
90.000
Year
MJ
1985 1990
1995 2000 2004 (new)
2004 2005 2006 2007 2008 2009 2010 2011 2012 2013
FIGURE 7.10 Cumulated primary energy demand: old versus new washing machine. Note:
The depicted alternatives are “1985,” “1990,” “1995,” and “2000”: further use of the existing
washing machine manufactured (and purchased) in the respective year; and “2004”: purchase
of a new washing machine in 2004.
(German) level, then the topic was extended to the European level. Tasks 1 and 4
were meant to evaluate the benets of an accelerated replacement of large household
appliances in stock under environmental and economic perspectives. The authors
believe the results could foster an early replacement initiative by industry or govern-
ment (e.g., support of the replacement of the old appliance by publicly funded rebate
schemes) on a European level. The driver, therefore, for the project was the industry
sector with a view toward a stakeholder approach to improving the environmen-
tal portfolio of the product. The drivers also include a desire for public communi-
© 2008 by the Society of Environmental Toxicology and Chemistry (SETAC)