Atmospheric Acoustic Remote Sensing - Chapter 7 docx
Bạn đang xem bản rút gọn của tài liệu. Xem và tải ngay bản đầy đủ của tài liệu tại đây (606.09 KB, 15 trang )
197
7
RASS Systems
Radio acoustic sounding systems (RASSs) are remote-sensing systems for the mea-
surement of the temperature prole in the lower atmosphere. RASSs are deployed
routinely in experiments and at monitoring sites as a simple addition to either a
SODAR (SOund Detection And Ranging) or a RADAR windproler.
The essential feature of a RASS system is that it has an acoustic transmitter and
a RADAR transmitter–receiver. The electromagnetic (EM) energy is reected by the
periodic refractive index variations created by the compressions and expansions of
the air within the acoustic pulse. The RADAR wavelength is chosen to be half the
acoustic wavelength so that EM reections from successive acoustic compressions
will combine in phase, giving a strong RADAR signal. By monitoring the acoustic
properties, the speed of sound is deduced and hence the temperature.
One type of RASS, the Doppler-RASS, tracks an acoustic pulse with continuous
EM waves. The Doppler effect provides a frequency shift which is used to determine
sound speed and hence air temperature. Because of the continuous nature of the
tracking wave, the EM transmitter and receiver are separate units.
An alternative design uses a continuous acoustic wave together with EM pulses.
The echo is strongest when the acoustic and EM waves match the Bragg condition. The
Bragg-RASS consists of an EM transmitter and acoustic transmitter and receiver units.
Other variants with continuous acoustic transmission and modulated EM trans-
mission, or with both acoustic and EM pulsed transmissions, are also possible. A
very good review is given by Kirtzel et al. (2000) (also see Vogt, 1966).
Because there is a combination of both acoustic and EM parameters here, we will
use the subscript “a” for acoustic parameters and the subscript “e” for EM param-
eters. This means that the previous use of c for speed of sound is replaced by c
a
in
this chapter, and similarly for wavelength, frequency, and wavenumber.
7.1 RADAR FUNDAMENTALS
Historically RADAR was rst used to track solid objects such as aircraft, and later
precipitation was measured. Both these RADAR technologies rely on the measure-
ments of the echo strength. When Doppler shift was rst measured, wind speeds
became accessible to measurements. Generally shorter wavelengths are used to
obtain high reectivity from hydrometeors and longer wavelengths to obtain high
reectivity from clear air refractive index changes. A good coverage of Doppler
RADAR is given by Doviak and Zrnic (1984).
All RADARs, including the RASS-RADAR, use a stabilized local oscillator to
generate a continuous signal which is modulated and amplied and fed to a klystron
to produce a powerful microwave signal. Generally the transmitter is at the focus of
a parabolic dish antenna so that a narrow beam is produced, and the receiver uses
a comparable (or the same) dish antenna to provide a reasonable collecting area for
scattered radiation and to focus the return signal onto a microwave receiver.
3588_C007.indd 197 11/20/07 4:16:06 PM
© 2008 by Taylor & Francis Group, LLC
198 Atmospheric Acoustic Remote Sensing
7.2 REFLECTION OF RADAR SIGNALS FROM SOUND WAVES
The power scattered back to a conventional RADAR from the atmosphere is
described by a RADAR equation which is similar to the acoustic radar equation
described in Chapter 4:
PPGA
c
r
Reee s
T
S
A
2
2
2
e
r
, (7.1)
where P
e
is the transmitted power, G
e
the antenna transmitting efciency into a solid
angle, A
e
the effective receiving area, cU the length of the pulse in the atmosphere, r
the range (generally taken to be the height z), B is an atmospheric absorption coef-
cient, and T
s
is the scattering cross-section.
However, when the acoustic source and the radar are (almost) collocated, and
under the ideal conditions that the wavefronts of both the acoustic and radar waves
are spherical with their center at the source point, the radar energy back-scattered
from the acoustic wave will come to a focus at the radar set. This is in contrast
to the r
–2
one-way spreading loss associated with scattering from naturally occur-
ring dielectric uctuations of the atmosphere such as is associated with clear air
turbulence.
This means that the equivalent RASS equation needs to follow a slightly differ-
ent argument to nd P
R
. For example, the EM power incident on a Doppler-RASS
acoustic pulse at range r is, for a RADAR half beam width ∆R, P
e
G
e
[∆R/4π]
2
and the
EM intensity is P
e
G
e
[∆R/4π]
2
/4πr
2
. If the scattering cross-section per unit volume is
T
s
, then the power scattered back to the RASS antenna is P
e
G
e
T
s
NM
a
[∆R/4π]
2
/4πr
2
.
The number of cycles in the acoustic pulse is N, so the length of the acoustic pulse
is NM
a
.
The scattering cross-section, in general, includes Rayleigh scattering from pre-
cipitation particles (which has a L
e
4
dependence) and scattering from atmospheric
refractive index uctuations. A structure function parameter C
n
2
for EM refractive
index can be dened similarly to C
V
2
and
C
T
2
in Chapter 2:
C
nx n
x
n
2
2
23
0
[() ()]
.
/
(7.2)
The scattering cross-section per unit volume, T
s
, for refractive index changes
has dimensions of m
–1
. Physically, it can be expected to depend on C
n
2
(which has
dimensions of m
–2/3
) and the EM wavelength M
e
. A dimensional analysis gives
SL
s
| C
n
213
e
/
.
(7.3)
The proportionality constant is 0.38 (Hardy et al., 1966).
The refractive index of air at RADAR wavelength can be written as (Bean and
Dutton, 1966)
n
T
p
e
T
atm
r
¤
¦
¥
¥
¥
´
µ
µ
µ
1
77 6 10
4810
8
.
,
(7.4)
3588_C007.indd 198 11/20/07 4:16:16 PM
© 2008 by Taylor & Francis Group, LLC
RASS Systems 199
where p
atm
is the air pressure in Pa, T the air temperature in K, and e the partial pres-
sure of water vapor in Pa. Since typically p
atm
= 10
5
Pa, e = 10
3
Pa, and T = 280 K,
the moisture term is usually relatively minor.
If temperature uctuations dominate, which is often the case for turbulence, and
ignoring the moisture terms
$$n
p
T
T
atm
r
77 6 10
8
2
.
.
This provides a rst-order connection between C
n
2
and C
T
2
as
C
p
T
C
n
atm
T
2
8
2
2
2
77 6 10
y
r
¤
¦
¥
¥
¥
¥
´
µ
µ
µ
µ
.
.
(7.5)
There are three different mechanisms for scattering of EM radiation in clear air
(Larsen and Rottger, 1991). Fresnel reection is caused by a strong discontinuity of
the refractive index perpendicular to the RADAR beam. Discontinuities in the atmo-
spheric refractive index are usually in horizontal layers. With increasing zenith angle
of the RADAR beam, the reectivity due to horizontal layer discontinuities decreases
rapidly. The relation between reected power and elevation angle is called the aspect
ratio. Within a scattering volume Fresnel scattering is caused by multiple discontinui-
ties along the beam. For common RADARs, both Fresnel scattering and simple reec-
tion are very small, which leaves Bragg scattering as the dominating mechanism.
Bragg scattering is caused by uctuations of the refractive index having a spatial
scale of M
e
/2. In the case of RASS instruments, the scattering is from an acoustic
pulse, so the scattering cross-section is from the acoustic wave variations. These
depend in amplitude on the transmitted acoustic power P
a
, and have both pressure
and temperature variations associated with them.
From (7.4) and ignoring moisture, we obtain
$
$
$
n
n
p
T
p
T
T
atm
r
¤
¦
¥
¥
¥
¥
´
µ
µ
µ
µ
yr
77 6 10 2 7 1
8
2
009810
97
r$$pT.,
where it is assumed a standard atmosphere pressure of p
atm
≈ 1.013×10
5
Pa and
T = 283 K. Also, from Chapter 2, the hydrostatic equation gives
$$pgzR
and the adiabatic lapse rate gives $$Tgzc
p
/ which, when combined, give
$$ $Tpc p
p
yr
/ R 810
4
. The net result for sound waves, which undergo adia-
batic expansions and compressions, is
$
$
n
n
pyr
210
9
. (7.6)
For an acoustic wave, the amplitude of pressure variations ∆p is related to the
acoustic intensity I
a
through $pcI 2R
aa
. The acoustic intensity is just the acous-
tic power transmitted divided by the area at distance r, so
3588_C007.indd 199 11/20/07 4:16:26 PM
© 2008 by Taylor & Francis Group, LLC
200 Atmospheric Acoustic Remote Sensing
$n
n
cI c
GP
r
yr r y
r
210 2 210 2
4
16 10
99
2
RR
P
aa a
aa
.
88
r
GP
aa
.
The amplitude of scattered EM radiation depends on the refractive index varia-
tion n, and so the scattered intensity depends on (n)
2
. In Chapter 2, it was found
that interaction between a sinusoidal acoustic pulse and refractive index uctuations
gave a sinc function for amplitudes
sin[( ) / ]
()/
.
22
22
kc
kc
KT
KT
For a Doppler-RASS, the length of the acoustic pulse is cU = NM
a
, the wavenum-
ber k of the interrogating wave is k
e
, and the spatial wavenumber of the uctuations
is k
a
. The scattering cross-section therefore has the form
S
L
L
s
ea
ea
a
a
|
sin[( ) / ]
()/
22
22
kkN
kkN
ê
ô
ơ
ằ
ẳ
r
Đ
â
ă
ă
ă
ã
ạ
á
á
á
2
8
2
2
16 10
2
.
()
r
GP N r
G
aa a
LQ$
|
aaa a
ea a
ea a
PN
kkN
kkN
L
L
L
sin[( ) / ]
()/
22
22
ê
ô
ơ
ằ
ẳ
2
2
().$Q
(7.7)
Note that this peaks sharply at the Bragg condition
22kk
ea e a
,.LL (7.8)
The NM
a
(2rR)
2
term represents the volume illuminated at range r by a beam of
half-beam-width R:
P
PG PG N
r
R
a
e
eeaa
|
L
L
Q
Ô
Ư
Ơ
Ơ
Ơ
Ơ
ả
à
à
à
à
2
44 2
2
() sin[($ 222
22
2
kkN
kkN
L
ea a
ea a
ê
ô
ơ
ằ
ẳ
)/]
()/
L
L
(().r
(7.9)
The M
e
factor arises because the efciency of an EM antenna depends on wavelength.
The exponential absorption term has been replaced by L(r) which represents losses
due to scattering out of the beam and depends on C
n
2
. This term determines the
range limitation of the RASS. Clifford and Wang (1977) give a full derivation of P
R
,
which is an extension of the derivation by Marshall et al. (1972).
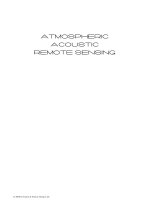
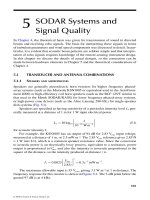
The dependence on the pulse length and the Bragg condition in (7.9) is of the form
sin ( ( / ) )
(( / ) )
Nkk
kk
21
21
ea
ea
;=
ê
ô
ơ
ằ
P
P
ẳẳ
2
.
This is plotted in Figure 7.1.
3588_C007.indd 200 11/20/07 4:16:34 PM
â 2008 by Taylor & Francis Group, LLC
RASS Systems 201
7.3 ESTIMATION OF MEASURED HEIGHT
The RASS unit sends out an acoustic wave in the vertical direction. The propagation
speed of the acoustic wave depends on the temperature and moisture composition
of the atmosphere. The following is based on the description provided by Metek for
their DSDPA.90 SODAR/MERASS.
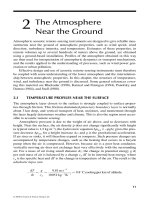
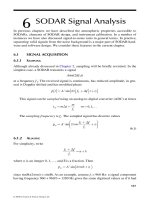
Given that the EM wave is continuous for a Doppler-RASS, the actual measure-
ment height z
r
is determined from the time t
a
elapsed after the transmission of the
acoustic pulse, as shown in Figure 7.2.
zctt
r
tzc
°
a
ae
() .
/
d
0
(7.10)
The average sound speed over this height range is given by
c
ct t
tzc
tzc
r
r
a
a
ae
ae
°
()
/
.
/
d
0
(7.11)
From (7.10) and (7.11),
zct
z
c
ct
cc
ct
r
r
¤
¦
¥
¥
¥
´
µ
µ
µ
µ
y
aa
e
aa
ae
aa
1/
.
(7.12)
To calculate
c
a
, either (7.11) is used based on the RASS measurements or the sound
speed derived from a nearby surface temperature (ideally also a humidity sensor)
can be used.
From the frequency shift ∆f of the reected EM waves of wave number k
e
, the
local sound velocity c
a
is derived from the Doppler equation
–10
0
10
20
30
40
50
1.8 1.9 2 2.1 2.2
k
a
/k
e
dB
FIGURE 7.1 The sensitivity of received power to the Bragg condition for N = 100 (ne line)
and N = 300 (dark line).
3588_C007.indd 201 11/20/07 4:16:40 PM
© 2008 by Taylor & Francis Group, LLC
202 Atmospheric Acoustic Remote Sensing
$f
c
c
f
ckc
e
a
e
e
a
e
a
22
LP
e
. (7.13)
This sound speed also contains effects from humidity uctuations and the wind
speed along the beam. If the value of the vertical wind speed is larger than the mea-
surement error, the sound speed can be corrected for this effect. However the vertical
wind speed is usually very small.
7.4 DEDUCTION OF TEMPERATURE
7.4.1 D
OPPLER-RASS
From Chapter 3, the speed of sound is related to the temperature by
c
RT
M
e
p
Ô
Ư
Ơ
Ơ
Ơ
Ơ
ả
à
à
à
à
Đ
â
G
E
dry air
dry air
11
2
35
ăă
ă
ă
ã
ạ
á
á
á
yy
G
dry air v
msRT T
dv
20 05
1
(7.14)
Besides the second-order effects of humidity and vertical wind, there are some
third-order variations caused by the ideal gas approximation, cross-wind inuence,
cross-wind/turbulence, and turbulence. Sound velocity is, from (7.13),
cf
c
f
ae
e
e
$
2
.
Typically, f
e
= 1290 MHz, c
e
= 3ì10
8
ms
1
, and c
a
340 m s
1
, so f
e
3 kHz.
In the Metek RASS, the received signal is mixed with f
m
and low-pass ltered to
give an audio frequency signal, which is much easier to process. First the local air
temperature T
s
is measured at the surface and then the expected frequency shift f
s
= (f
e
)
surface
calculated from (7.13) for this surface value of sound speed c
s
. Then the
mixing frequency is set at f
m
= f
e
+f
s
. The result of the mixing process is to produce
a spectrum centered on f
beat
= f
e
f
m
= f
s
(recall that, since the sound is moving
away from the RASS, f
s
is negative). At the surface, the spectrum will have a peak
at 0 Hz. The sound speed is now calculated from
z
z
r
(dz/dt)
sound
= c
a
(dz/dt)
EM
= c
e
0
0
t
r
t
a
z
r
/c
e
t
FIGURE 7.2 The timing of acoustic and EM signals propagating to and from height z
r
.
3588_C007.indd 202 11/20/07 4:16:44 PM
â 2008 by Taylor & Francis Group, LLC
RASS Systems 203
cf f
c
f
abeat
e
e
(),$
2
(7.15)
where ∆f is the rst moment of the spectrum (the frequency shift of the spectral peak
from the center of the spectrum). In practice, f
beat
is forced to the nearest spectral
estimation frequency, since this removes any initial systematic bias. Note that, since
f
e
= 1290 MHz is a frequency allocated to this type of instrument, the Bragg condi-
tion implies
f
kc kc
f
c
c
a
aa ea
e
a
e
2
2
2
2
PP
.
(7.16)
Based on c
a
≈ 340 m s
–1
and c
e
= 3×10
8
ms
–1
, this gives f
a
= 2924 Hz. Therefore
an acoustic frequency of close to 3 kHz needs to be transmitted. A Doppler-RASS may
also have modulation of the acoustic pulse to help obtain a Bragg condition match.
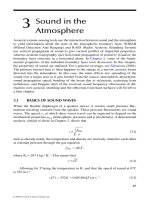
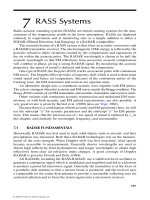
7.4 . 2 BRAGG-RASS
The Bragg-RASS uses a continuous acoustic wave and a pulsed EM signal. Con-
sider an acoustic pressure peak at a height z at time t, as shown in Figure 7.3. At time
M
a
/c
a
this pressure peak has moved upward to height z + M
a
. Now the continuous
acoustic wave looks exactly as it did at time t. This means that EM reections from
the acoustic wave will be identical at time t and at time t + M
a
/c
a
. The variations in
the amplitude of the scattered EM wave must therefore have a period of M
a
/c
a
. This
means that
$f
c
e
a
a
a
f.
L
(7.17)
The rather surprising result is that the Doppler shift equals the acoustic frequency
and the Doppler shift provides no information on temperature structure. Instead, the
+
/
FIGURE 7.3 The time taken for identical reected EM amplitude from the continuous
acoustic wave in a Bragg-RASS.
3588_C007.indd 203 11/20/07 4:16:49 PM
© 2008 by Taylor & Francis Group, LLC
204 Atmospheric Acoustic Remote Sensing
change in sound speed is sensed by modulating the acoustic frequency or providing
sufcient acoustic bandwidth so that the Bragg condition is bracketed by the range in
f
a
. Then the peak in the EM spectrum indicates the frequency at which
$f
c
e
a
e
|.
max
2
L
(7.18)
7.5 WIND MEASUREMENTS
It is possible to use a RASS system to also measure wind proles, in exactly the same
manner as described for monostatic SODARs. Typically four tilted beams and one
vertical beam are used for both acoustic transmission and EM scattering. The off-
vertical beams introduce an extra Doppler shift corresponding to the radial velocity.
The horizontal and vertical wind components can then be measured in analogy to
the 5-beam SODAR principle.
7.6 TURBULENCE MEASUREMENTS
Sound speed uctuations in the vertical direction are dominated by wind speed
uctuations even under convective conditions. The contribution of steady convec-
tive updrafts or downdrafts is about 10% in strongly convective conditions and can
therefore be neglected. RASS therefore yields the turbulent vertical wind uctua-
tions (Kirtzel et al., 2000).
7.7 RASS DESIGNS
Table 7.1 summarizes typical parameters of the two RASS types (Engelbart, 1998).
Various physical layouts have been used. One of the problems to be addressed
is that the sound spreads out from the acoustic source in a spherical wave. Reec-
tion of the EM wave from the spherical acoustic wave focuses the scattered energy
back toward the ground. If there is a horizontal wind, then the spherical wave moves
TABLE 7.1
Typical RASS parameters
Doppler-RASS Bragg-RASS
Frequency modulation Acoustic signal RADAR signal
Height z estimated from Time since acoustic pulse t
a
Travel time of EM pulse t
e
Frequency shift ∆f
e
= 2f
e
c
a
/c
e
∆f
e
= f
a
Sound speed c
a
= c
e
∆f
e
/2f
e
c
a
= c
e
∆f
e
|
max
/2f
e
Typical EM frequencies 482, 915, 1270–1295 MHz 404 and 915 MHz
Typical maximum range 200 m AGL 13 and 1 km, respectively
Typical resolution 30 m 300, 150 m
Antenna diameters 1.5 m 12, 100 m
3588_C007.indd 204 11/20/07 4:16:50 PM
© 2008 by Taylor & Francis Group, LLC
RASS Systems 205
downwind and so does its focus. This
means that the RASS gradually loses
extra (compared to the normal spheri-
cal spreading and scattering losses)
signal strength as the height increases
(Lataitis, 1992). The situation is shown
in Figure 7.4. The Metek RASS (Fig-
ure 7.5) uses the conguration shown in
Figure 7.6.
A conguration using one EM trans-
mitter or windproler and four acoustic
antennae is shown in Figure 7.7. Wind
direction determines which acoustic
antenna serves as the acoustic transmitter (Angevine et al., 1994). Another approach
is to have two EM prolers with one acoustic antenna and, depending on wind direc-
tion, the whole instrument can be rotated around its axis. The wind speed determines
the distance between proler and acoustic antenna (Vogt, 1966) as shown in Fig-
ure 7.8. In this system, both bistatic and monostatic congurations can be used, and
both RADAR and SODAR can be continuous and/or pulsed. Also various kinds of
frequency modulation can be applied to either RADAR or SODAR signals. Bistatic
arrangements can overcome wind drift effects to a certain extent (improve the range
by a factor of 4). Bistatic systems enable measurement of horizontal wind speed and
direction by measuring delay times between the different antenna sites. Combina-
tions of bistatic and monostatic congurations have been developed to overcome
orientation problems of bistatic systems.
RASS
Acoustic
wave
Wind
FIGURE 7.4 Movement of the focus
downstream.
FIGURE 7.5 The Metek MERASS.
3588_C007.indd 205 11/20/07 4:16:52 PM
© 2008 by Taylor & Francis Group, LLC
206 Atmospheric Acoustic Remote Sensing
7. 8 AN TE NNA S
The EM transmitter/receiver can either
be a dedicated RADAR or an EM wind-
proler which is also obtaining wind
information from back-scattered EM
radiation (Skolnik, 2001; Klaus et al.,
2002). For dedicated RADAR units, the
transmitted dish and receiver dish are
generally separated, as for the Metek unit
in Figure 7.5. A common transmitter/
receiver unit would struggle with over-
load problems. Dish separation distance
is typically two to three aperture diam-
eters (4–6 m for a 1290 MHz system).
This conguration is strictly speaking
bistatic, and scattering is not 180° and
is also height-dependent. The Metek
MERASS uses EM radiation “leaked”
from the side of the transmitter unit, and
received by the other dish, as a reference
signal to beat with the signal scattered
off the acoustic pulse, so as to form an
audio frequency Doppler shift signal.
A trailer-mounted Metek RASS system
is shown in Figure 7.9. The receiving
dish can be seen in the foreground and
the edge of the transmitting dish at the
other end of the trailer. The center of the
trailer is occupied by a SODAR, with
thnadners, which operates as a SODAR
at 1750 Hz and as a RASS acoustics unit
at 3 kHz. The units covered with white
plastic in the foreground are PC and
amplier units. Beyond the trailer is a
smaller Metek SODAR.
RADAR
transmitter
RADAR
receiver
Acoustic array
FIGURE 7.6 The layout of the Metek RASS.
Wind Profiler
Acoustic
Acoustic
Acoustic
Acoustic
FIGURE 7.7 A RASS conguration which
uses the best of four acoustic antennas,
depending on the wind direction.
FIGURE 7.8 A turntable RASS with the
axis of operation aligned with the wind.
3588_C007.indd 206 11/20/07 4:16:54 PM
© 2008 by Taylor & Francis Group, LLC
Acoustic
Array
Wind profiler
Wind profiler
Rotation
Turn table
Translation
RASS Systems 207
7. 8 .1 BAFFLES
EM screening is sometimes required for RASS units (Skolnik, 2001). For exam-
ple, Figure 7.10 shows an Atmospheric Research Pty. Ltd. RASS (the surrounding
fence is not normally required).
7.9 LIMITATIONS
See Angevine and Ecklund 1994.
FIGURE 7.9 A Metek SODAR/RASS mounted on a trailer, together with a smaller
Metek SODAR.
FIGURE 7.10 Screening required between EM transmitter and receiver on an Atmospheric
Research Pty. Ltd. RASS.
3588_C007.indd 207 11/20/07 4:16:55 PM
© 2008 by Taylor & Francis Group, LLC
208 Atmospheric Acoustic Remote Sensing
7.9.1 RANGE
The maximum altitude covered by a RASS system depends on its wavelength and
meteorological conditions. Usually the range is determined by the drift of the acous-
tic wavefront with the horizontal wind. Consider the case time t after transmission
of the acoustic pulse. The acoustic wave has moved distance ut downstream, where u
is the wind speed. From symmetry in Figure 7.4, when a ray from the RASS reects
from the center of the curved acoustic wave, distance ut downstream, the reected
ray reaches the ground distance 2ut downstream. In the same time, the acoustic
pulse has reached a height z = c
a
t. The result is that the drift of the focus downstream,
when the reection is from a height z, is
D
uz
cz
z
z
°
2
0
()
()
.
a
d
(7.19)
When the focus leaves the receiving antenna aperture, the received power drops
drastically. The focus is not perfect though, and atmospheric turbulence tends to
spread out the acoustic pulse. The best atmospheric condition is buoyancy-driven
turbulence at low wind speed, whereas the opposite is true for low turbulence at high
wind speed. Only occasionally does RASS range reach as high as 1.5 km. The upper
limit is imposed by the attenuation of the sound waves, distortion of the acoustic
wave fronts by turbulence, and advection of the sound out of the RADAR beam. The
vertical air velocity measurements are distorted by ground and intermittent clutter
in the RADAR side lobes, mainly below 500 m. New signal-processing techniques
have been developed by Potvin and Rogers (1999) to overcome these limitations.
Specically, a technique involving order statistics of several consecutive tempera-
ture and vertical velocity measurements, known as the median lter, helps to lter
out most of the bad measurements and to estimate vertical heat ux. The elimination
of bad measurements also allows the study of the development and structure of con-
vection in the boundary layer. The RASS has a unique role in boundary layer studies
since it can collect data at altitudes higher than most instrumented towers, and over
periods of time longer than those obtained by instrumented airplanes.
Typically, RASS-derived temperature proles reach up to the maximum height
of the associated wind proler, or less: for a 915-MHz system, that is 1 to 3 km above
ground level (1).
7.9. 2 TEMPERATURE
There are many studies in which the temperature errors of RASS have been investi-
gated (e.g., see Angevine and Ecklund, 1994; Angevine et al., 1994; Petenko, 1999;
Gorsdorf and Lehmann, 2000).
Figure 7.11 shows a correlation between mast measurements and the Metek
MERASS as part of the WISE/PIE campaign (Bradley et al., 2004). The correlation
is at 100 m, and comprises 3664 points. The RMS residual was 0.37 K.
The availability of RASS temperatures during a period of the same campaign
is shown in Figure 7.12. The average height producing good data is about 110 m.
This is considerably lower than the SODAR which uses the same acoustic antenna.
3588_C007.indd 208 11/20/07 4:16:56 PM
© 2008 by Taylor & Francis Group, LLC
RASS Systems 209
y = 0.8378x + 2.3092
R
2
= 0.9394
0
5
10
15
20
25
0 5 10 15 20 25 30
Sonic Virtual Temperature (deg C)
RASS Virtual Temperature (deg C)
FIGURE 7.11 A correlation between Metek RASS temperatures and mast temperatures at
100-m height.
0
100
200
300
400
500
600
0 20406080100
Availability (%)
Height (m)
Reflectivity
Temperature
FIGURE 7.12 Data availability of the Metek RASS temperature data versus height at a site
in Denmark.
3588_C007.indd 209 11/20/07 4:17:02 PM
© 2008 by Taylor & Francis Group, LLC
210 Atmospheric Acoustic Remote Sensing
The main reasons for this lower useful height are the loss of the acoustic wave
downstream and also the higher acoustic frequency used giving more absorption.
However, this is very site-dependent. The same SODAR/RASS instrument gave the
temperature–time plot of Figure 7.13 at another site, in which the average useful
height is above 300 m.
Finally, Figure 7.14 shows a correlation between a Metek RASS and tempera-
tures from a radiosonde. Agreement is quite good, considering that the sonde will
have drifted a long distance downstream during this part of the sounding.
500
480
460
440
420
400
380
360
340
320
300
280
260
240
Height in m
220
200
180
160
140
120
100
80
60
22.07.02 01
Sodargram of 10´-Average of the Pot. RASS Temperature (PRT)
02 03 04 05 06 07 08 09 10 11 12 13 14 15 16 17 18 19 20 21 22
5 25 °C
23 24
Time (UTC)
FIGURE 7.13 A typical Metek RASS temperature–height–time record at a UK site.
Height (m)
800
700
600
500
400
300
200
100
0
0246810
Virtual Temperature (°C)
12 14 16 18 20
FIGURE 7.14 Comparison between a Metek RASS (dots) and a radiosonde (solid line).
3588_C007.indd 210 11/20/07 4:17:06 PM
© 2008 by Taylor & Francis Group, LLC
RASS Systems 211
7.10 S UM M ARY
This chapter has given a very brief overview of the principles underlying RASS
technology.
REFERENCES
Angevine WM, Ecklund WL (1994) Errors in radio acoustic sounding of temperature. J
Atmos Ocean Technol 11: 837–842.
Angevine WM, Ecklund WL et al. (1994) Improved radio acoustic sounding techniques. J
Atmos Ocean Technol 11: 42–49.
Bean BR, Dutton EJ (1966) Radio meteorology. US Government Printing Ofce, Washing-
ton, DC.
Bradley SG, Antoniou I et al. (2004) SODAR calibration for wind energy applications. Final
reporting on WP3 EU WISE project NNE5-2001-297.
Clifford SF, Wang TI (1977) Range limitation on radar-acoustic sounding systems (RASS)
due to atmospheric refractive turbulence. IEEE Trans Antennas Propagation 25(3):
319–326.
Doviak RJ, Zrnic DS (1984) Doppler radar and weather observations. San Diego, Academic
Press, 562 pp.
Engelbart D (1998) Determination of boundary layer parameters using wind-proler/RASS
and SODAR/RASS. 4th International Symposium on Tropospheric Proling, Sow-
mass, Colorado.
Gorsdorf U, Lehmann V (2000) Enhanced accuracy of RASS-measured temperatures due to
an improved range correction. J Atmos Ocean Technol 17: 407–417.
Hardy KR, Atlas D et al. (1966) Multi-wavelength backscatter from the clear atmosphere. J
Geophys Res Atmos 71(6): 1537–1552.
Kirtzel HJ, Voelz E et al. (2000) RASS – a new remote sensing system for the surveillance of
meteorological dispersion. Kerntechnik 65(4): 144–151.
Klaus V, Cherel G et al. (2002) RASS developments on the VHF radar at CNRM/Toulouse
height coverage optimization. J Atmos Ocean Technol 19: 967–979.
Larsen MF, Rottger J (1991) VHF RADAR measurements of in-beam incidence angles
and associated vertical-beam radial-velocity corrections. J Atmos Ocean Technol 8:
477–490.
Lataitis RL (1992) Signal power for radio acoustic sounding of temperature: the effects of hor-
izontal winds, turbulence, and vertical temperature gradients. Radio Sci 27: 369–385.
Marshall JM, Barnes AA et al. (1972) Combined radar-acoustic sounding system. Appl Opt
11(1): 108.
Petenko IV (1999) Improved estimation of errors due to antenna geometry in RASS based on
a RADAR wind proler. Met Atmos Phys 71: 69–79.
Potvin G, Rogers RR (1999) Measuring vertical heat ux with RASS. Met Atmos Phys 71:
91–103.
Skolnik MI (2001) Introduction to radar systems. New York, McGraw-Hill. 581 pp.
Vogt S (1966) Advances in RASS since 1990 and practical application of RASS to air pollu-
tion and ABL studies. 8th International Symposium on Acoustic Remote Sensing.
3588_C007.indd 211 11/20/07 4:17:06 PM
© 2008 by Taylor & Francis Group, LLC