Water Conservation Part 11 potx
Bạn đang xem bản rút gọn của tài liệu. Xem và tải ngay bản đầy đủ của tài liệu tại đây (295.75 KB, 12 trang )
Economic Principles for Water Conservation Tariffs and Incentives
141
The final category includes a wide-range of tariff structures that combine uniform, flat,
decreasing and increasing rates in different ways for different user types. Tariffs can also be
adjusted by seasons of the year such as summer or during droughts. The essential problem
with these combined structures is that, like their component parts, they fail to present users
with simple, understandable and correct incentives for efficient water conservation. The
result of such mixed signals is wasted water with all its costs of unnecessary water and
wastewater treatment, foregone beneficial uses, and ecological damages.
4. Tariff incentives for residential water conservation
Residential water tariffs are well recognized as a water conservation tool (State of
California, 2008; Beecher et al., 2005). This section examines whether existing tariffs
encourage water conservation. The section begins with a brief comparison of experience
with tariff and non-tariff approaches to water conservation. Tariff structures and
volumetric charges used by water systems around the world are then reviewed to
determine the extent that existing tariffs are efficient. Most tariffs appear too low to
incorporate non-financial opportunity costs.
4.1 Non-tariff tools for water conservation
Water managers often favor non-tariff tools for water conservation. Non-tariff approaches
include informational campaigns, technology rebates, voluntary restrictions and mandatory
restrictions accompanied by legal penalties. Research indicates that most informational
campaigns and voluntary restrictions are unreliable as conservation tools (Olmstead &
Stavins, 2009), though some well-structured informational campaigns may reduce water use
by up to 8% (Renwick & Green, 2000). Rebates on efficiency toilets show no effect on water
use (Renwick & Green, 2000).
Mandatory restrictions enforced with strong penalties can be effective where penalties are
strictly enforced and violators are made to pay. In Aurora, Colorado, restrictions with
penalties reduced summer water use by up to 26% (Kenny et al., 2008). Renwick and Green
(2000) study California water systems serving 8 million people and find that restrictions
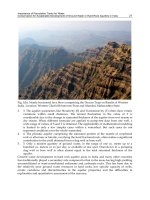
with penalties reduce water use by 19 to 29%. However, a portion of the public vocally
resists restrictions and fines. Imperfect monitoring, uneven enforcement and criminalization
of civil behavior—such as caring for one’s property—can result in public controversy
(Atwood et al., 2007). Also, restrictions may reduce a targeted behavior, but they do nothing
to encourage waste reduction in unrestricted uses.
Water conservation tariffs may also generate public resistance. No one likes a cost increase.
Worse yet, however, is going without water service as millions do when inadequate tariffs
fail to cover even financial costs (Nauges & Whittington 2009) or when excessive water
withdrawals threaten instream recreational and environmental resources (Hickey & Diaz
1999).
The structure of efficient conservation tariffs allows costs to be distributed in ways that
increase the degree of public acceptance. First, an efficient volumetric rate is fair since it
addresses the full economic cost of using an additional unit of water. With an efficient rate,
no one gets away by not paying the incremental cost of water. Second, the fixed charge can
be adjusted to address equity concerns across users and to avoid putting excess burdens on
those unable to pay.
Water Conservation
142
4.2 Water tariff structures used by municipal systems
Efficient water conservation tariffs have both an efficient structure and an efficient level. The
efficient structure has two parts, a volumetric charge and a fixed charge. The analysis
examines data on tariffs to determine the extent that water tariffs in use diverge from an
efficient structure.
A 2010 water tariff survey by Global Water Intelligence [GWI] describes water tariff
structures and levels for 276 water systems worldwide. Table 1 lists the number of survey
responses by region and the percentage distribution of five tariffs. Responses from Asian
water systems comprise about one-third of the sample. European systems provide an
additional third of responses. The remaining third of responses were obtained from water
systems in Africa, the Middle East and North Africa (MENA), North America and South
America, with North American systems providing about 12% of the responses.
Region
a
Water
Systems
(#)
Regional Rate Structure Distribution (%)
a
Vol. Flat I Block D Block Efficient
No
Data
All 276 23 3 50 2 20 2
Africa 18 0 0 94 0 6 0
Asia 94 41 3 50 0 5 0
Europe 87 22 1 24 1 48 3
MENA 19 5 0 89 0 5 0
N. America 32 6 9 44 16 22 3
S. America 26 8 0 88 0 0 4
a
“MENA” is the Middle East and North Africa, “N.” is North and “S. is South. “Vol.”
means a volumetric rate, “Flat” means a fixed charge, “I Block” means an increasing block
structure, and “D Block” means a decreasing rate structure.
Table 1. Municipal Tariff Structures
The most common tariff structure is the increasing block structure reported by 50% of the
systems. The increasing block structure gives water users divergent and inefficient signals
for water conservation. Ninety-four percent of systems in Africa use increasing block
structures and more than 88% use these structures in the MENA and South America. The
high incidence in less developed regions is unfortunate both for efficiency and equity.
Wasted water erodes already low incomes and increasing block tariffs have the most
regressive consequences for the poor (Komives et al., 2005). Notably, the increasing block
structure is much less common in Europe and North America.
Efficient tariffs structures with volumetric and fixed charges are used in 20% of the systems
surveyed. Almost half of the systems surveyed in Europe use efficient tariff structures. The
high European incidence of efficient tariffs may reflect recent reforms reported by industry
organizations (Beecher et al., 2005). Twenty-two percent of North American systems use an
efficient structure. Efficient tariffs are least common in South America, MENA, Asia and
Africa.
Volumetric charges alone are common in Asia and Europe, with 41% of Asian systems
reporting volumetric rates. Volumetric rates can offer efficient incentives for water
conservation, but to do so, tariff revenues are not likely to equal financial costs. A tariff
Economic Principles for Water Conservation Tariffs and Incentives
143
based on an efficient volumetric rate alone risks financial insolvency. Flat and decreasing
block structures are uncommon in the GWI data. The low incidence may reflect the nature of
the sample. The sample is targeted to the largest systems worldwide and systems that are
functioning adequately enough to respond to survey inquiries. Flat tariffs are the only
alternative in the absence of water use metering and many water systems operate without
such metering (Banerjee, 2008; World Health Organization & United Nations Children’s
Fund, 2000).
The incidence of tariff structures in smaller North American systems and towns also
cautions extending the global survey results to all water systems. Beecher (2011) surveys 80
water systems in the north central area of the United States and finds that 44% use
decreasing block tariffs, 18% use increasing block tariffs, and no systems use efficient
structures. Dziegielewski et al., (2004) finds that 35% of 426 water systems in Illinois use
decreasing block structures, 4% use increasing block structures and only 1% use an efficient
structure. In 12 larger water systems in Colorado, 44% use either a volumetric charge or an
increasing block tariff, 12% use decreasing block tariffs and none use an efficient tariff
structure (Western Resource Advocates, 2004).
4.3 Water tariff levels set by municipal water systems
Efficient tariff levels are set so that the volumetric charge is equal to the financial and non-
financial opportunity costs of providing an additional unit of water. Table 2 lists monthly
average water rates based on the 2010 GWI survey. The second column in Table 2 lists
income per capita within the systems responding to the survey. Overall, average income per
capita is $20,595, but regional levels range from a low of $1,645 in Africa to a high of $48,119
in North America. The average monthly charge per 1,000 gallons is $4.53 for water and $3.32
for sewerage and wastewater. Sixty-four systems or almost 25% report no wastewater
charge billed to water uses. The average combined water and wastewater charge is $7.08 per
1,000 gallons of water use.
Region
a
Water
Systems
(#)
Income per
Capita
b
($)
Water and Wastewater Charge
d
($ per 1,000 gallons)
Water Wastewater
Water and
Wastewater
All 276 20,595 4.53 3.32 7.08
Africa 18 1,645 2.09 0.70 2.79
Asia 94 12,736 2.63 1.50 4.13
Europe 87 35,722 7.82 3.83 11.65
MENA 19 14,292 2.79 0.34 3.13
S. America 32 8,513 3.01 0.90 3.91
N. America 26 48,199 4.79 5.86 10.65
a
“MENA” is the Middle East and North Africa, “N.” is North and “S. is South.
b
Income per capita is annual gross domestic product per capita for 2005.
c
Increasing and decreasing block structures result in different charges for different use
levels. The 2010 GWI data lists average charges for a use level of 15 cubic meters or 3,963
gallons per month.
Table 2. Level of Municipal Water System Tariffs
Water Conservation
144
Water and wastewater rates vary noticeably over the listed regions. Water rates are highest
in Europe and North America and lowest in Africa and Asia. The average water rate in
Europe is more than three times the water rate in Africa. Wastewater rates are highest again
in Europe and North America and lowest in Africa and MENA. Combined rates are less
than average in Africa, MENA, South America and Asia.
A standardized cost index allows a comparison of water rates relative to the revenue needed
to cover operating, maintenance and capital costs (Komives et al., 2005). The index divides
rates into the four categories shown in Table 3: insufficient or sufficient to cover operating
and maintenance costs (O&M), sufficient to cover operating, maintenance and capital costs
(O&M&C) and sufficient to cover costs in addition to minimum operating, maintenance and
capital costs.
Costs vary depending on local and regional differences in wages and other prices, so the
index sets different rates for less and more developed countries. The index does not include
a fourth category of “Sufficient for Additional Costs” for more developed countries, so this
threshold was set at $9.00 in these countries, double the rate needed to cover standard
operating, maintenance and capital costs. The analysis applies the four less developed
country cost categories to systems where mean income per capita is less than $10,000 per
year in the 2010 GWI survey. It applies the more developed cost categories to systems with
income per capita more than $10,000 per year.
Table 3 categorizes tariffs for the 121 systems in lower income regions, the 155 systems in
higher income regions and all systems. Almost one-third of the tariffs in low-income regions
and 8% of the tariffs in higher income areas are insufficient to cover only operating and
maintenance costs. Fifty-seven percent of tariffs in developing countries are insufficient to
cover the additional costs of capital. The data indicate that over all systems, only 14%
recover revenue sufficient to cover more than standard operating, maintenance and capital
costs with their current tariffs. This means that as many as 86% of the systems provide
inadequate incentives for water conservation by failing to include non-financial opportunity
costs.
Context
Insufficient for
O & M
a
Sufficient for O
& M
a
Sufficient for O
& M & C
a
Sufficient for
Additional
Costs
Less Developed Less than $0.9 $0.9 to $1.8 $1.8 to $4.5 Greater than $4.5
More Developed Less than $1.8 $1.8 to $4.5 $4.5 to $9.0 Greater than $9.0
Global Water Systems:
Income < $10,000 (%) 31 26 36 7
Income > $10,000 (%) 8 28 45 19
All (%) 18 27 41 14
a
”O & M” is operating and maintenance cost and “O & M & C” is operating, maintenance
and capital cost.
Table 3. Cost Sufficiency of Municipal Water Rates
Economic Principles for Water Conservation Tariffs and Incentives
145
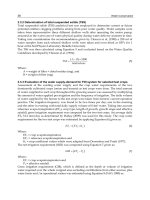
Figures 2 and 3 show that there is considerable variation in the adequacy of tariff levels
within regions and countries as well. Much of the MENA is arid and the water opportunity
costs are likely to be high. Figure 2 indicates that tariffs in 7 MENA systems are inadequate
to cover operating and maintenance expenses, let alone encourage water conservation
consistent with both financial and non-financial opportunity costs. Eleven MENA tariffs
appear to cover financial costs to some degree. Six tariffs exceed standard financial costs.
The rates in Jerusalem, Tel Aviv and Dubai appear high enough to include some portion of
opportunity costs in addition to the immediate financial requirements of operation,
maintenance and capital costs.
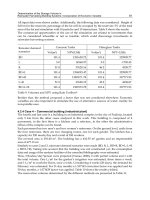
Figure 3 shows that tariffs in the United States tend to recover operating and maintenance
costs, but at least 11 of the 19 systems shown set tariffs that are insufficient to cover capital
costs. Four low tariff systems—Dallas, Las Vegas, Denver and San Antonio are in arid
regions where the opportunity cost of water is high, yet their tariffs fail to match the
standard index for normal financial costs. Six of the 19 systems set rates adequate for
revenues in excess of standard financial costs. The tariff for one city, San Diego—also in an
arid region—exceeds the $9 level where tariff revenue may include a portion of non-
financial water opportunity costs.
Fig. 2. Municipal Water Rates, Middle East and North Africa ($ per 1000 gallons)
Water Conservation
146
Fig. 3. Municipal Water Rates, United States ($ per 1000 gallons)
5. Implementing efficient residential tariffs
In many cities, large increases in water tariffs are likely to be required in order to encourage
efficient water conservation. The amount of an increase in a particular water system
depends on the current volumetric charge and the demand elasticities of water users.
Dalhuisen et al. (2003) reports an average water demand elasticity of -0.4 in a review of 314
elasticity estimates obtained in 64 different research studies. However, elasticities varied
significantly across studies and cities, so water use in a particular city may be less or more
responsive to price increases than indicated by the average elasticity (Dalhuisen et al., 2003).
For example, the average elasticity of 4 means that reducing water use by 10% requires a
25% increase in a tariff volumetric charge. With a demand elasticity of 1, reducing water
use by 10% requires a 100% increase in a volumetric charge.
Water users are likely to resist large and unexplained tariff increases. Client acceptance of
efficient water tariffs requires explanation and public education regarding the real economic
costs of water. In some cases, there may be advantages to implementing efficient tariffs on a
delayed schedule in order to give water users time to adjust and adopt water-saving habits
and technologies before sustaining higher prices.
Three approaches to tariff reduce the financial impact of efficient water conservation
incentives. The first approach is to use the efficient fixed charge to redistribute revenues in
excess of financial costs. Tariffs based on unpaid, non-financial opportunity cost are certain
to bring in surplus revenue above the revenue required to meet financial costs. Surplus
revenue may be redistributed to water users through the fixed charge portion of the efficient
tariff in a way that is consistent with fairness and equity concerns. As long as fixed charge
rebates are not correlated with users’ volumetric payment, fixed charge rebates do not
distort the tariff incentive for efficient water conservation.
A second approach to increasing public acceptance of efficient water conservation incentives
is to implement efficient tariffs for higher levels of water use and an inefficiently low tariff
Economic Principles for Water Conservation Tariffs and Incentives
147
with volumetric water conservation rebate for low volume users (Collinge, 1994). Water
conservation rebates for low volume users communicate the efficient incentive for water use
without changes in volumetric charges below a certain threshold of water use. The
volumetric rebate need only be set to pay users the volumetric opportunity cost for reduced
water use. The threshold that distinguishes low and high water use may be set for
individual users based on some percentage of historical use or it may be set at the same level
for all water users based on some other criteria, such as using all surplus revenue encourage
water conservation.
A two-tariff program combined conservation rebates may be structured in the following
way. First, the volumetric charge is raised to an efficient level,
∗
, for water use in excess of
the selected threshold for high water use. Second, for water use less than the threshold, the
volumetric charge is set to
, an amount less than
∗
. The lesser charge,
, may leave
unchanged an existing volumetric charge or it may be adjusted to some other level higher or
lower than an existing volumetric charge. The only requirement is that
≤
∗
. The third
step is to set a volumetric conservation rebate. The conservation rebate is equal to the
difference between the efficient volumetric charge and the lower volumetric charge,
∗
−
.
With the described charges and rebate in place, all water users face an efficient incentive for
water conservation. Water users above the threshold pay the full opportunity cost,
∗
, on
each unit of water used. When water users below the threshold use an additional unit of
water, they give up the opportunity to earn the rebate,
∗
−
, on that unit of water and
they pay the volumetric charge,
. The net payment for an additional unit of water use
below the threshold is composed of two parts, (i) the sacrifice of the rebate,
∗
−
, and (ii)
the payment of the volumetric charge,
. The sum of the sacrifice and volumetric charge is
the opportunity cost of water use, the efficient incentive
∗
=
(
∗
−
)
+
.
The two-tariff-and-rebate program gives all water users an efficient incentive for water
conservation. Water users below the threshold have an additional incentive to accept the
program since they may pay the current volumetric charge and have an opportunity to earn
rebate income. Setting thresholds at the individual level based on historical water use gives
all users the prospect of earning rebates. Hence, it may be possible to make almost all users
better off by including unpaid opportunity costs in an efficient water conservation tariff
program.
A third approach requires no change in tariffs below a selected threshold of water use, but
does require a physical infrastructure to transfer water between the residential water
network and the next best alternative use. This is possible in regions such as the Rio Grande
basin where both urban and agricultural water is stored and withdrawn from the same
network of canals and storage reservoirs.
The third approach is based on resale of water between residential water users and
agricultural water users (Haddad, 2000). Similar to the tariff and rebate program, a water
use threshold is set either for residential users as a group or for each user based on historical
water use. In addition, a water savings account is set up for each user within the water
networks billing and accounting system.
Water users make deposits into the savings account by reducing their planned water use
below the threshold selected by the water authority. The amount deposited is the difference
between the selected threshold and the amount of water that an individual plans to use.
Deposits can be made by telephone, by mail-in card or on the internet. The municipal
system then acts as an agent for individual savers and sells the aggregate amount of
Water Conservation
148
planned savings to agricultural users or in-situ agents. Sales revenues are returned to savers
in proportion to their actual savings.
Residential users pay the full opportunity cost of water in two situations. The first is when
their water use exceeds the threshold selected by the water authority. The second, is when
actual water saving is less than planned saving. Users that save less than they planned,
pay the full opportunity cost of water on the difference between planned and actual
savings. Apart from these two cases, users pay a volumetric rate that the water authority
sets for water use that is below the threshold minus planned savings. Tariff charges for
water use less than the threshold minus planned savings may remain at current inefficient
rates.
The third approach communicates efficient water conservation incentives to all residential
water users. Users using more than the threshold amount of water face the full opportunity
cost for an additional unit of water. Users below the threshold amount forego the
opportunity to sell water at its opportunity cost to agricultural users when they fail to ‘save’
water. Each type of user has an incentive to invest in water conservation consistent with its
value in the next best use.
Like the two-tariff-and-rebate program, water savings accounts and resale give residential
water users an opportunity to earn income from the true economic value of water. By setting
appropriate thresholds at the level of an individual user, the income earning potential can
be extended to all waters users. By saving water, users have the opportunity to converts
financial pain into financial gain. Users thereby share the benefit of efficient water
conservation.
6. Conclusions
Economic principles help identify the consequences of wasting scarce water. The
opportunity cost concept shows wasting water is not just misguided. Wasting scarce water
destroys real economic opportunities and leads to losses for other water users. The concept
of water demand guides the measurement of water values, helps evaluate users’ responses
to conservation policies, and shows how to measure the deadweight loss of inefficient water
use as well as the benefits of water conservation. Analysis of water trading shows how trade
gives water users strong incentives to find the highest value uses of water and to eliminate
waste by moving water into those uses. Third-party effects remind us that water use has
potential consequences elsewhere in the hydrological cycle, such as on in-situ and
downstream users.
The analysis used these economic principles to evaluate whether municipal water tariffs
may be designed to encourage efficient water conservation. The analysis found that efficient
water conservation tariffs have two parts, a volumetric charge that communicates the
opportunity cost of an additional unit of water and a fixed charge that is adjusted at the user
level to address equity and fairness and at the aggregate level to address revenue
requirements not covered by the volumetric charge.
Empirical analysis showed that municipal water systems across the globe are large
reservoirs of wasted water. More than 80% of 276 large water systems worldwide use tariffs
that encourage water waste. There is some evidence of tariff reform in Europe, but, even
there, the majority of water systems use inefficient tariffs that encourage wasted water.
More than 85% of the 276 systems set tariffs so low that they appear unlikely to recover
capital costs. Forty-five percent of tariffs fail to cover likely operating and maintenance
Economic Principles for Water Conservation Tariffs and Incentives
149
costs. Systems in low-income cities appear most likely to use tariffs that disadvantage the
poor, threaten financial viability and waste scarce and highly valued water.
Overall, the tariffs used by cities around world suggest rather solemn prospects for many
water systems: possible financial insolvency, reduced service quality and service areas, and
abundant water waste. Efficient water conservation tariffs can contribute to financial
solvency and unlock the reservoirs of wasted water. Water is scarce and highly valued. An
efficient water tariff communicates the high value of water.
Water users are likely to resist such communication in the form of unexplained increases in
their water bills. Explanation and education campaigns are standard approaches to
achieving clients’ acceptance of water conservation policies. There are also two ways to
modify tariff programs so that users can share the gains obtained from efficient water
conservation. The first approach is a two-tariff program with a water conservation rebate.
This two-tariff program sets a high tariff charge for water use beyond a certain threshold
and a low tariff for water use below the threshold. The threshold may be set for an
individual user based on historical use or it may be a single threshold for all users in the
system. The volumetric charge in the high tariff is equal to the marginal opportunity cost of
water. The low tariff can be set at any lower volumetric charge, including being left
unchanged from an existing rate.
The conservation rebate equals the marginal opportunity cost of water. The rebate is paid to
users based on water savings relative to the threshold—on the positive difference between
threshold and the water a user actually uses. The two-tariff-and-rebate program presents all
users with the full economic cost of using an additional unit of water. In contrast to an
across-the-board tariff increase, users actually pay the full cost of water only on water use
above the threshold. Water use below the threshold has a lower out-of-pocket cost, but the
same opportunity cost. A user that fails to conserve below the threshold gives up both the
rebate and volumetric charge on each additional unit of water use. Users above and below
the threshold have a full and efficient incentive to invest in water conservation.
The second approach is similar to the two-tariff-and-rebate program. Instead of a rebate, the
second approach offers users water conservation savings accounts. The savings accounts is
an electronic entry maintained by the water systems billing and account system. Users make
savings deposits by cutting back on water use. As savings accumulate, the water system
sells saved water at its full opportunity cost to users outside the system, such as agricultural
irrigators or trustees for environmental interests. Sales revenues are returned to savers in
proportion to their water deposits. As in the two-tariff-and-rebate program, all water users
face the full opportunity cost of an additional unit of water and each has an opportunity to
earn income from water conservation.
7. References
Allan, A. (2003). A comparison between the water law reforms in South Africa and Scotland:
Can a generic natural water law model be developed from these examples?. Natural
Resources Journal, Vol. 43, No. 2, (Spring 2003) pp. 419-490, ISSN 0028-0739
Beecher, J.A., Bell, H., Bill, C., Brydon, B., Dief, M.K., Foley, T.D., Lowdon, A., Millan, A.M.,
& Walton, B. (2005). Utility Rate Structures: Investigating International Principles and
Customer Views. Awwa Research Foundation, Denver, CO
Atwood, C., Kreutzwiser, R., & de Loe, R. (2007). Residents’ assessment of an urban
outdoor water conservation program in Guelph, Ontario. Journal of the American
Water Conservation
150
Water Resources Association. Vol. 43, No. 2, (April 2007) pp. 427-439, ISSN 1093-
474X
Banerjee, S., Foster, V., Ying, Y., Skilling, H., & Wodon, Q. (2008). Cost Recovery, Equity, and
Efficiency in Water Tariffs: Evidence from African Utilities, The World Bank, Policy
Research Working Paper 5384, Washington, DC
Barberan, R., & Arbues, F. (2009). Equity in domestic water rates design. Water Resource
Management, Vol. 23, No. 10, (2009), pp. 2101-2118, ISSN 0920-4741
Beecher, J.A., & Kalmback, J.A. (2011). 2010 Great Lakes Water Survey. Institute of Public
Utilities at Michigan State University
Brewer, J. Glennon, R. Ker, A., & Libecap, G. (2008). 2006 presidential address water markets
in the west: Prices, trading and contractual forms. Economic Inquiry, Vol. 46, No. 2,
(April 2008), pp. 91-111, ISSN 0095-2583
Brookshire, D.S., Burness, H.S., Chermak, J.M., & Krause, K. (2002). Western Urban Water
Demand. Natural Resources Journal, Vol. 42, No. 4, (Fall 2002), pp. 879-898, ISSN
0028-0739
Coase, R.H. (1946). The marginal cost controversy. Economica, Vol. 13, No. 51, (August 1942),
pp. 169-182, ISSN 0013-0427
Collinge, R.A. (1994). Transferable Rate Entitlements: The overlooked opportunity in
municipal water pricing. Public Finance Quarterly, Vol. 22, No. 1, (January 2004), pp.
46-64, ISSN 1091-1421
Coman, K. (2011). Some unsettled problems of irrigation. American Economic Review, Vol. 1,
No. 1, (March 1911), pp. 1-19, ISSN 0002-8282
Crane, R. (1994). Water markets, market reform and the urban poor: Results from Jakarta,
Idonesia. World Development, Vol. 22, No. 1, (January 1994), pp. 71-83, ISSN 0305-
750X
Dalhuisen, J.M., Florax, R.J.G.M., de Groot, H.L.F.M., & Nijkamp, P. (2003). Price and
income elasticities of residential water demand: A meta-analysis. Land Economics,
Vol. 79, No. 2, (May 2003), pp. 292-308, ISSN 0023-7639
De Mouche, L., Landfair, S. & Ward, F.A. (2011). Water right prices in the Rio Grande:
Analysis and policy implications. International Journal of Water Resources
Development, Vol. 27, No. 2, (June 2011), pp. 291-314, ISSN 0790-0627
Dziegielewski, B., Kiefer, J., & Bik, T. (2004). Water Rates and Ratemaking Practices in
Community Water Systems in Illinois, Southern Illinois University, ISBN, Carbondale,
IL
Gaudin, S. (2006) Effect of price information on residential water demand. Applied Economics,
Vol. 38, No. 4, (March 2006), pp. 282-393, ISSN 0003-6846
Grafton, Q.R., Landry, C., Libecap, G.D., McGlennon, S., & O’Brien, R. (2010). An Integrated
Assessment of Water Markets: Australia, Chile, China, South Africa and the USA,
NBER Working Paper No. 16203, National Bureau of Economic Research,
Cambridge, MA
Griffin, R.C. (2001). Effective water pricing. Journal of the American Water Resources
Association. Vol. 37, No. 5, (October 2001), pp. 1335-1347, ISSN 1752-1688
Griffin, R.C., & Boadu, F.O. (1992). Water marketing in Texas: Opportunities for reform.
Natural Resources Journal, Vol. 32, No. 2, (Spring 1992), pp. 265-288, ISSN 0028-0739
Haddad, B. (2000). Economic incentives for water conservation on the Monterey Peninsula:
The market proposal. Journal of the American Water Resources Association, Vol. 36,
No. 1, (February 2000), pp. 1-15, ISSN 1093-474X
Economic Principles for Water Conservation Tariffs and Incentives
151
Hall, D.C. (2009). Politically feasible, revenue sufficient, and economically efficient
municipal water rates. Contemporary Economic Policy, Vol. 27, No. 4, (October 2009),
pp. 539-554, ISSN 1465-7287
Hickey, J.T., & Diaz, G.E. (1999). From flow to fish to dollars: An integrated approach to
water allocation. Journal of the American Water Resources Association, Vol. 35, No. 5,
(October 1999), pp. 1053-1067, ISSN 1093-474X
Hoehn, J.P., & Krieger, D.J. (2000). Economic analysis of water service investments and
tariffs in Cairo, Egypt. Evaluation Review, Vol. 126, No. 6, (November-December
2000), pp. 345-350, ISSN 0733-9496
Ipe, V.C., & Bhagwat, S.B. (2002). Chicago’s water market: dynamics of demand, prices and
scarcity rents. Applied Economics, Vol. 34, No. 17, (November 2002), pp. 2157-2163,
ISSN 0003-6846
Kallis, G. (2008). Droughts. Annual Reviews of Environment and Resources, Vol. 33, pp. 85-118,
ISSN 1543-5938
Komives, K., Foster, V., Halpern, J., Wodon, Q., & Abdullah, R. (2005). Water, Electricity and
the Poor: Who Benefits from Utility Subsidies?, The World Bank, ISBN 9780821363423,
Washington, DC.
Kenney, D.S., Goemans, C., Klein, R., Lowrey, J., & Reidy, K. (2008). Residential water
demand management: Lessons from Aurora, Colorado. Journal of the American
Water Resources Association, Vol. 44, No. 1 (February 2008), pp. 192-207, ISSN 1752-
1688
Libecap, G.D. (2007). Owens Valley Revisited, Stanford University Press, ISBN 9780804753791,
Stanford, CA
Martins, R., & Fortunato, A. (2007). Residential water demand under block rates – a
Portuguese case study. Water Policy, Vol. 9, No. 2, (2007), pp. 217-230, ISSN 1366-
7017
Nataraj, S., & Hanemann, W.M. (2011). Does marginal price matter? A regression
discontinuity approach to estimating water demand. The Journal of Environmental
Economics and Management, Vol. 61, No. 2, (March 2011), pp. 198-212, ISSN 0095-
0696
Nauges, C., & Whittington, D. (2009). Estimation of Water Demand in Developing
Countries: An Overview. The World Bank Research Observer, Vol. 25, No. 2,
(November 2009), pp. 263-294, ISSN 0257-3032
Olmstead, S.M. (2010). The economics of managing scarce water resources. Review of
Environmental Economics and Policy, Vol. 4, No. 2, (Summer 2010), pp. 179-198, ISSN
1750-6816
Olmstead, S.M., Hanemann, W.M., & Stavins, R.N. (2007). Water demand under alternative
price structures. Journal of Environmental Economics and Management, Vol. 54, No. 2,
(September 2008), pp. 181-198, ISSN 0095-0696
Olmstead, S.M. & Stavins, R.N. (2009). Comparing price and nonprice approaches to urban
water conservation. Water Resources Research, Vol. 45, No. 4, (April 2009), ISSN
0043-1397
Organization for Economic Co-Operation and Development. (2009). Managing Water for All:
An OECD Perspective on Pricing and Financing, OECD Publications, ISBN
9789264050334
Ostrom, E. (1990). Governing the Commons: The Evolution of Institutions for Collective Action.
Cambridge University Press, ISBN 0521405998
Water Conservation
152
Platt, J. (2001). Economic Nonmarket Valuation of Instream Flows. United States Department of
Interior, Bureau of Reclamation, Technical Memorandum Number EC-2001-01,
Denver, CO
Renwick, M.E., & Green, R.D. (1999). Do residential water demand side management
policies measure up? An analysis of eight California water agencies. Journal of
Environmental Economics and Management, Vol. 40, No. 1, (July, 2000), pp. 37-55,
ISSN 0095-0696
Rogerson, C.M. (1996). Willingness to pay for water: The international debates. Water SA,
Vol. 22, No. 4, (October 1996), pp. 373-380, ISSN 0378-4738
Ruml, C.C. (2005). The Coase Theorem and Western U.S. appropriative water rights. Natural
Resources Journal, Vol. 45, No. 1, (February 2005), pp. 169-200, ISSN 0028-0739
Saleth, M.R., & Dinar, A. (2001). Preconditions for market solution to urban water scarcity:
Empirical results from Hyderabad City, India. Water Resources Research, Vol. 37, No.
1, (January 2001), pp. 119-131, ISSN 0043-1397
Slaughter, R.A. (2009). A transactions cost approach to the theoretical foundations of water
markets. Journal of the American Water Resources Association, Vol. 45, No. 2, (April
2009), pp. 331-342, ISSN 1752-1688
Snellen, W.B., & Schrevel, A. (2004). IWRM: for sustainable use of water 50 years of
international experience with the concept of integrated water management,
Ministry of Agriculture, Nature and Food Quality, The Netherlands, Wageningen,
Netherlands
State of California. (2008). Urban Drought Guidebook 2008 Updated Edition, State of California,
Sacramento, CA
Sunding, D., & Chong, H. (2006) Water markets and trading. Annual Review of Environment
and Resources, Vol. 31, (November 2006), pp. 239-264, ISSN 1543-5938
Spangler, D.K. (2007). Utah farmers are told to use water or lose it, Deseret News (May 27
2004), Salt Lake City, UT, retrieved from
www.deseretnews.com/article/595066072/Utah-farmers-are-told-to-use-water-or-
lose-it.html
Western Resource Advocates, Colorado Environmental Coalition, & Western Colorado
Congress. (2004). Water Rate Structures in Colorado: How Colorado Cities Compare in
Using this Important Water Use Efficiency Tool, Western Resource Advocates,
Boulder, CO
Whitcomb, J. (2005). Florida Water Rates Evaluation of Single-Family Homes, prepared for the
Southwest Florida Water Management District, Brooksville, FL, St. Johns River
Water Management District, Palatka, FL, South Florida Water Management
District, West Palm Beach, FL, and the Northwest Florida Water Management
District, Havana, FL
World Commission on Dams. (2000). Dams and Development: A New Framework for Decision
Making, Earthscan Publications Ltd, ISBN 1853837970, Sterling, VA
World Health Organization & United Nations Children’s Fund. (2000). Global Water Supply
and Sanitation Assessment 2000 Report, World Health Organization, United Nations
Chidren’s Fund, ISBN 9241562021, (New York)
Worthington, A.C., & Hoffman, M. (2008). An empirical survey of residential water demand
modeling. Journal of Economic Surveys, Vol. 22, No. 5, (December 2008), pp. 842-871,
ISSN 0950-0804