Convection and Conduction Heat Transfer Part 11 potx
Bạn đang xem bản rút gọn của tài liệu. Xem và tải ngay bản đầy đủ của tài liệu tại đây (1.66 MB, 30 trang )
A generalised RBF Finite Difference Approach to Solve Nonlinear Heat Conduction Problems on Unstructured Datasets 11
best accuracy overall, with the first-order Θ = 1 scheme providing the least accurate solution
for most runtimes. The Θ
= 0.65 mixed scheme offers accuracy intermediate to the other two
schemes.
Figure 4 shows the equivalent error variations for the translated case. Here the accuracy
is significantly improved for each of the time advancement schemes, in comparison to the
singular case. This is most likely a consequence of the singularity not being present within the
solution domain; with the singular case the maximum error is always found at the solution
centre closest to the singularity, whereas with the translated case the maximum error location
may change as the solution progresses. Once again, the Θ
= 0.5 case provides the most
accurate solution and the Θ
= 1 scheme the least accurate. The error profile appears similar
to the singular case, with the main difference being that the peak error is achieved at a much
earlier runtime (around t
= 0.2). In both the singular and translated cases, the solution is
replicated to a high degree of accuracy throughout the time advancement procedure.
When the steady solution is obtained directly, using the steady solution procedure, the L
2
error at the solution centres is 1.49 × 10
−3
for the singular case, and 3.44 × 10
−4
for the
translated case. Therefore it appears that approaching the steady solution using any of the
transient solution schemes offers a higher degree of accuracy than can be achieved by using
the steady solution procedure, when a consistent shape parameter value is used. This is likely
a consequence of providing an accurate initial condition to the transient solver. The steady
solver begins with an initial guess of T
(
x
)
=
0.
5. Phase change example
To demonstrate the capability of the method to handle rapid changes in thermal properties,
the freezing of mashed potato is considered. The functions for heat capacity and thermal
conductivity typically vary rapidly during phase-change, which leads to strong nonlinearity
in the PDE governing equation. In this case, a piecewise-linear approximation is taken to the
thermal properties in order to facilitate their tuning to experimental results.
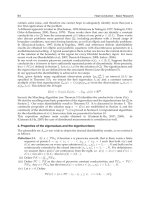
The thermal properties for different foodstuffs may vary significantly, however they all share
common features (see Figure 5). As their temperature is reduced they go from an unfrozen
“liquid” state, through a transitional state, to a fully frozen state at some temperature several
degrees below zero. During the transition zone the thermal conductivity changes significantly,
and a large spike is observed in the heat capacity, representing the latent heat of fusion. The
rapid change in the magnitude of the heat capacity makes the accurate simulation of freezing
processes challenging.
Experiments performed at the University of Palermo, Dipartimento di Ricerche Energetiche
ed Ambientali, provided data for the freezing of a hemispherical sample of mashed potato.
The experiment was then replicated numerically, adjusting the functions for k and c
v
using the
piecewise linear approximations described above in order to better represent the experimental
data. More detail on the experimental setup, the functional parameterisation, and the
optimisation procedure are given in Stevens et al. (2011).
To model the freezing process, a 3D hemispherical dataset was created. The dataset is
represented in Figure 6, and consists of an unstructured, though fairly regular, distribution
of 3380 nodes in total. The base surface of the hemisphere consists of 367 nodes, and at
these locations a zero heat-flux boundary condition is applied, representing contact with
the insulating material beneath the sample. The upper surface of the hemisphere consists
of 1164 nodes, over which a time-varying temperature profile is enforced, as obtained from
the (smoothed) experimental results. Additionally, 66 nodes are present along the base edge,
291
A Generalised RBF Finite Difference Approach
to Solve Nonlinear Heat Conduction Problems on Unstructured Datasets
12 Heat Transfer Book 2
0
0.5
1
1.5
2
-15 -5 5 15
Thermal Conductivity (W/ m. K
Temperature (Celcius)
(a) Variation of k
0
20
40
60
80
100
-15 -5 5 15
Specific heat Capacity (KJ / Kg.K
Temperature (Celcius)
(b) Variation of C
p
0
0.0002
0.0004
0.0006
0.0008
0.001
0.0012
-15 -5 5 15
Thermal diffusivity (m
2
/s)
Temperature (Celcius)
(c) Variation of α
Fig. 5. Typical variation of thermal properties with temperature (food freezing case)
where the top surface meets the bottom surface. Over these nodes, both boundary conditions
are enforced simultaneously, taking advantage of the double collocation property of the local
Hermite collocation method.
The local system size varies slightly, however the modal number of boundary and solution
centres present in each local system is 14. Additionally, PDE centres are added to each local
system. A tetrahedralisation is performed on each local system, using the boundary and
solution centres as nodes, with PDE centres placed at the centre of each resulting tetrahedron.
The modal number of PDE centres present in each local system is 24. It is important to note
that the tetrahedralisation is performed only to provide suitable staggered locations for the
PDE centres, and plays no part in the actual solution procedure, which is entirely meshless.
Since the tetrahedralisation is local, it may be performed very cheaply. It is also possible to
collocate the PDE centres with the solution and boundary centres, however previous research
(see Stevens et al. (2009)) indicates that a staggered placement leads to the most accurate
results in the majority of cases.
The simulation is performed using a second-order Crank-Nicholson implicit time
advancement scheme, and a timestep of size 50 seconds. The nonlinear convergence
parameter is set to
NL
= 10
−5
. The shape parameter is taken as c
∗
= 1.0; significantly
lower than in the validation example of section 4. It is typical among RBF methods that cases
involving irregular datasets and rapid variations in governing properties will tend to favour
292
Convection and Conduction Heat Transfer
A generalised RBF Finite Difference Approach to Solve Nonlinear Heat Conduction Problems on Unstructured Datasets 13
Fig. 6. Computational dataset; boundary and solution centres
-30.0
-20.0
-10.0
00.0
10.0
20.0
30.0
0 5000 10000 15000 20000 25000 30000
Temperature (C)
Time (seconds)
Experimental
Numerical
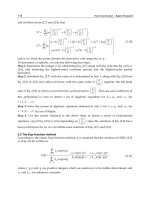
Fig. 7. Comparison of numerical and experimental temperature profiles at the core
lower shape parameters. In this case, a shape parameter of c
∗
≥ 2 can lead to instability in
some configurations of the thermal properties shown in Figure 5.
By adjusting eight parameters defining the thermal property functions, it is possible to
achieve a good representation of the experimental data. Figure (7) represents the predicted
temperature profile at the centre of the base of the hemisphere, compared with the
experimental data. The agreement between computational and experimental results is
excellent, until around t
= 18000. At this point, the experimental results show a relatively
293
A Generalised RBF Finite Difference Approach
to Solve Nonlinear Heat Conduction Problems on Unstructured Datasets
14 Heat Transfer Book 2
gradual drop in temperature between T
max
= −1.5
o
C and T
s
= −4.5
o
C, occurring between
t
= 18000 and t = 18500. In contrast, the numerical results predict a near-instantaneous
drop in temperature, from T
max
down to well below T
s
, at a slightly later time. This “sudden
dropoff” behaviour was replicated across a wide range of thermal parameters, and could
represent a limitation in the piecewise-linear approximation to the thermal properties.
The local Hermitian method was able to produce stable results using a wide range of thermal
parameters, and convergence at each timestep was typically relatively fast. The size and
intensity of the spike in the function for c
p
(see Figure 5(b)) is the feature that has most
impact upon numerical stability. By increasing the height of the spike sufficiently, it is possible
to find configurations where the method is unstable at any shape parameter. This is not
unexpected, as an increasingly sharp spike will represent increasingly strong nonlinearities
in the governing equation (19), within the phase transition zone. Tests were performed
using stencil configurations without PDE centres, i.e. without the “implicit upwinding”
feature. However, it was not found to be possible to obtain a stable solution for spikes
of intensity close to that which was required to match the experimental results. That
inclusion of PDE centres provides a stabilising effect has previously been demonstrated for
convection-diffusion problems Stevens et al. (2009), and the stabilising effect appears to be
present here also.
6. Discussion
The use of local radial basis function methods in finite difference mode (HRBF-FD) appears
to be a viable option for the simulation of nonlinear heat conduction processes, particularly
when irregular datasets are required. Traditional polynomial-based finite difference methods
are difficult to implement on irregular datasets, and RBF collocation allows a natural
generalisation of the principle to irregular data. The inclusion of arbitrary boundary operators
within the local collocation systems allows the flexibility to enforce a wide variety of boundary
conditions, and the double-collocation property of the Hermitian RBF formulation allows
multiple boundary operators to be enforced at a single location where required (such as on
converging boundaries).
The inclusion of the governing PDE operator within the local collocation systems is optional,
but when present introduces an “implicit upwinding” effect, which stabilises the solution and
improves accuracy, at the expense of larger local systems and hence higher computational
cost (discussed further in Stevens et al. (2009)). The stabilisation effect is similar to that of
stencil-based upwinding, but operates on a centrally defined stencil. Therefore, the HRBF-FD
method may be of benefit to problems which may otherwise require upwinding schemes, in
particular with unstructured datasets, where the selection of appropriate upwinding stencils
may be particularly challenging.
The application of the Kirchhoff transformation greatly simplifies the PDE governing equation
and linearises heat-flux boundary conditions, at the cost of requiring thermal property
functions to be transformed to Kirchhoff space. Using this Kirchhoff formulation the
HRBF-FD method is able to solve a benchmark heat transfer problem to a high degree of
accuracy, using both steady and transient solution procedures. Additionally, the method was
able to produce stable results for a phase change model involving the freezing of food, in
the presence of strongly varying thermal properties. By tuning the thermal properties it was
possible to replicate the experimental data to a good degree of accuracy, potentially allowing
the calibrated thermal properties to be used in further numerical simulations.
294
Convection and Conduction Heat Transfer
A generalised RBF Finite Difference Approach to Solve Nonlinear Heat Conduction Problems on Unstructured Datasets 15
7. References
Baxter, B. (2002). Preconditioned conjugate gradients, radial basis functions, and toeplitz
matrices, Computers and mathematics with applications 43: 305–318.
Beatson, R., Cherrie, J. & Mouat, C. (1999). Fast fitting of radial basis functions: Methods
based on preconditioned gmres iteration, Advances in Computational Mathematics
11: 253–270.
Bejan, A. (1993). Heat Transfer, John Wiley and Sons.
Brown, D. (2005). On approximate cardinal preconditioning methods for solving pdes with
radial basis functions, Engineering Analysis with Boundary Elements 29: 343–353.
Chantasiriwan, S. (2007). Multiquadric collocation method for time-dependent heat
conduction problems with temperature-dependent thermal properties, Journal of Heat
Transfer 129: 109–113.
Divo, E. & Kassab, A. (2007). An efficient localised radial basis function meshless method for
fluid flow and conjugate heat transfer, Journal of heat transfer 129: 124–136.
Driscoll, T. & Fornberg, B. (2002). Interpolation in the limit of increasingly flat radial basis
functions, Computers and mathematics with applications 43: 413–422.
Fasshauer, G. (1999). Solving differential equations with radial basis functions: multilevel
methods and smoothing, Advances in Computational Mathematics 11: 139–159.
Hernandez Rosales, A. & Power, H. (2007). Non-overlapping domain decomposition
algorithm for the hermite radial basis function meshless collocation approach:
applications to convection diffusion problems, Journal of Algorithms and Technology
33: 127–159.
Holman, J. (2002). Heat Transfer, McGraw-Hill.
Kreith, F. & Bohn, M. (2000). Principles of Heat Transfer (sixth edition), Brookes/Cole.
LaRocca, A. & Power, H. (2007). A double boundary collocation Hermitian approach for
the solution of steady state convection diffusion problems, Comput. Math. Appl.
55: 1950–1960.
Lee, C., Liu, X. & Fan, S. (2003). Local multiquadric approximation for solving boundary value
problems, Computational Mechanics 30: 396–409.
Ling, L. & Kansa, E. (2005). A least-squares preconditioner for radial basis functions
collocation methods, Advances in Computational Mathematics 23: 31–54.
Ling, L., Opfer, R. & Schaback, R. (2006). Results on meshless collocation techniques,
Engineering Analysis with Boundary Elements 30: 247–253.
Ling, L. & Schaback, R. (2004). On adaptive unsymmetric meshless collocation, in S. Atluri
& A. Tadeu (eds), Proceedings of the 2004 international conference on computational and
experimental engineering and sciences, Tech Science Press.
Madych, W. R. & Nelson, S, A. (1990). Multivariate interpolation and conditionally positive
definite functions ii, Mathematics of Computation 54: 211–230.
Sarler, B. & Vertnik, R. (2006). Meshless explicit local radial basis function collocation methods
for diffusion problems, Comput. Math. Appl. 51: 1269–1282.
Schaback, R. (1995). Multivariate interpolation and approximation by translates of a basis
function, Approximation Theory VIII.
Schaback, R. (1997). On the efficiency of interpolation by radial basis functions, in
A. LeMehaute, C.Rabut & L.L.Schumaker (eds), Surface fitting and multiresolution
methods, Vanderbilt University Press, pp. 309–318.
Shen, W. & Han, S. (2002). An explicit TVD scheme for hyperbolic heat conduction in complex
geometry, Numerical Heat Transfer, Part B: Fundamentals 41: 565–590.
295
A Generalised RBF Finite Difference Approach
to Solve Nonlinear Heat Conduction Problems on Unstructured Datasets
16 Heat Transfer Book 2
Stevens, D., LaRocca, A., Power, H. & LaRocca, V. (2011). Estimation of temperature evolution
during the freezing of foodstuffs using a three-dimensional meshless approach,
Journal of Food Engineering -: (submitted).
Stevens, D. & Power, H. (2010). A scalable meshless formulation based on RBF Hermitian
interpolation for 3D nonlinear heat conduction problems, Computer modelling in
engineering and sciences 55: 111–145.
Stevens, D., Power, H., Lees, M. & Morvan, H. (2009). The use of PDE centres in the
local RBF Hermitian method for 3D Convective-Diffusion problems, J. Comput. P hys.
228: 4606–4624.
Wendland, H. (1995). Piecewise polynomial, positive definite and compactly supported radial
basis functions of minimal degree, Advances in Computational Mathematics 4: 389–396.
Wong, A., Hon, Y., Li, T., S.L.Chung & Kansa, E. (1999). Multizone decomposition for
simulation of time-dependent problems using the multiquadric scheme, Computers
and Mathematics with Applications 37: 23–43.
Wright, G. & Fornberg, B. (2006). Scattered node compact finite difference-type formulas
generated from radial basis functions, Journal of Computational Physics 212: 99–123.
Wu, Z. (1995). Compactly supported positive definite radial basis functions, Adv. Comput.
Math. 4: 75–97.
Zhang, Y. (2007). Reconstruct multiscale functions using different RBFs in different
subdomains, Applied Mathematics and Computation 189: 893–901.
Zhou, X., Hon, Y. & Li, J. (2003). Overlapping domain decomposition method by radial basis
functions, Applied Numerical Mathematics 44: 241–255.
296
Convection and Conduction Heat Transfer
Part 3
Heat Transfer Analysis
14
Heat Transfer Analysis of Reinforced
Concrete Beams Reinforced with GFRP Bars
Rami A. Hawileh
American University of Sharjah
United Arab Emirates
1. Introduction
Corrosion of steel reinforcement has been identified as a key factor of deterioration and
structural deficiency (Masoudi et al., 2011) in reinforced concrete (RC) structural members.
The corrosion state of current RC bridges and high-rise buildings has been a source of
concern to designers and engineers. In addition, such structures have been invulnerable to
harsh environmental exposures, with little or no maintenance. Furthermore, such structures
are experiencing larger amount of loads than their original capacities due to the increase
number of users over the years (Bisby, 2003). Several different solutions were proposed to
retrofit deteriorated structural members (Masoudi et al., 2011; Hawelih et al., 2011; Al-
Tamimi et al., 2011) by replacing cracked concrete, using epoxy injected supplements, and
FRP externally bonded systems.
The use of embedded FRP bar reinforcement seems to be a promising solution (Masoudi et
al., 2011; Bisby, 2003; Abbasi & Hogg, 2005; Abbasi & Hogg, 2006; Qu et al., 2009; Aiello &
Ombres, 2002) to strengthen structural RC members in flexure and shear. Compared to the
conventional reinforcing steel bars, the FRP bars seem to have a high strength to weight
ratio, moderate modulus of elasticity and resistance to chemical and electrical corrosion.
Although FRP materials were shown to have a brittle failure, due to their natural
composition, still if designed properly they can show considerable amount of ductility
(Rasheed et al, 2010; De Lorenzis & Teng, 2007). One of the draw backs of using FRP
embedded bars is their low glass temperature and tendency to change state; from solid to
liquid at elevated temperatures. Hence, the performance of FRP reinforced structural
members under elevated temperatures draws many doubts and concerns and warrants
further investigation. Few experimental tests have been conducted in the previous years on
the fire performance of RC beams reinforced with FRP bars due to the high costs of such
tests, tremendous amount of preparation, and shortage of specialized facilities (Franssen et
al., 2009).
Sadek et al. (Sadek et al., 2006) conducted a full scale experimental program on the fire
resistance of RC beams reinforced with steel and Glass Fibre Reinforced Polymer (GFRP)
bars. The test matrix composed of different reinforcing rebars used along with different
concrete compressive strengths. The testing took place in a special testing facility and the
beams were loaded statically at 60% of their ultimate load capacity during the course of the
fire test. The tests followed the ASTM E119 (ASTM E119, 2002) standard and fire curve.
Convection and Conduction Heat Transfer
300
Because of forming of flexure and shear cracks, fire was able to penetrate through the cross-
section of the tested beams. The beams with low and normal strength concrete achieved a 30
and 45min fire endurance, respectively. On the other hand, the steel reinforced concrete
beam achieved 90min fire endurance. The short fire endurance observed was mainly due to
the small concrete cover used to protect the flexural reinforcements.
Abbasi and Hogg (Abbasi & Hogg, 2006) conducted two full scale fire tests on RC beams
reinforced with GFRP bars as the main reinforcement having a concrete cover of 75mm. The
beams were fully loaded up to 40kN and subjected to the ISO 834 (ISO, 1975) fire standard
curve. Eurocode 2 (Eurocode, 1992) and ACI-440 (ACI, 2008) procedures were used to
design the beams. The beam reinforced with the steel stirrups achieved a 128min fire
endurance while the beam reinforced with GFRP stirrups achieved a 94min fire endurance.
Both RC beams limited the mid-span deflection to less than L/20; the deflection limit used
in the load bearing capacity of BS 476: Part 20. In addition, the RC beams showed that they
can pass the building regulations for fire safety by withstanding the fire test more than 90
min.
Hawileh et al. (Hawileh et al., 2009, 2011) developed FE models that predicted the
performance of RC beams strengthened with insulated carbon CFRP plates subjected to
bottom and top fire loading. The models predicted with reasonable accuracy the experimental
results of Williams et al. (Williams et al., 2008). It was concluded the developed models can
serve as a valid alternative tool to expensive experimental testing especially in design oriented
parametric studies, to capture the response of such beams when subjected to thermal
loading.
Different building codes recommend conducting further experimental and analytical
research studies to investigate the thermal effect on RC members strengthened or reinforced
with FRP sheets, plates or bars. Such studies would lead to a reduction on the tough
restrictions and requirements set by the current codes of practice on the use of FRP materials
in building and other types of structures. In addition, such studies would draw a better
understanding on the behavior of FRP materials under fire actions that would enhance the
available documentation and literature that in turn would encourage designers and engineers
to use FRP bars more frequently to reinforce RC structural members.
This chapter aims to develop a 3D nonlinear FE model that can accurately predict the
temperature distribution at any location with RC beams reinforced with GFRP bars when
exposed to the standard fire curve, ISO 834. The model is validated by comparing the
predicted average temperature in the GFRP bars with the measured experimental data
obtained by Abbasi and Hogg (Abbasi & Hogg, 2006). The developed FE model incorporates
the different thermal nonlinear temperature dependant material properties associated with
each material including density, specific heat, and thermal conductivity. Transient thermal
analysis was carried out using the available FE code, ANSYS (ANSYS, 2007). The results of
the developed FE model showed a good matching with the experimental results at all stages
of fire loading. Several other observations and conclusion were drawn based on the results
of the developed model.
2. Heat transfer equations
Heat transfers via the following three methods: Conduction, Convection, and Radiation. They
can occur together or individually depending on the heat source exposure and environment.
Conduction transfers heat within the RC beam by movement or vibrations of free electrons
Heat Transfer Analysis of Reinforced Concrete Beams Reinforced with GFRP Bars
301
and atoms. On the other hand, convection transfers the heat from the source to the RC beam
via cycles of heating and cooling of the surrounding fluids. Radiation is the transfer of heat
by electromagnetic waves. The basic one dimensional steady state governing equations for
conduction, convection and radiation are presented in Eq. 1-3, respectively.
k
q k dT dx
′
′
=
(1)
h
qhT
′
′
=
Δ
(2)
4
rte
q
T
Φε σ
′′
=
(3)
where,
k
q
′′
is the heat flux due to conduction
h
q
′′
is the heat flux due to convection
r
q
′′
is the heat flux due to radiation
ρ
is the density
c is the specific heat
k is the conductivity
h is the convective heat transfer coefficient in (W/m
2
K), typical vale is 25W/m
2
K
∆T is the temperature difference between the solid surface and fluid in (°C or K)
Φ is a configuration or view factor depends on the area (A) of the emitting surface and
distance (r) to the receiving surface. (Φ = A/πr
2
)
ε
t
is the emissivity factor, ranged from 0-1.0
σ is the Stefan-Boltzmann constant taken as (5.67×10
-8
W/m
2
K
4
)
T
e
is the absolute temperature of the emitting surface (K)
Furthermore, the three dimensional transient governing heat transfer equation as a function
of time is given by Eq. 4. Equation 4 is derived from the Law of Conservation of Energy
which states that the total inflow of heat in a unit time across a certain body must be equal
to the total outflow per unit time for the same body. It should be noted that Eq. 4 can be
solved giving both initial and boundary conditions on a division or all the boundary of the
body in question (domain). The initial conditions define the temperature distribution over
the domain at the initiation of the heat transfer (i.e. at t = 0). The initial and boundary
conditions can be given by Eqs. 5 and 6, respectively:
222
222
TTTT
ck k k S
t
xyz
ρ
∂∂ ∂ ∂
=
+++
∂
∂∂∂
(4)
(
)
(
)
0
,,,0 ,,,0Tx
y
zTx
y
z= (5)
()()
cS
f
rS
f
T
khTThTT
u
∂
−= −+ −
∂
(6)
where,
S is the internally generated heat on unit volume per unit time; T is the temperature gradient
t is time; u is the direction of heat; h
c
is the heat transfer coefficient of solid surface
T
S
is the temperature of solid surface; T
f
is the temperature of fluid; h
r
is the radiation heat
transfer coefficient given by Eq. 7
Convection and Conduction Heat Transfer
302
(
)
(
)
22
Sf
rS S
f
hTTTT
σε
=++ (7)
where,
S
ε
is the emissivity of the surface in question
σ
is the Stefan-Boltzmann constant 5.669 × 10
–8
W/m
2
K
4
(0.1714× 10
–8
BTU/hr ft
2
R
4
)
3. Experimental program
The experimental program of Abbasi and Hogg (Abbasi & Hogg, 2006) is used as a benchmark
in this study to validate the accuracy of the developed model. The experimental program
(Abbasi & Hogg, 2006) consisted of three RC beams reinforced with GFRP bars. The RC
beams were casted using marine siliceous gravel coarse aggregates. Figure 1 shows the
cross-section detailing of the tested RC beams. The beams had a height and width of 400 mm
and 350 mm, respectively and effective depth of 325 mm. The concrete cover from the beam’s
soffit to the GFRP flexural reinforcement was 75 mm. The total length of the beam specimens
was 4400 mm having an exposed span length of 4250 mm. The beams were reinforced with
nine Φ12.7 mm (Area= 1303.6mm
2
) GFRP bars, seven were placed in two layers at the
tension side and two serving as compression reinforcement. In addition, Φ9 mm stirrups
were used as shear reinforcements spaced at 160mm center to center. The concrete
compressive strength was 42MPa. The first beam specimen was tested under monotonic
loading at ambient temperature conditions to serve as a control beam. The other two beams
were tested under sustained static and transient fire loading defined according to ISO 834.
b = 350mm
h = 400mm
d = 325mm
9mm
stirrups
50mm
50mm
12.7mm
main rebars
concrete
Fig. 1. Details of the tested RC beams (Abbasi & Hogg, 2006)
Heat Transfer Analysis of Reinforced Concrete Beams Reinforced with GFRP Bars
303
The fire testing was conducted at the building research establishment (Abbasi & Hogg,
2006). The internal dimensions of the furnace were 4000mm wide, 4000mm long and
2000mm deep. Each side of the furnace contained 10 burners lined in parallel to each other.
The top side of the furnace is closed with either the test specimen, or lined with steel cover
slabs. On the other hand, the furnace is lined with 1400 grade insulating brick to comply
with British Standard and ISO 834 requirements.
4. Finite element model development
The developed FE model has the same geometry, material properties, and loading as the
tested GFRP-RC beam by (Abbasi & Hogg, 2006). The FE model was developed and
simulated using the commercial FE code, ANSYS 11.0 (ANSYS, 2007). Figure 2 shows a
detailed view of the developed FE model. To take advantage of the symmetrical nature of
the geometry, material properties and heat transfer actions, only one-quarter of the RC beam
was modeled. The development of a one-quarter model will still yields the same accuracy as
the full scale model and saves a lot of computational time.
In order to simulate such complex behavior, an analytical procedure must be determined.
Firstly, the different material properties and corresponding constitutive laws were collected
from the open literature. Then, the development of the geometry and simulation enviroment
was conducted using ANSYS (ANSYS, 2007) were different element types, meshing and
simulation techniques were incorporated to simulate the concrete and reinforcing GFRP
bars elements. Finally, a 3D transient thermal analysis is conducted to simulate the applied
ISO 834 fire curve.
GFRP rebars
Concrete
Symmetry Axis no. 2
Symmetry Axis no. 1
(a) Isoperimetric view
Convection and Conduction Heat Transfer
304
Symmetry Axis no. 2
(b) Side view
Symmetry Axis no. 2
GFRP Bars
(c) Cross-sectional view
Fig. 2. Developed FE model
Different element types were selected from the ANSYS element type selection library. The
thermal elements implemented to model the concrete material and reinforcing GFRP rebars
were SOLID70 and LINK33, respectively. SOLID70 has eight nodes with a single degree of
freedom at each node, defined as temperature as well as 3-D thermal conduction capability.
SOLID70 has 2×2×2 integration scheme for both conductivity and specific heat matrices. On
the other hand, GFRP rebars were modeled using LINK33. LINK33 is a thermal uniaxial
element with the ability to conduct heat between its two nodes. The element has a single
degree of freedom SDF, temperature, at each node. In addition, both elements are applicable
to conduct 3-D, steady-state and/or transient thermal analysis (ANSYS, 2007). Figure 3
shows the different element types used in this study.
Heat Transfer Analysis of Reinforced Concrete Beams Reinforced with GFRP Bars
305
M
O,P
I
N
K,L
J
M.N.O.P
M.N.O.P
Prism Option
I
K,L
J
Tetrahedral Option
I
K
J
L
Pyramid Option
I
K
J
L
M
P
O
N
X
Y
Z
1
2
3
4
5
6
(a) SOLID70
X
Y
Z
J
I
(b) LINK33
Fig. 3. 3-D Thermal elements (ANSYS, 2007)
4.1 Material constitutive models
The thermal material properties are required as inputs to the developed FE model. Table 1
tabulates the thermal properties for the concrete and GFRP bars materials used in this study
at room temperatures. Figure 4 shows the thermal concrete material temperature-dependent
material properties including the conductivity and normalized density and specific heat.
Material
K
o
(W/mm K) C
o
(J/kg K) ρ (kg/mm
3
)
Concrete 2.7×10
-3
722.8 2.32×10
-6
GFRP 4.0×10
-5
1310 1.60×10
-6
Table 1. Thermal material properties at ambient room temperature
where,
K
o
is the thermal conductivity (W/mm K)
C
o
is the heat capacity (J/kg K)
ρ is the density (kg/mm
3
)
Convection and Conduction Heat Transfer
306
Fig. 4. Thermal temperature-dependent material properties of concrete material
Few limited studies were conducted on the mechanical temperature-dependant properties
of GFRP bars (Abbasi & Hogg, 2005). Abbasi and Hogg (Abbasi & Hogg, 2005)
recommended empirical equations to predict the mechanical properties (stiffness, tensile
strength, etc.) as a function of increasing temperature. To the top of the author’s knowledge,
there is no available data in the open literature on the thermal material-dependant
properties of GFRP bars. Thus, the thermal material properties of the GFRP bars at ambient
room temperature are used in this study.
Heat Transfer Analysis of Reinforced Concrete Beams Reinforced with GFRP Bars
307
Fig. 5. The applied ISO 834 fire curve
Fig. 6. Location of applied nodal temperatures
Exposed surfaces to the
applied fire loading
Convection and Conduction Heat Transfer
308
4.2 Loading & boundary conditions
The developed FE model was exposed to thermal transient temperature-time curve, ISO834
(ISO, 1975). The applied ISO 834 fire curve is shown in Fig. 5. The ISO 834 curve was applied
as nodal temperature loading versus time at the soffit and vertical sides of the RC beam
specimen. The locations of the applied nodal transient temperatures are shown in Fig 6.
It must be noted that the applied nodal temperatures in the transient analysis domain
started at 200mm away from the edge of the RC beam to simulate the furnace boundary
conditions.
Since the fire nozzles in the furnace are very close to the tested RC beams, the author
applied the average furnace temperature directly to the soffit and sides of the developed FE
model (Hawileh et al., 2009, 2011). Thus, heat is transferred mainly by conduction in the
developed model. This approach resulted in good matching with the temperature results
recorded in the experimental program by Abbasi and Hogg (Abbasi & Hogg, 2006) and will
be discussed in the subsequent section.
The average furnace temperature was applied in terms of small time incremental steps. Each
time step is composed of several smaller sub-steps that are solved using Newton-Raphson’s
technique. In this study, automatic time stepping option is turned on to predict and control
time step sizes. At the end of each time (temperature) step, convergence is achieved by
Newton-Raphson equilibrium iterations when the temperature difference at each node from
each iteration to another is less than one degree.
Fig. 7. Comparison between measured and predicted average temperature in the GFRP bars
4.3 Failure criteria
The failure criterion adopted in this study was based upon reaching a critical temperature in
the GFRP bars. There has been a lot of debate on defining a critical temperature for FRP
Heat Transfer Analysis of Reinforced Concrete Beams Reinforced with GFRP Bars
309
bars. In this study, a critical temperature of 462°C in the GFRP is defined as the failure
criteria. Thus, the time to failure (fire endurance) of the RC beam specimen is defined when
the temperature in the GFRP bars reached 462°C during fire exposure. The same criteria is
used in the experimental program of Abbasi and Hogg (Abbasi & Hogg, 2006).
5. Results and discussions
5.1 Model validation
The predicted FE and experimental results were compared in order to validate the accuracy
of the developed model presented in this study. Figure 7 shows a comparison between the
predicted and measured average temperature of the GFRP bars during the course of fire
loading. The predicted average temperature in the GFRP bars is obtained every 0.5 second
time increment. It is clear from Fig. 7 that there is a good correlation between the predicted
and measured results throughout the entire thermal fire exposure. It should be noted from
Fig. 7 that the predicted average temperature results overestimates the temperature after 25
minutes of fire exposure. This slight deviation could be related to the lack of temperature-
dependant material properties of the GFRP bars. The tested RC beam failed approximately
after 128min of fire exposure, when the average temperature in the GFRP bars reached
462°C. Similarly, the predicted time to failure is 130 minutes. The percentage difference
between the FE model and experimental testing time to failure was 1.5%. Thus, the developed
model could serve as a valid numerical tool to predict the temperature distribution of RC
beams strengthened with GFRP bars when exposed to transient thermal loading.
5.2 Model behavior
The experimental programs are restricted to limited number of instrumentations
(thermocouples and strain gauges) due to their high cost and complex preparation. On the
contrary, full fields of temperature distribution at any location (node) within the beam could
predicted from the FE simulation of the validated model. Having a viable FE model, further
results can be extracted and used. For instance, Fig. 8 shows the temperature evolution
across the beam's cross section at different time periods of fire exposure. Figure 8 could be
used to determine the nodal temperature at any point (node) within the beam especially at
the GFRP bar reinforcement. As expected, the temperature evolution starts at the edges,
then propagate within the beam. It seems that the available concrete cover is sufficient to
delay the increase of temperature at the GFRP reinforcement level up to 130min. Figure 9
shows the temperature distribution along the RC beam specimen at the end of fire. The FE
simulation can thus provide a wide range of results and the developed model could be used
as an alternative to the expensive experimental testing.
The experimental program lacked data on the increase of temperature in the individual
GFRP bars during the fire exposure. However, the FE model can predict the increase of
temperature at any specific location and time. Figures 10 and 11 shows the location of the
GFRP bars and temperature evolution in the individual bars at mid-span during fire
exposure. It is clear from Fig. 11 that the temperature rise in GFRP Bar 2 is the highest. This
is due to the application of the fire curve to the soffit and vertical side of the RC beam
specimen. Being located at the corner, Bar 2 thus has the shortest distance to the exposed
surfaces. Although Bars 1 and 3 seem to have the same perpendicular distance from the
exposed edge, the increase in temperature of Bar 1 seems to be slightly lower than that of
Convection and Conduction Heat Transfer
310
Bar 3. This could be related to the small bar spacing Bar 2 and Bar 4 that would increase of
temperature in the closely spaced GFRP bars. Furthermore, upon comparing the increase of
temperature in Bars 3 and 4, Bar 3 seems to experience higher temperatures because it is
closer to the exposed faces than that of Bar 4. Figure 12 shows the temperature distribution
along the GFRP bars after 130min of fire exposure. Figure 12 also shows that the edge GFRP
bar (Bar 2) experienced the highest increase of temperature during fire exposure.
6. Summary and conclusions
A nonlinear 3D FE model was developed in this study and validated against the
experimental program conducted by Abbasi and Hogg (Abbasi & Hogg, 2006). Good
agreement between the measured experimental and predicted FE simulation was obtained
for the average temperature in the GFRP bars at all stages of fire exposure. Although the UK
Building Regulations (Building Regulations, 2000) for fire safety recommends the minimum
periods of the fire resistance for the most structural elements to be of 90 min, the fire tests
and FE simulation results showed that concrete beams reinforced with GFRP bars can
achieve a fire endurance of about 130 minutes. Thus, using GFRP bars as concrete
reinforcement seems to meet the fire design requirements Upon the validation of the
measured data, the FE modeling could provide full field of results, in terms of 3D
temperature distribution. It could be concluded that the developed FE model is a great tool
to aid designers and researchers to predict numerically the temperature distribution of RC
beams reinforced with GFRP bars. Thus, the validated model could be used as a valid tool in
lieu of experimental testing especially in design oriented parametric studies. Furthermore,
the developed and verified FE model in this study could be used as a tool for further
investigation of the fire performance of RC beams reinforced with GFRP bars under
different applied fire curves and boundary conditions.
30min 60min 90min 120min 130min
25.529 142.248 258.967 375.686 492.405 609.124 725.843 842.562 959.281
Fig. 8. Temperature evolutions at different time of fire exposures
Heat Transfer Analysis of Reinforced Concrete Beams Reinforced with GFRP Bars
311
115.56 222.22 328.88 435.54 542.2 648.86 755.52 862.18 968.84
Fig. 9. Temperature distribution at the end of thermal loading
Ba
r
Bar
r
1
2
Ba
r
B
a
Cent
e
r
3
a
r 4
e
rline
Fig. 10. Location of GFRP bars within Beam’s cross-section
Convection and Conduction Heat Transfer
312
Fig. 11. Predicted temperature evolution in the GFRP bars
271.79 306.395 341 375.605 410.21 444.815 479.42 514.024 548.629
Fig. 12. Temperature distribution along the GFRP bars after 130min of fire exposure
7. Future research
• Experimental studies on the temperature-dependent thermal properties of GFRP bars
are warranted.
Heat Transfer Analysis of Reinforced Concrete Beams Reinforced with GFRP Bars
313
•
Extend the current analysis into a 3D nonlinear thermal-stress analysis that can capture
the response of RC beams reinforced with GFRP reinforcement.
• Conduct several parametric studies on the developed model to investigate the
temperature distribution under different applied fire exposure curves.
• Investigate the temperature distribution when the beams get exposed to different fire
local exposures.
8. References
Abbasi, A. & Hogg, PJ. (2005). Temperature and environmental effects on glass fibre rebar:
modulus, strength and interfacial bond strength with concrete.
Composites: part B,
Vol.36, No.5, (2005), pp. 394-404
Abbasi, A. & Hogg, PJ. (2005). Prediction of the Failure Time of Glass Fiber Reinforced
Plastic Reinforced Concrete Beams under Fire Conditions.
Journal of Composites for
Construction
, Vol.9, No.5, (2005), pp. 450-457
Abbasi, A. & Hogg, PJ. (2006). Fire testing of concrete beams with fibre reinforced plastic
rebar.
Composites: part A, Vol.37, (2006), pp. 1142–1150
ACI Committee, Guide for the design and construction of concrete reinforced with FRP bars.
Reported by ACI Committee 440; January 5, 2001.
Aiello, M. & Ombres, L. (2002). Structural Performances of Concrete Beams with Hybrid
(Fiber-Reinforced Polymer-Steel) Reinforcements.
Journal of Composites for
Construction
, Vol.13, No.5, (2002), pp. 133-140
Al-Tamimi, A., Hawileh, R., Abdalla, J. & Rasheed, H. (2011). Effects of Ratio of CFRP Plate
Length to Shear Span and End Anchorage on Flexural Behavior of SCC R/C Beams.
Journal of Composites for Construction. Accepted.
ANSYS – Release Version 11. A Finite Element Computer Software and User Manual for
Nonlinear Structural Analysis, ANSYS 2007; Inc. Canonsburg, PA.
ASTM E119. Standard test methods for fire tests of building construction and materials.
West Conshohocken, PA: ASTM international; 2002. 22 pp
Bisby L. Fire behavior of fiber-reinforced polymer reinforced or confined concrete. Ph.D.
thesis. Kingston (Canada): Department of Civil Engineering, Queen's University;
2003. 371 pp.
Building Regulations 2000. (2000). Fire Safety, Amendments 2002 to Approved Document B
(Fire safety) published by TSO (The Stationary Office).
De Lorenzis L. & Teng JG. (2007). Near-surface mounted FRP reinforcement: an emerging
technique for strengthening structures.
J Compos, Part B, Vol.38, (2007), pp. 119–143.
Eurocode 2, Design of concrete structures, ENV EC2 Part 1.2; 1992.
Franssen, J., Kodur, V. & Zaharia, R. (2009).
Designing Steel Structures for Fire Safety. Taylor &
Francis Group, London, UK.
Hawileh, R. Naser, M. Zaidan, W. & Rasheed, H. (2009). Modeling of insulated CFRP-
strengthened reinforced concrete T-beam exposed to fire.
Eng Struct, Vol.31, No.12,
(2009), pp. 3072-79.
Hawileh, R., Tamimi, A., Abdalla, J.A. & Wehbi, M. (2011). Retrofitting Pre-cracked RC
Beams Using CFRP and Epoxy Injections.
In Proceeding of the Eight International
Conference On Composite Science
and Technology (ICCST/8).