Heat and Mass Transfer Modeling and Simulation Part 2 ppt
Bạn đang xem bản rút gọn của tài liệu. Xem và tải ngay bản đầy đủ của tài liệu tại đây (1.11 MB, 20 trang )
Modeling of Batch and Continuous Adsorption Systems by Kinetic Mechanisms
11
From the experiments, it can be observed that there is an increase in the solute concentration
in the desorption procedure or wash, which corresponds to a volume higher than 45 ml. The
wash procedure leads the solute concentration to a value that is higher than the initial
concentration (C
A0
=11.5 UA/mL; UA- enzymatic activity unit). From the simulations (Fig.
11a) it can be seen that an increase in the solute concentration can be reached by the increase
in the kinetic parameter of desorption in the step of desorption. This fact is coherent once in
the wash procedure the solvent is utilized to promote the desorption of the molecules
adsorbed in the solid surface.
3. Irreversible kinetic model with batch adsorption
The agitated batch process of adsorption is an important method used for equilibrium
parameters estimation, which are applied in the processes modeling such as
chromatography and simulated moving bed (SMB) separation. The hydrodynamic aspects
of these processes become the kinetic modeling an interesting tool for the process modeling
in obtaining parameters that will be incorporated in the equipment design.
Some contributions in the application of adsorption kinetic models for the liquid phase can
be encountered through the following publications: Thomas (1944), Chase (1984), Sarkar and
Chattoraj (1993), Hamadi et al. (2001, 2004), Otero et al.(2004), Gulen et al.(2005) and Aroguz
(2006). An important contribution comes from the work of Chase (1984), which
implemented semi-analytical expressions to model the adsorption phenomenon in agitated
tanks and chromatographic columns. He considered the kinetic concepts to model the
adsorption process as a reversible system with an overall rate of second-order. In a general
point of view, the above publications, with exception of the Chase model (Chase, 1984), use
simplified or empiric expressions for the kinetic models. The advantage of utilizing the
concepts of kinetic theory to develop new models is that the stoichiometric and order,
related to the compounds in the adsorption system considered, can be varied and analyzed
independently, leading to a better comprehension of the evolved kinetic phenomenology.
In this work was implemented an irreversible kinetic model of adsorption being it applied
in the modeling of salicylic acid adsorption onto different adsorbents as the activated carbon
(F400) in three different temperature conditions. The model adjustment through the
experimental data is done with the application of an inverse problem approach that
minimize the square residues of a cost function.
3.1 Formulation of the adsorption kinetic model
The agitated adsorption techniques to measure adsorption properties are modeled with the
following expression for batch processes
1
j
j
dN
r
Vdt
(17)
in which r
j
, that corresponds to the adsorption rate of component j, is proportional to the
variation of the moles number of solute j (N
j
) with time. The tank volume (V) is assumed to
be constant.
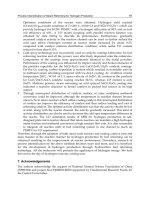
The adsorption stoichiometry considered is represented in Fig. 12. It is related to an
irreversible kinetic of adsorption with a kinetic constant k
i
. This adsorption mechanism
depends both on the solute concentration (liquid phase) and the active surface concentration
on the solid phase (site concentration on solid phase).
Heat and Mass Transfer – Modeling and Simulation
12
Fig. 12. Representation of the adsorption mechanism assumed.
The adsorption mechanism of Fig. 12 considers the adsorption of 1 (one) mol of solute A on
1 (one) mol of active site (s). The kinetic modeling, in terms of consumption rate of solute j
(r
j
), is written in the following form.
() .
nm
j
i
j
s
rkCC (18)
where k
i
, C
j
and C
s
represent the kinetic constant, the concentration of solute j in the liquid
phase and the concentration of sites of adsorption in the solid phase, respectively. For a first
order elementary adsorption, the exponents n and m are equal to 1, which corresponds to an
overall rate of second order. The irreversible adsorption is an adequate hypothesis, since in
the experimental studies (Pereira, 1999 and Silva, 2000) the desorption procedures are
necessary to return the original adsorbent properties, without solute traces. This is done
with elution and washing steps.
With the considerations just described, Eq. (18) can be solved analytically through
expression (17), applying a balance in the moles number of active sites of adsorption, i.e.
.tsAs
CCC
(19)
in which C
t
corresponds to the maximum concentration of adsorption sites, that is the sum
between the concentration of vacant sites (C
S
) and occupied sites by solute A (C
AS
). Another
important balance is related to the concentration of solute A. In the balance of solute A, the
initial concentration in the solution (C
A0
) corresponds to the sum of the final solute
concentration in the solution (C
A
) and the adsorbed solute concentration in the solid phase
(C
AS
), i.e.
0.AAAs
CCC
(20)
The combination of Eqs. (17-20) leads to
()
A
i
AA
dC
kdt
CaC
(21)
in which a= C
t
– C
A0
. Performing the integrations in Eq. (21) and utilizing the initial and
equilibrium conditions lead to the final expressions for the time dependent concentration of
solute A (Eq. 22) as a function of C
t
, C
A0
and k
i
.
0
i
ak t
A
A
AA
C
C
e
aC aC
or
0
00
.
()
i
A
A
ak t
A
A
aC
C
aC e C
(22)
Note that the implemented IKM2 (irreversible kinetic model of second order) expression
comes from the balance of moles following the moles relation shown in Fig. 12, which can be
calculated independently of the volume of each phase. The parameter a in the IKM2 (Eq. 22)
Modeling of Batch and Continuous Adsorption Systems by Kinetic Mechanisms
13
can be replaced by the term -C
eq
(equilibrium concentration of solute A in the liquid phase)
becoming the model only dependent on the liquid phase parameters.
The Fig. 13 presents the correlation results between the IKM2 model and the experimental
data from Otero et al. (2004). As can be observed from the Fig. 13 the IKM2 model showed
high fit correlating the experimental points over all temperature conditions.
The IKM2 model was highly satisfactory correlating the experimental data both at the initial
period of time and at long times. It provided better correlation results, according to best fits,
than those obtained by Otero et al., 2004, which applied a linear driving force (LDF) model
for the adsorption kinetic.
An interesting characteristic of the implemented model (IKM2) is the very small
computational effort in obtaining the simulation results. It is related to the analytical form of
the mathematical expression (Eq. 22). Besides the good agreement with the real
experimental data, the kinetic model described (IKM2) requires only two parameters (C
A0
and C
t
or C
eq
) to obtain the rate kinetic constant (k
i
).
Fig. 13. IKM2 fit with experimental adsorption data of salicylic acid on F400 adsorbent.
4. Acknowledgment
The authors acknowledge the support from the institutions UERJ, UFRJ, Capes, CNPq and
Faperj.
5. Conclusions
The kinetic mechanisms presented showed potential in the representation of different
adsorption systems involved with mass transfer in the chromatographic separation
processes.
The modeling of the chromatographic column by the mass balance models of perfect
mixture with the concepts of heterogeneous adsorption mechanisms showed to represent
the behavior of the chromatographic processes of adsorption. The simulation results
Heat and Mass Transfer – Modeling and Simulation
14
showed that either the maximum capacity of the adsorbent and the kinetic constant of
adsorption and desorption influenced significantly the dynamic behavior of the system. The
stoichiometric parameters, related to the order of adsorption and desorption, showed to be
also very important for the dynamic of the separation process, being a crucial tool for the
comprehension about the dominant mechanism of adsorption. The stoichiometric
parameters showed to influence the equilibrium amount of solute adsorbed. This fact was
also observed for the reversible mechanism, in which the higher the kinetic constant of
desorption the lower the final amount of solute adsorbed. The closer behavior to the
chromatographic answer was obtained by the models with higher orders related to the
adsorption term. This observation direct to mechanisms of adsorption that the number of
sites necessary to promote the solute adsorption is great, which indicate that more than one
site participate in the adsorption process.
The analytical kinetic model of adsorption implemented (IKM2) has proved to be
satisfactory due to a number of aspects. Firstly, it provided better agreements with
experimental data when compared to other kinetic models, such as the kinetic model of
linear driving force (Otero et al., 2004). Other relevant aspects are related to the necessity of a
small number of parameters in the model and the straightforward procedure obtaining the
solution. The consideration of an acceptable error domain for the equilibrium concentration
(C
eq
) provided good results by reductions in the residues cost function, which led to a better
experimental correlation with an increase in the accuracy of the parameters estimated.
6. Nomenclature
k
1
Kinetic constant of adsorption
k
2
Kinetic constant of desorption
k
i
Irreversible kinetic constant of adsorption
(-r
A
) Rate of consumption of molecules A in the liquid phase
(r
SA
) Rate of adsorption of molecules A in the solid phase
C
A
Solute concentration in the liquid phase
C
s
Vacant active sites of adsorption in the solid phase
q
A
Solute concentration in the solid phase
C
t
Maximum concentration of adsorption sites in a kinetic experiment
q
m
Absolute maximum concentration from isotherm data
F
j
Molar flow of the molecules j
N
j
Number of moles of the molecules j
V Volume of the column
Q Volumetric flow
Column bed porosity
,β,γ Stoichiometric coefficients of the adsorption
7. References
Aroguz, A.Z., 2006, “Kinetics and Thermodynamics of Adsorption of Azinphosmethyl from
Aqueous Solution onto Pyrolyzed (at 600º C) Ocean Peat Moss (Sphagnum sp.)”,
Journal of Hazardous Materials.
Modeling of Batch and Continuous Adsorption Systems by Kinetic Mechanisms
15
Câmara, L.D.T.; Santana, C.C. & Silva Neto, A.J. (2007). Kinetic Modeling of Protein
Adsorption with a Methodology of Error Analysis, Journal of Separation Science,
ISSN 1615-9306, 30/5, 688-692.
Chase, H.A., 1984, “Prediction of the Performance of Preparative Affinity
Chromatography”, J. Chromatography, Vol. 297, pp. 179-202.
Cruz, M. C., 1997, Adsorption of insulin on ion exchange resin utilizing fixed and fluidized
bed, M. Sc. Thesis, Universidade Estadual de Campinas, Faculdade de Engenharia
Química, Campinas-SP, Brazil. (In Portuguese)
Felinger, A., Zhou, D., & Guiochon, G., 2003, “Determination of the Single Component and
Competitive Adsorption Isotherms of the 1-Indanol Enantiomers by Inverse
Method”, Journal of Chromatography A, Vol. 1005, pp. 35-49.
Fogler, H.S. (2006). Elements of Chemical Reaction Engineering. Prentice Hall, 4
th
ed., ISBN 0-
13-047394-4
Goldstein, S., 1953, Proc. Roy. Soc.(London), vol. A219, pp. 151.
Guiochon, G. & Lin, B., 2003, Modeling for Preparative Chromatography, Academic Press,
San Diego.
Gulen, J., Aroguz, A.Z., & Dalgin, D., 2005, “Adsorption Kinetics of Azinphosmethyl from
Aqueous Solution onto Pyrolyzed Horseshoe Sea Crab Shell from the Atlantic
Ocean”, Bioresource Technology, Vol. 96, pp. 1169-1174.
Hamadi, N.K., Chen, X.D., Farid, M.M.,& Lu, M.G.Q., 2001, “Adsorption Kinetics for the
Removal of Chromium(VI) from Aqueous Solution by Adsorbents Derived from
Used Tires and Sawdust”, Chemical Engineering Journal, Vol. 84, pp. 95-105.
Hamadi, N.K., Swaminathan, S., & Chen, X.D., 2004, “Adsorption of Paraquat Dichloride
From Aqueous Solution by Activated Carbon Derived from Used Tires”, Journal of
Hazardous Materials B, Vol. 112, pp. 133-141.
Otero, M., Grande, C.A., & Rodrigues, A.E., 2004, Adsorption of Salicylic Acid onto
Polymeric Adsorbents and Activated Charcoal, Reactive & Func. Polymers, vol. 60,
pp. 203-213.
Pais, L.S., & Rodriguez, A.E., 2003, Design of Simulated Moving Bed and Varicol Processes
for Preparative Separations with a Low Number of Columns, J. Chrom. A, v.1006,
pp. 33.
Pereira, J.A.M., 1999, “Adsorption of -Galactosidase from Scopulariopsis sp in Ion
Exchange Resin with Purification and Scaling-up objective”, D.Sc. Thesis,
Universidade Estadual de Campinas, São Paulo, Brazil. (In Portuguese)
Ruthven, D.M., 1984, Principles of adsorption and adsorption process simulation, Wiley,
New York.
Rodriguez, A.E., & Minceva, M., 2005, Modelling and simulation in chemical engineering:
Tools for process inovation, Comp. Chem. Eng., vol. 29, pp. 1167-1183.
Sarkar, D., & Chattoraj, D.K., 1993, “Activation Parameters for Kinetics of Protein
Adsorption at Silica-Water Interface”, Journal of Colloid and Interface Science, Vol.
157, pp. 219-226.
Silva, F.R.C., 2000, “Study of Inulinases Adsorption in Columns with Ion Exchange Resin:
Experimental Parameters and Modeling”, D.Sc. Thesis, Universidade Estadual de
Campinas, São Paulo, Brazil. (In Portuguese)
Heat and Mass Transfer – Modeling and Simulation
16
Thomas, H., 1944, “Heterogeneous Ion Exchange in Flowing System”, J. Am. Chem. Soc.,
Vol. 66, pp. 1664-1668.
Wade, J.L., Bergold, A.F. & Carr, P.W., 1987, Anal. Chem., vol. 59, pp. 1286.
2
The Gas Diffusion Layer
in High Temperature Polymer
Electrolyte Membrane Fuel Cells
Justo Lobato, Pablo Cañizares, Manuel A. Rodrigo and José J. Linares
Chemical Engineering Department, University of Castilla-La Mancha
Spain
1. Introduction
1.1 Polymer electrolyte membrane fuel cells. Operation at high temperature
(120-200ºC)
1.1.1 General overview
Polymer Electrolyte Membrane Fuel Cells (PEMFC) can be considered as one of the most
attractive type of fuel cells. They are able to produce efficiently high power densities. In
addition, the use of a polymer electrolyte implies several advantages (Fuel Cell Handbook,
2004), such as low problems of sealing, assembling and handling. No corrosive acids,
compared to Phosphoric Acid Fuel Cells (PAFC) are used, and the low temperature of the
cell allows faster responses to changes in load demands. The characteristics of these cells
make them especially suitable for automotive applications, even though they are also used
for stationary generation, and currently, there is a great research effort for its application on
portable devices (laptops, mobile phones, cameras, etc.).
PEMFC are composed of the following basic elements:
Ionic exchange membrane (PEM).
Gas diffusion layer (GDL).
Catalytic layer (CL).
Monopolar/bipolar (in case of a stack) plates.
The combination of the GDL+CL+PEM forms the membrane-electrode-assembly (MEA), which
is the real heart of a PEMFC. This MEA can be formed by applying pressure and
temperature to the (GDL+CL) in the anode side/PEM/(GDL+CL) in the cathode side
(hot
pressing procedure), or by directly depositing the CL onto the PEM, and subsequent hot
pressing with the GDL.
Ionic exchange membrane fulfils the role of allowing the transient of ionic charges from the
anode to the cathode, closing the electrical circuit. It also possesses a low permeability to the
gases, in order to avoid the depolarization of the electrode (Savadogo, 2004). A high
mechanical and chemical stability is also required for these materials, due to the harsh
operational conditions (oxidant and reducing gases in an acid medium). The most extended
PEM material is Nafion
®
, a perflurosulphonated material, whose structure consists of a
perfluorocarbon skeleton (Teflon-like), onto which, branch chains with pendant sulphonic
acid groups are located, allowing the transient of ionic charges (see Figure 1).
Heat and Mass Transfer – Modeling and Simulation
18
(a) (b)
Fig. 1. (a) Nafion structure, (b) organization within the Nafion membranes of the
hydrophilic domains (blue) allowing the transient of protons
The gas diffusion layer (GDL) is placed between the catalytic layer and the bipolar plates
(Cindrella et al., 2009). It will be later explained in more detail, but its basic function is to
manage the access of the reactants, and the exit of the products (Benziger et al., 2005;
Mathias et al., 2003; Williams et al., 2004). This layer is made of a carbonaceous support,
onto which it can be deposited another layer, the microporous layer (MPL), formed by
carbon black and a certain amount of a polymer binder. In traditional low temperature, this
GDL also playes the role of an effective removal of the liquid water is produced in the
cathode, in order to avoid the flooding of the electrode (Benziger et al., 2005; Mathias et al.,
2003; Prasanna et al., 2004a).
The catalytic layer is the part of the cell where the electrochemical reactions take place. It is
placed between the electrolyte and the gas diffusion layer (Mathias et al., 2003). This layer is
generally formed by the own catalyst deposited on a porous carbon support. The most
widely used catalyst for the reactions that take place in the cell (hydrogen oxidation and
oxygen reduction) is platinum. A second element of this layer is the own carbon support,
which acts as electronic conductor, and allows the dispersion of the platinum catalyst on its
surface. The role of binder between the catalyst particle is performed by the own polymeric
electrolyte. This also presents an additional advantage, since the catalyst active sites are in
intimate contact with an ionic carrier, increasing its activity (Carrete et al., 2001). This
apparent network is widespread all over the catalyst layer structure, forming the so-called
three phase boundary.
Monopolar/Bipolar plates are the last element of a fuel cell. They act as support of the
previous described elements, allow the access and exit of the reactants and products,
respectively, and must allow an uniform current distribution/collection. At laboratory scale,
the most widely used material is graphite. However, its high cost and fragility make it
relatively unviable for practical applications. Instead stainless steel or titanium plates are
proposed, even though platinum, gold or silver plating are recommended in order to
alleviate the corrosion problems of those raw materials.
1.1.2 Increasing the operating temperature
Operating at temperatures above 100ºC possesses some advantages (Li et al., 2003a; Li et al.,
2004; Savadogo, 2004; Wainright et al., 2003):
Faster kinetic of the electrochemical reactions.
Easier water management and cooling system
Possibility of co-generation.
Higher tolerance to fuel impurities (e.g., CO) (Li et al., 2003b).
The Gas Diffusion Layer in High Temperature Polymer Electrolyte Membrane Fuel Cells
19
This implies the use of a thermal resistant material, which, at the same time, has to be a
proton conductor. A large number of option have been researched and developed in order
to increase the operational temperature (Bose et al., 2011). However, among the different
options, phosphoric acid impregnated polybenzimidazole (PBI) has emerged as the most
interesting and well-established one.
Firstly discover for fuel cell applications by Prof. Savinell’s group in Case Western Research
University (Wainright et al., 2003), PBI is an aromatic heterocyclic polymer with two
benzimidazolic ring linked by a phenyl group. It possesses a high thermal and chemical
resistance, with a glass transition temperature of approx. 450ºC (Wainright et al., 2003), as
corresponds to a thermoplastic amorphous polymer with a high degree of aromaticy.
Benzimidazole groups of PBI provide certain basicity, allowing the impregnation with
phosphoric acid. Some advantages of the use of this material are next listed:
Good conductivity up to 200ºC (Li et al., 2004, Lobato et al., 2006).
Low methanol permeability (Wang et al., 1996, Lobato et al., 2008a).
Excellent thermal stability, up to 500ºC in air (Samms et al., 1996).
Almost zero electro-osmotic drag coefficient (Weng et al., 1996), making unnecessary
the pre-humidification of the reactant streams.
Enhancement of the kinetic of the oxygen reduction reaction compared to PAFC
(Qingfeng et al., 2000).
2. Mass transport in polymer electrolyte membranes fuel cells
As previously described, a fuel cell is an electrochemical reactor, in which reactants are
consumed, and consequently, new products are generated. This evidently leads to the
appearance of concentration gradients, giving rise to mass transport phenomena. In
addition, the complex design of the electrodes, with several layers sandwiched together, and
the convoluted architecture of each one make it even more difficult the transport of the
different species from/to the electrode, leading to the appearance of mass transport
limitations if the system design is not the appropriate one.
Mass transport processes already start in the flow fields of the monopolar/bipolar plates. In
them, the reactant gases access to the fuel cell system, whereas the products have to leave it.
Due to the dimensions of the flow fields, in the scale of millimeters, mass transport is
dominated by convection and the corresponding laws of fluid dynamics. In the case of the
electrode (GDL+CL), the tiny pore sizes make diffusion to govern the mass transport. The
tortuous geometry of the GDL+CL isolates the gas molecules from the convective forces
present in the flow channels. Gas transport inside the electrode is a complex processes. The
gas must diffuse within the gas diffusion layer, to achieve the catalytic layer, and then,
inside this, the gas must access to the active catalyst sites. These catalyst sites are usually
covered by a certain amount of electrolyte (Lai et al., 2008; Lobato et al., 2010a), and hence,
the reactant gases and the products must also diffuse through it, complicating, even more,
the mass transfer processes. Figure 2 shows a typical concentration/partial pressure profile
of a PEMFC.
Mass transfer processes have implications in practically all the elements of the fuel cell. In
the case of the flow field channels, they should provide an homogeneous distribution across
the electrode external surface, minimize the pressure drop, and efficiently remove the
product reactions. In the case of the GDL, the requirements are almost the same, even
though the inexistence of convection forces makes more difficult the access of the reactants,
Heat and Mass Transfer – Modeling and Simulation
20
and the removal of the products. Thereby, this elements is notoriously more critical in this
sense. The catalytic layer also requires an optimum design in order to facilitate all the mass
transfer processes. In fact, an excessive amount of polymeric electrolyte causes the
appearance of significance mass transfer limitations in the catalytic layer (Song et al., 2001).
Finally, the own polymeric electrolyte has got also an important role, since the solubility of
the gas in it is highly dependant on the cell operation conditions (Liu et al., 2006).
Reactants
Reactants
Products
B
R
C
S
R
C
C
R
C
C
P
C
S
P
C
B
P
C
Net flux
of
reactants
Net flux
of
products
Flow
fields
Gas channels
Gas
diffusion
layer
Catalytic
layer
C
R
C
Cat
R
C
Gas
channels
in the
catalytic
layer
Electrolyte film
Platinum
active
sites
Fig. 2. Typical concentration profile inside a fuel cell
In the case of H
3
PO
4
doped PBI-based high temperature PEMFC, compared to traditional
Nafion
®
-based PEMFC, mass transport becomes slightly simpler since all the species are in
vapour state, and therefore, flooding problems do not appear (Lobato et al., 2008b).
However, this does not imply that mass transport processes are not important in terms of
cell performance. Indeed, as previously commented, it is necessary an optimum transport of
hydrogen and oxygen gas across the gas diffusion layer. Moreover, the removal of the water
vapour generated in the cathode must be effective. In the catalytic layer of this type of fuel
cells, phosphoric acid is present in order to provide a protons pathway for their migration,
and hence, oxygen and hydrogen must diffuse through this thin electrolyte layer. Oxygen
solubility in phosphoric acid has been reported to be low, compared to, for example,
Nafion
®
(Mamlouk et al., 2010), which also results in an extra-limitation in terms of mass
transfer within the catalytic layer.
3. The role of the gas diffusion layer in high temperature PEMFC
The membrane-electrode-assembly of a phosphoric acid doped PBI-based PEMFC is similar to
traditional low temperature Nafion
®
-based PEMFC, i.e., is formed by the membrane, and the
electrodes. The electrodes, at the same time, are divided into two layers, the catalytic one, and
the gas diffusion layer. The gas diffusion layer in high temperature PEM fuel cells must fulfil
the following purposes (Benziger et al., 2005; Mathias et al., 2003; Williams et al., 2004):
The Gas Diffusion Layer in High Temperature Polymer Electrolyte Membrane Fuel Cells
21
Good transport properties, for a uniform distribution of the reactants across the
electrode surface.
High electronic conductivity to allow the transient of electrons between the catalytic
layer and the bipolar/monopolar plate.
Good mechanical resistance, since this layer is the support of the catalytic one.
Good removal capacity of the water vapour produced in the cathode.
The GDL is formed by a carbonaceous support, generally carbon cloth or carbon fibre paper
(Han et al., 2008), relatively rigid, macroporous, and highly conductive (Cindrella et al.,
2009). Generally, this carbon support is wet-proofed with a certain amount of Teflon, which
assists in an effective water management, and provides a pathway for the access of the
reactant gases when massive amounts of water are being generated in the cathode (Park et
al., 2004). Also, this amount of Teflon helps to keep the mechanical integrity of the gas
diffusion layer during the hot pressing procedure used to prepare the membrane-electrode-
assembly (MEA) (Lobato et al., 2008b).
In some cases, a second layer is incorporated to the GDL design, the microporous layer. As
previously commented, this layer is formed by carbon black (Vulcan XC-72R, Ketjen Black,
Acetylene Black ) (Antolini et al., 2002), and a certain amount of a polymeric binder
(generally Teflon) (Carrete el al., 2001; Mathias et al., 2003). Both components, along with an
appropriate solvent (generally non-toxic, e.g., isopropyl alcohol, water, ethylene glycol )
(Carrete et al., 2001) is generally deposited by forming a thick ink, and applied by different
techniques, filtration, with the aid of an aerograph, tape-casting, etc. The properties of the
ink and deposition method influence on the final mass transport properties of this layer
(Cindrella et al., 2009; Mathias et al., 2003). The composition of this layer makes it have a
microporous nature, with the following advantages:
Uniform current distribution between the catalyst layer and the carbonaceous support,
due to a more intimate contact between the layers.
Avoid the penetration of catalyst particles in the carbon support, which would be
located too far away from the membrane-electrode boundary, where most efficiently
evolve the electrochemical reactions (Seland et al., 2006).
Figure 3 shows a schematic structure of a general electrode (including MPL) for a high
temperature phosphoric acid doped PBI-based PEMFC.
CARBON SUPPORT
CATALYTIC
LAYER
Catalyst
Electrolyte
MICROPOROUS LAYER: Carbon
black + polymeric binder
Fig. 3. Schematic general structure of an electrode with microporous layer
Heat and Mass Transfer – Modeling and Simulation
22
Therefore, in order to maximize the cell performance not only in terms of mass transfer, but
in global terms, it is logically necessary to have an optimum gas diffusion layer structure,
both in terms of the carbon support, and microporous layer. For this purpose, physical and
electrochemical characterisation of the gas diffusion layer is performed, as it will be shown
in the following sections.
3.1 The carbon support. Influence of the Teflon percentage
Carbon cloth, carbon fibre papers, or carbon felt are different options to be used as
carbonaceous support in PEM Fuel Cells. Although any of them presents different
advantages and disadvantages, carbon fibre papers is interesting in terms of robustness and
mechanical reliability. This carbon paper is supplied by the Japanese company Toray
Industries Inc., with different thickness 90, 170, 260 and 350 µm), and also with the possibility
of different levels of wet-proofing (Teflon percentage on the basis of the carbon paper
weight). If the MEA is prepared by hot pressing, thick carbon supports are more suitable in
terms of mechanical integrity. For this material, a very interesting parameter to be analyzed
is the influence of the Teflon on its physical properties, and on the electrochemical
performance of the subsequent prepared electrode.
3.1.1 Physical characterisation
Next, some results of useful physical characterization techniques are presented. The
physical parameters next evaluated have got a strong influence on the mass transport
properties of the GDL, and therefore, on the cell performance in terms of mass transfer
parameters (limiting current density).
A typical pore size distribution of the carbon fibre paper (Toray Graphite Paper, TGPH-120,
350 µm) obtained from Hg porosimetry for the different Teflon percentage is shown in
Figure 4.
(a)
(b)
0.01 0.1 1 10 100 1000
0.0
0.2
0.4
0.6
0.8
1.0
1.2
1.4
1.6
1.8
2.0
Cumulative pore
volume / ml g
-1
Pore size / m
0% PTFE
10% PTFE
20% PTFE
40% PTFE
0.01 0.1 1 10 100 1000
0
1
2
3
4
5
6
7
Specific pore
volume / ml g
-1
m
-1
Pore size / m
Fig. 4. (a) Cumulative, and (b) Specifical pore size volume for the differente Teflon
percentage in the carbon fibre paper (TGPH-120) (Lobato et al., 2008b, with permission of
Kluwer Academics)
As it can be seen, the carbon support present a macroporous structure, with most of the
pores in the range of 30-70 µm. Moreover, Teflon content reduces the macroporosity of the
carbon paper. From the pore size distribution, other interesting parameters can be
The Gas Diffusion Layer in High Temperature Polymer Electrolyte Membrane Fuel Cells
23
evaluated, such as the overall porosity, the mean pore size, and the tortuosity. Table 1 collects the
corresponding values.
PTFE content / % Porosity / %
Mean pore diameter /
m
Tortuosity
0 76.3 39.4 2.932
10 73.9 36.7 3.363
20 69.6 33.9 3.582
40 61.6 31.6 4.377
Table 1. Overall porosity, mean pore size and tortuosity of the carbon support for the
different Teflon loading percentage (Lobato et al., 2008b, with permission of Kluwer
Academics)
As expected from the pore size distribution curves, porosity and mean pore size diminishes
with the increase in the Teflon content, whereas the tortuosity increases with the Teflon
content. Porosity and tortuosity are important parameters, since they directly influence on
the effective diffusion coefficient (Williams et al., 2004), according to Equation 1.
eff
ε
DD
τ
(1)
Scanning electron microscopy is also a very useful tool in order to visualize the microstructure
of the gas diffusion layer. Figure 5 displays the micrographs of the Toray Graphite Papers
for the different Teflon percentage.
(a)
(b)
Fig. 5. SEM micrographs of (a) Plain carbon fibre paper, (b) 20% wet-proofed carbon paper
(Lobato et al., 2008b, with permission of Kluwer Academics)
As it can be seen, appreciable differences appear between both carbon papers. When Teflon
is applied, a large number of macropores are closed by the presence of the polymer binder,
reflecting the previous results obtained by Hg porosimetry. Teflon occupies parts of the
macropores between the carbon fibres.
Gas diffusion layer permeability is another interesting parameter. Although this parameter is
related with convectional processes, it can give us a rough idea about the transport
properties of the gas diffusion layer. Figure 6 shows the gases (H
2
, O
2
, air and water vapour)
permeability of the different carbon support. For its calculation, Equation 2 must be used.
Heat and Mass Transfer – Modeling and Simulation
24
010203040
0
3
6
9
12
15
hydrogen
oxygen
air
Water vapour
10
12
permeability / m
2
% Teflon in the carbon support
Fig. 6. Gases permeability of the carbon support for different Teflon contents
Q μ L
K
S ΔP
(2)
As expected, gas (or water vapour) permeability reduces with the Teflon content due to
the blockage of part of the macroporosity by the Teflon (Prasanna et al., 2004a; Prasanna
et al., 2004b; Soler et al., 2003; Williams et al., 2004). It is especially significant the value of
the water vapour permeability, since in this type of fuel cell, water product will be in this
state.
Gases permeability follows the expected trend according to their molecular size. Hydrogen
permeates easily through the carbon support, whereas oxygen and air have got a more
limited access. This, as will be later shown, reflects on the fuel cell performance, where
hydrogen mass transport limitations are less noticeable than in the case of oxygen. In the
case of water vapour, the fashion is broken, but this might be due to the vapour nature
compared to gases.
3.1.2 Electrochemical behaviour
The electrochemical behaviour of a fuel cell is mainly defined by the polarization curves. As
it was previously described, three main regions appear, each one related to different
processes governing the performance. In this particular case, mass transport properties of
the carbon support will mainly influence the cell performance at the highest current
densities, where large amounts of gas reactants are claimed, and massive amounts of water
vapour have to be released from the cell. In order to assist for the interpretation of the fuel
cell results, a semi-empirical model (Linares, 2010) was developed, which includes kinetic,
ohmic, and mass transport parameters (Equation 3).
1
2
'
HL
0e pol
OL HL
jj
EE b log j - Rjbln1 R j
jjj
(3)
The Gas Diffusion Layer in High Temperature Polymer Electrolyte Membrane Fuel Cells
25
Parameter E is the cell voltage, E
0
is the open circuit voltage, b is the Tafel slope, being these
two latter related to the mechanism of the oxygen reduction reaction, R
e
is the ohmic
resistance of the system, j is the experimental current density, j
OL
is the limiting cathode
current density, R
pol
is the lineal polarization resistance of the hydrogen oxidation reaction,
and j
HL
is the limiting anode current density.
Impedance can be also an interesting tool to identify the appearance of mass transfer
limitations associated with the gas diffusion layer (Bultel et al., 2005; Ciurenau et al., 2001;
Ciurenau et al., 2003; Springer et al., 1996; Paganin et al., 1998). In general, it is admitted that
the appearance at low cell voltage (high current densities) of a second loop in the typical
one-loop spectrum of a fuel cell (Yuan et al., 2007) is due to mass transfer limitations in the
gas diffusion layer.
Influence of the percentage of Teflon in the carbon support was studied for both the anode
and the cathode. In the case of the cathode, results for reduced stoichometries and air were
subjected to study, along with the impedance response of the cell when air was used. In the
case of hydrogen, it was analyzed the performance under a limited H
2
stoichometry.
i) The carbon support in the cathode
Figure 7 shows the cell performance for the 10-20-40% Teflon in the carbon support. Points
represent the experimental data, whilst lines represent the fitting to the semi-empirical
model.
(a) (b)
0 200 400 600 800 1000 1200 1400
0
100
200
300
400
500
600
700
800
900
10% Teflon
20% Teflon
40% Teflon
Cell voltage / mV
Current density / mA cm
-2
0 100 200 300 400 500 600 700 800
0
100
200
300
400
500
600
700
800
Cell voltage / mV
Current density / mA cm
-2
Fig. 7. Fuel Cell performance for the different Teflon percentage in the carbon support: (a)
Oxygen stoichometry at 1 A cm
-2
= 1,5, (b) Air stoichometry at 1 A cm
-2
= 4
As it can be seen, the presence of a large amount of Teflon in the carbon support diminishes
the cell performance, especially at the highest current densities. The corresponding values of
the limiting current density are collected in Table 2. They resemble to the fashion of a more
limited transport properties of the carbon support the higher is the Teflon percentage. On
the other hand, it can be seen the detrimental effect of substituting oxygen by air. Reduction
of the oxygen partial pressure dramatically influences the cell performance.
Figure 8 shows the impedance spectra of the cell under air operation, at a cell voltage of 300
mV. Points represent the experimental data, whereas lines show the fitting to the equivalent
circuit. In order to help to split the contribution of each process, a equivalent circuit
(Boukamp, 1986) consisting of a series association of one ohmic resistance, one parallel mini-
Heat and Mass Transfer – Modeling and Simulation
26
circuit constant phase element and resistance, related to the charge transfer processes
(kinetic), and another parallel mini-circuit constant phase element and resistance, associated
to mass transfer, is proposed [see Fig. 7(a)]. Table 2 also collects the values of the
corresponding mass transfer resistances.
As it can be seen, and concomitantly to fuel cell results, impedance spectra show how the
total resistance of the system increases the higher is the Teflon percentage. More concretely,
mass transfer resistance calculated from the fitting of the experimental data to the
equivalent circuit confirms this notorious increase in R
mt
. In consequence, a low Teflon
percentage in the carbon support is desirable in order to favour the mass transport
processes. A non wet-proofed carbon paper may be utilized; however, mechanical integrity
of the electrode may be risked, due to the weakness of this particular carbon paper (Lobato
et al., 2008b).
(b)
(a)
Ohmic
resistance
(R
)
Anode charge
transfer resistance
(R
ct,a
)
Anode constant
phase element
ANODE
CONTRIBUTION
Cathode constant
phase element
Cathode
polarization
resistance (R
p,c
)
CATHODE
CONTRIBUTION
Ohmic
resistance
(R
Ω
)
Charge
transfer CPE
Charge transfer
resistance (R
ct
)
Mass transfer
resistance (R
mt
)
CHARGE
TRANSFER
CONTRIBUTION
MASS TRANSFER
CONTRIBUTION
Mass transfer
CPE
(a)
0.0 0.2 0.4 0.6 0.8 1.0 1.2 1.4 1.6 1.8 2.0
0.0
0.1
0.2
0.3
0.4
0.5
0.6
0.7
0.8
0.9
1.0
10% Teflon
20% Teflon
40% Teflon
-Z'' / ohm cm
2
Z' / ohm cm
2
Fig. 8. (a) Equivalent circuit for the fitting of the experimental impedance data, (b)
Impedance spectra of the electrodes with different Teflon percentages
PTFE content / % j
OL,ox
yg
en
/ mA cm
-2
j
OL,air
/ mA cm
-2
R
m
t
/ ohm cm
2
10 1,418.9 952.8 0.744
20 1,272.1 786.6 1.041
40 1,029.8 562.2 1.502
Table 2. Limiting current densities for oxygen and air operation, and the mass transfer
resistance for the different Teflon percentage in the carbon support.
ii) The carbon support in the anode
Figure 9 shows the fuel cell performance for the different Teflon loaded carbon supports.
As it can be seen for all the Teflon percentages in the carbon support, the cell performances
are almost equal, and just tiny differences are observed when achieving the limiting current
density conditions. This demonstrates that the controlling reaction in high temperature PBI-
based PEMFC is the cathodic one (Jalani et al., 2006). Differences just appear at limiting
conditions, as it was also observed by Pan et al. (Pan et al., 2007). Table 3 collects the
corresponding values for the hydrogen mass transfer.
The Gas Diffusion Layer in High Temperature Polymer Electrolyte Membrane Fuel Cells
27
0 200 400 600 800 1000 1200
0
100
200
300
400
500
600
700
800
900
10% PTFE
20% PTFE
40% PTFE
Cell voltage / mV
Current density / mA cm
-2
Fig. 9. Influence of the Teflon percentage on the cell performance. Hydrogen stoichometry at
1 A cm
-2
= 1 (Points: experimental data; lines: fitting to the model)
Values in Table 3 confirm the expected reduction in the limiting current density due to the
most limited hydrogen transport from the gas channels to the catalytic layer. However, it is
noticeable that these values are very close to the stoichometric ones, so that, in principle,
hydrogen transport in the carbon support, unless very limited hydrogen flow, is not a
limiting factor in the performance of a High Temperature PEMFC.
PTFE content / % j
HL,h
y
dro
g
en
/ mA cm
-2
10 1,000.9
20 990.1
40 961.9
Table 3. Limiting current density for the hydrogen oxidation for the different Teflon
percentages of the carbon support
3.2 The microporous layer
As it was previously commented, the microporous layer is deposited on the carbon support,
and is formed by carbon black and a polymer binder, in this case, Teflon. As in the case of
the carbon support, two types of studies were carried out:
Physical characterisation. Measurements of the pore size distribution, overall porosity,
mean pore size, tortuosity, and finally, the permeability to the different reactants and
water vapour product.
Electrochemical behaviour. Evaluation of the cell performance under restricted
stoichometries. Impedance spectra are also used in order to assist for the interpretation
of the mass transfer influence on the fuel cell results.
Physical characterisation was carried out on the complete gas diffusion layer, i.e., the sum of
the carbon support (10% Teflon loaded TGPH-120) and the microporous layer. In the case of
the electrochemical studies, actual electrodes were tested in the fuel cell. Beneficial effects of
the microporous layer are shown in the following results.
Heat and Mass Transfer – Modeling and Simulation
28
3.2.1 Influence of the Teflon percentage in the microporous layer
For this study, microporous layers with a carbon content of 1 mg cm
-2
were prepared,
varying, on a total weight base, the percentage of Teflon (10, 20, 40 and 60%). Lower Teflon
percentage could not be used, because they attempted against the integrity of the MPL.
a) Physical characterisation
Figure 10 displays the pore size distribution for the gas diffusion layer with different Teflon
percentage in the microporous layer. Specific pore size distribution is shown in the
macroporous and microporous region, for a better visualization of the effect of the inclusion of
the microporous layer in the carbon support, and the effect of the Teflon percentage in the MPL.
0.01 0.1 1 10 100
0.00
0.04
0.08
0.12
0.16
0.20
Specific pore volume /
ml g
-1
m
-1
Pore size / m
(
a
)
(
b
)
10 100
0
1
2
3
4
5
6
without MPL
10% Teflon in the MPL
20% Teflon in the MPL
40% Teflon in the MPL
60% Teflon in the MPL
Specific pore volume /
ml g
-1
m
-1
Pore size / m
Fig. 10. Specific pore volume for the GDLs with different Teflon percentage in the MPL in:
(a) the macroporous region, and (b) in the microporous layer.
As it can be seen, the presence of the MPL reduces the amount of macropores in the carbon
support. Part of the microporous layer penetrates inside the carbon support, partially
closing its macroporous structure. On the other hand, the increase in the Teflon percentage
in the MPL hardly affects the macroporous structure. In the case of the microporous, the
presence of the MPL generates microporosity in the GDL. This result diminished with the
increase in the binder percentage. The Teflon occupies part of the microporous structure of
the MPL. Table 4 displays the values of the overall porosity, mean pore size, and tortuosity of the
GDL, extracted from the pore size distribution, for the different Teflon-loaded MPL.
As it can be seen, the overall porosity and mean pore size decrease with the Teflon content
in the MPL, and further does with the inclusion of the MPL. Comparing with the Teflon
percentage in the carbon support, the diminution is lower, since in this case the microporous
structure is only affected, which has a lower weight on the global structure of the complete
GDL. In the case of the tortuosity, it can be seen a noticeable increase with the inclusion of
the MPL, making more difficult the fluid transit.
PTFE content / % Porosity / %
Mean pore diameter /
m
Tortuosity
Without MPL 73.9 36.69 3.363
0 70.6 34.23 3.795
10 70.2 34.02 3.871
20 69.4 33.81 3.940
40 68.9 33.63 4.130
Table 4. Values of the overall porosity, mean pore size diameter and tortuosity for the GDLs
with different Teflon loaded MPL
The Gas Diffusion Layer in High Temperature Polymer Electrolyte Membrane Fuel Cells
29
Gases/water vapour permeability is shown in Figure 11 for the GDL with different Teflon
percentage of the MPL.
0 10203040506070
0
2
4
6
8
10
12
H
2
O
2
air
water vapour
10
12
permeability/ m
2
% Teflon in the MPL
Fig. 11. Gases and water vapour permeability of the GDLs with different Teflon percentage
in the MPL (horizontal lines represent the carbon support permeability)
As it can be observed, the gases/water vapour permeability diminishes with the Teflon
content in the MPL. Logically, the occlusion of part of the microporous makes more difficult
the transient of the gases through the GDL, and therefore, mass transfer becomes more
impeded for high Teflon percentages in the MPL. As in the case of the carbon support, the
values of the gases permeability for each gas are in the line of its molecular size, except for
the case of water vapour.
Therefore, in terms of mass transfer physical related properties, the use of a low percentage
of Teflon in the MPL appeared to be beneficial. High porosity and permeability, and low
tortuosity can be achieved under these conditions. On the other hand, these results also
suggest the suitability of uniquely the carbon support in the MPL, even though these
preliminary results must be confirmed by the fuel cells one.
b) Electrochemical behaviour
b.i) The Teflon percentage in the cathodic MPL
Figure 12 shows the variation of the cell performance for the GDLs with different Teflon
percentage in the MPL. Points correspond to the experimental data, whereas lines show the
fitting of these data to the semi-empirical model.
First of all, it is important to mention the positive effect that has got the inclusion of the MPL
in the cell performance. This result can be explained taking into account one of the missions
of the MPL: avoid the penetration of the catalyst particle in the carbon support. In the pore
size distribution, it has been observed that part of the MPL penetrates into the carbon
support, blocking part of the macroporosity. MPL and catalytic layer have a similar pore
size distribution (same carbon black support), and therefore this latter penetrates into the
carbon support if no MPL is used (Lobato et al., 2010b). Secondly, cell performance clearly
worsens with an increase of the Teflon content. Unlike the carbon support, in this case the
overall cell performance seems to result affected by an excess of Teflon binder, as Prasanna
et al. (Prasanna et al., 2004a) also observed for Nafion
®
-based PEMFC. Therefore, the MPL
Heat and Mass Transfer – Modeling and Simulation
30
does not only have influence in terms of mass transfer limitations, but in kinetic and ohmic
ones due to an excess of insulator material. Table 5 collects the values arisen from the fitting
of the experimental data to the semi-empirical model.
0 300 600 900 1200 1500
0
100
200
300
400
500
600
700
800
900
without MPL
10% Teflon in the MPL
20% Teflon in the MPL
40% Teflon in the MPL
60% Teflon in the MPL
Cell voltage / mV
Current density / mA cm
-2
0 200 400 600 800 1000 1200
0
100
200
300
400
500
600
700
800
900
Cell voltage / mV
Current density / mA cm
-2
(a) (b)
Fig. 12. Cell performance of the electrodes prepared with different Teflon percentage in the
MPL, (a) Oxygen stoichometry at 1 A cm
-2
= 1,5, (b) Air stoichometry at 1 A cm
-2
= 4
PTFE content / % j
OL,ox
yg
en
/ mA cm
-2
j
OL,air
/ mA cm
-2
R
m
t
/ ohm cm
2
Without MPL 1,418.9 952.8 0.744
10 1,477.6 1,115.4 0.430
20 1,400.5 1,005.1 0.622
40 1,320.7 922.5 0.761
60 1,240.2 790.3 0.995
Table 5. Limiting current densities for oxygen and air operation, and the mass transfer
resistance for the different Teflon percentage in the MPL
Model values confirm the experimental results and show how the 10% Teflon loaded MPL
presents the maximum value of the limiting current density, both in the case of oxygen with
a reduced stoichometry, and air. Figure 13 shows the corresponding impedance spectra at
300 mV when the cell was operated with air. Values of the mass transfer resistance after
fitting the experimental data to the equivalent circuit are collected in Table 5.
Impedance spectra show the benefits of the inclusion of the MPL in the electrode design by
the reduction of the global resistance of the cell. Moreover, this resistance attains its lowest
values when the MPL is loaded with 10% Teflon. Higher loadings reflect higher mass
transfer limitations, as the values of the R
mt
displays. Consequently, the MPL must be
included for high temperature PEMFC electrodes, since all the cell processes are enhanced,
despite the decrease in the mass transfer parameters when added. On the other hand, a low
Teflon percentage must be used in terms of global performance.
b.ii) The Teflon percentage in the anodic MPL
Figure 14 shows the influence of the Teflon percentage of the MPL in different GDLs.