báo cáo hóa học: " The effects of powered ankle-foot orthoses on joint kinematics and muscle activation during walking in individuals with incomplete spinal cord injury" pptx
Bạn đang xem bản rút gọn của tài liệu. Xem và tải ngay bản đầy đủ của tài liệu tại đây (490.29 KB, 17 trang )
BioMed Central
Page 1 of 17
(page number not for citation purposes)
Journal of NeuroEngineering and
Rehabilitation
Open Access
Research
The effects of powered ankle-foot orthoses on joint kinematics and
muscle activation during walking in individuals with incomplete
spinal cord injury
Gregory S Sawicki*
1,2
, Antoinette Domingo
1
and Daniel P Ferris
1,3,4
Address:
1
Division of Kinesiology, University of Michigan, Ann Arbor, MI, USA,
2
Department of Mechanical Engineering, University of Michigan,
Ann Arbor, MI, USA,
3
Department of Biomedical Engineering, University of Michigan, Ann Arbor, MI, USA and
4
Department of Physical Medicine
and Rehabilitation, Ann Arbor, USA
Email: Gregory S Sawicki* - ; Antoinette Domingo - ; Daniel P Ferris -
* Corresponding author
Abstract
Background: Powered lower limb orthoses could reduce therapist labor during gait rehabilitation after
neurological injury. However, it is not clear how patients respond to powered assistance during stepping.
Patients might allow the orthoses to drive the movement pattern and reduce their muscle activation. The
goal of this study was to test the effects of robotic assistance in subjects with incomplete spinal cord injury
using pneumatically powered ankle-foot orthoses.
Methods: Five individuals with chronic incomplete spinal cord injury (ASIA C-D) participated in the study.
Each subject was fitted with bilateral ankle-foot orthoses equipped with artificial pneumatic muscles to
power ankle plantar flexion. Subjects walked on a treadmill with partial bodyweight support at four speeds
(0.36, 0.54, 0.72 and 0.89 m/s) under three conditions: without wearing orthoses, wearing orthoses
unpowered (passively), and wearing orthoses activated under pushbutton control by a physical therapist.
Subjects also attempted a fourth condition wearing orthoses activated under pushbutton control by them.
We measured joint angles, electromyography, and orthoses torque assistance.
Results: A therapist quickly learned to activate the artificial pneumatic muscles using the pushbuttons with
the appropriate amplitude and timing. The powered orthoses provided ~50% of peak ankle torque. Ankle
angle at stance push-off increased when subjects walked with powered orthoses versus when they walked
with passive-orthoses (ANOVA, p < 0.05). Ankle muscle activation amplitudes were similar for powered
and passive-orthoses conditions except for the soleus (~13% lower for powered condition; p < 0.05).
Two of the five subjects were able to control the orthoses themselves using the pushbuttons. The other
three subjects found it too difficult to coordinate pushbutton timing. Orthoses assistance and maximum
ankle angle at push-off were smaller when the subject controlled the orthoses compared to when the
therapist-controlled the orthoses (p < 0.05). Muscle activation amplitudes were similar between the two
powered conditions except for tibialis anterior (~31% lower for therapist-controlled; p < 0.05).
Conclusion: Mechanical assistance from powered ankle-foot orthoses improved ankle push-off
kinematics without substantially reducing muscle activation during walking in subjects with incomplete
spinal cord injury. These results suggest that robotic plantar flexion assistance could be used during gait
rehabilitation without promoting patient passivity.
Published: 28 February 2006
Journal of NeuroEngineering and Rehabilitation2006, 3:3 doi:10.1186/1743-0003-3-3
Received: 31 October 2005
Accepted: 28 February 2006
This article is available from: />© 2006Sawicki et al; licensee BioMed Central Ltd.
This is an Open Access article distributed under the terms of the Creative Commons Attribution License ( />),
which permits unrestricted use, distribution, and reproduction in any medium, provided the original work is properly cited.
Journal of NeuroEngineering and Rehabilitation 2006, 3:3 />Page 2 of 17
(page number not for citation purposes)
Background
Motor recovery after neurological injury largely depends
on maximizing neural plasticity [1,2]. The degree of func-
tional neural plasticity is highly influenced by the amount
of neural activity during rehabilitation. Passive, imposed
movements can promote activity in sensory pathways but
may not promote activity in motor pathways. Active
movements require voluntary neuromuscular recruitment
resulting in simultaneous activation of both efferent
motor pathways and afferent sensory pathways. Training
that emphasizes voluntary, active movements is much
more effective at enhancing plasticity and increasing
motor performance compared to training that emphasizes
passive, imposed movements [3-5]. Repetitive active prac-
tice strengthens neural connections involved in a motor
task through reinforcement learning. Practice is most
effective when it is task-specific [6,7]. Thus, rehabilitation
after neurological injury should emphasize repetitive,
task-specific practice that promotes active neuromuscular
recruitment in order to maximize motor recovery.
Locomotor training (or bodyweight supported treadmill
training) is a gait rehabilitation method that aims to max-
imize activity-dependent plasticity. This technique was
motivated by studies on the recovery of neural control of
walking in spinalized cats. Spinal cats can re-learn to walk
in response to repetitive step training on a treadmill [8-
10]. Similar ideas have been extended to humans with
neurological injury. The patient wears a harness that pro-
vides partial bodyweight unloading while they practice
stepping on a treadmill. A team of physical therapists
gives manual assistance to guide the lower limbs through
a normal kinematic pattern [11]. To ensure task-specificity
of the practice, therapists focus on providing rhythmic
kinetic and kinematic sensory cues that are characteristic
of healthy walking. Rhythmic limb loading [12], hip
extension at the end of the stance phase [13], and the
combination of contralateral limb movements with ipsi-
lateral limb loading [14] all play some role in altering the
motor output of spinal motor neuron pools. To encourage
active patient effort, therapists provide manual assistance
only 'as needed'. One long-term study reported that 80%
of wheelchair bound patients with chronic incomplete
spinal cord injury gained functional walking ability after
treadmill training with partial bodyweight support and
therapist manual assistance [15]. Locomotor training is a
promising therapy for patients with neurological injury
but places a considerable burden on the therapists who
must administer the manual assistance.
Recent progress in rehabilitation robotics has resulted in
machines that can effectively automate therapist manual
assistance during locomotor training [16]. The Mecha-
nized Gait Trainer [17,18], Lokomat
®
[19,20] and PAM,
POGO and ARTHuR [21] are all examples of robotic
devices that are integrated into a treadmill and body-
weight support system in order to assist stepping. Each of
these devices can actively assist the patient's limbs, guid-
ing them through a pre-programmed physiological gait
pattern by driving the hip and knee. These robotic devices
make it possible for a single therapist to administer loco-
motor training with little physical labor because the
device provides the mechanical assistance. These large,
stationary devices make the job of the therapist easier but
they may encourage passivity by the patient during loco-
motor training. Another drawback to these devices is that
they only assist the hip and knee.
The ankle joint plays an important role in the mechanics
and neural control of walking. The ankle plantar flexors
provide ~70% of the joint work during walking, far more
than the muscles crossing the hip or knee [22,23]. The
muscles acting at the ankle joint act to support the body,
propel the center of mass forward during push-off [24,25]
and reduce energy losses due to the plastic collision of the
leading leg at heel strike [26]. In addition, feedback from
ankle joint afferents is critical to the neural control of
walking [27-30]. Individuals with incomplete spinal cord
injury typically exhibit abnormal ankle kinematics and
deficits in top speed during walking due to lack of propul-
sion [31]. Because of its relative importance to the
mechanics, energetics and control of walking gait, provid-
ing active assistance at the ankle joint during locomotor
training may be important.
Few studies have examined the effect of mechanical assist-
ance during locomotor training on lower limb kinematics
and muscle activation patterns of patients with spinal
cord injury. Two groups reported that healthy subjects
alter muscle activation patterns for walking in the Loko-
mat
®
compared to unassisted walking [32,33] but did not
test neurologically impaired subjects. Hornby et al. [34]
and Colombo et al. [35] examined individuals with spinal
cord injury and found differences in muscle activation
patterns between stepping with Lokomat
®
and stepping
with manual assistance. Both studies found that individu-
als with incomplete spinal cord injury have lower muscle
activation amplitudes with Lokomat
®
assistance compared
to manual assistance. Hornby et al. [34] also provided
data that subjects have 40% lower oxygen consumption
during stepping with Lokomat
®
assistance compared to
stepping with manual assistance. A more thorough under-
standing of how mechanical assistance alters muscle acti-
vation patterns and kinematics in neurologically impaired
subjects is important for development of more effective
rehabilitation robotic devices and strategies.
The goal of this study was to examine the effect of robotic
plantar flexion assistance on the muscle activation and
kinematic patterns of walking in subjects with incomplete
Journal of NeuroEngineering and Rehabilitation 2006, 3:3 />Page 3 of 17
(page number not for citation purposes)
spinal cord injury. To study these effects we built weara-
ble, powered ankle-foot orthoses [36,37]. The orthoses
were lightweight, strong and custom fitted to each subject.
Pneumatic actuators powered ankle plantar flexion [38-
40]. Hand-held pushbuttons allowed a therapist or the
subject to control the timing and magnitude of orthoses
assistance. We hypothesized that powered plantar flexor
assistance would (1) lead to increased plantar flexion at
push-off and (2) reduce neuromuscular recruitment of the
triceps surae group (soleus, medial gastrocnemius and lat-
eral gastrocnemius).
Methods
We recruited two males and three females (height 170.7 ±
10.9 cm; body mass 86.3 ± 22.6 kg; 44.6 ± 13.4 years of
age; mean ± SD) with chronic incomplete spinal cord
injury at the cervical or thoracic level (ASIA C-D). Partici-
pants were required to be greater than 18 years of age,
more than 6 months post injury with no history of ortho-
pedic complications, and to have limited walking ability
(see Table 1 for details). A physician examined and
cleared each subject for participation. Subjects read and
signed a consent form prepared according to the Declara-
tion of Helsinki and approved by the University of Mich-
igan Medical School Institution Review Board for Human
Subject Research.
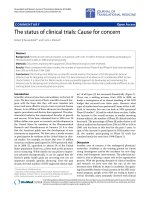
We custom fitted each subject with bilateral ankle-foot
orthoses (Figure 1). Details of the orthosis design have
been described previously [38-40]. Each orthosis con-
sisted of an ankle hinge joint connecting a carbon fiber
shank section and a polypropylene foot section. The
orthoses constrained ankle rotation to the sagittal plane.
We attached a single artificial pneumatic actuator between
two metal brackets on the posterior of each orthosis to
provide powered ankle plantar flexion during walking.
We also attached an elastic cord between brackets on the
anterior of each orthosis to prevent toe drag. A load trans-
ducer (LC8150-375-1K 0–100 lbs, Omega Engineering,
Inc., Stamford, CT) in series with each artificial muscle
monitored the tension that the actuator produced during
walking. Each orthosis weighed 1.09 ± 0.15 kg and had an
average extensor moment arm of 9.7 ± 1.2 cm, flexor
moment arm of 10.0 ± 1.1 cm and artificial muscle length
of 43.3 ± 4.0 cm (all mean ± SD). Four parallel propor-
tional pressure regulators (valve PPC0445A-ACA-
OAGABA09 and solenoid 45A-L00_DGFK-1BA, MAC
Valves, Inc. Wixom, MI) supplied compressed air to each
artificial muscle via nylon tubing (0–6.2 bar). Analog-
controlled solenoid valves in parallel with the air supply
tubing improved exhaust dynamics (35A-AAA-0DAJ-2KJ,
MAC Valves, Inc., Wixom, MI).
We used a real-time computer interface (dSPACE Inc.,
Northville, MI; 1000 Hz sampling) to control the air pres-
sure supplied to the artificial pneumatic muscles based on
a signal generated from a pushbutton held in each hand.
When the pushbutton plunger was fully depressed, a con-
trol signal (10 V) was sent to the pressure regulators to
command maximal air pressure to the artificial pneumatic
muscle. When the pushbutton plunger was not depressed,
no control signal (0 V) was generated and no air pressure
was supplied to the muscle. We programmed the control-
ler to exhibit linear behavior proportional to the displace-
ment of the plunger between no air pressure and
maximum air pressure. The time between the control sig-
Table 1: Subject Information. Data for each subject that describe age, body size, injury level, and walking ability.
Subject Age
(yrs.)
Sex
Height (cm)
Weight (kg)
Injury Etiology Injury
Level
ASIA*
Level
Post
Injury
(mos.)
Walking
Aids
Overgrou
nd Speed
(m/s)
BWS Level (%)
Speeds (m/s)
Active
Orthoses
Conditions
1 54 F
165.1 cm 73.7 kg
Dermoid Tumor T11/T12 C 64 Cane (L,R)
Orthosis (L)
0.41 50%
0.36–0.89
TC,PC
2 52 F
156.2 cm
58.1 kg
Myxopapillary
Ependymoma
T8/L2 D 93 Cane (R) 0.61 30%
0.36–0.89
TC
3 38 F
175.3 cm 115.3
kg
Transverse
Myelitis
T5 D 77 Cane (R)
Orthosis (L)
0.37 50%
0.36–0.89
TC
4 24 M
185.4 cm
101.5 kg
Trauma T10/T11 D 111 _ 0.95 30%
0.36–0.89
TC,PC
5 55 M
171.5 cm
83.0 kg
Sarcoidosis C5/C6 C 144 Cane (R) 0.48 30%
0.36–0.54
TC
* ASIA = American Spinal Injury Association Impairment Scale A = complete E=normal
Journal of NeuroEngineering and Rehabilitation 2006, 3:3 />Page 4 of 17
(page number not for citation purposes)
nal onset and initial rise of artificial muscle tension (~50
ms) of the device is comparable to response times of
human plantar flexors and should not cause compensa-
tory strategies by the user [38]. The pushbutton control-
lers could be operated by a therapist administering
training or by the subject (Figure 1).
Subjects completed two testing sessions. The first day was
a practice session used to assess the required bodyweight
support level and speed capability for each subject. It also
provided a chance for the participants to become accli-
mated to wearing the powered orthoses during locomotor
training. A typical practice session allowed 10–15 minutes
of stepping with the orthoses in each condition (total 30–
45 minutes of stepping). Breaks were given after each bout
of stepping or when the subject requested a rest. Prior to
therapist-controlled and patient-controlled conditions we
informed the therapist and patients that the assistance was
proportional to the pushbutton plunger displacement but
gave no explicit instructions about how much they should
depress the plungers. If needed, some instruction was
given to the subject to help with the timing of the push-
button activation during the patient-controlled condi-
tions. This was done by using verbal cues (eg. "now",
"now") to help them find an appropriate pattern. The
time between the first and second session varied between
subjects from 10–34 days.
On the second day data was acquired while subjects com-
pleted walking trials on a treadmill with a set level of par-
tial bodyweight support at four speeds (0.36, 0.54, 0.72
and 0.89 m/s) under three conditions per speed: (1) with-
out wearing orthoses (without-orthoses, WO) (2) wearing
bilateral orthoses unpowered (passive-orthoses, PA) and
(3) wearing bilateral orthoses powered under pushbutton
control by a therapist (therapist-controlled, TC). Two sub-
jects completed a fourth condition (4) wearing bilateral
orthoses powered under pushbutton control by the sub-
ject her/himself (patient-controlled, PC). One subject
could not complete the 0.72 m/s and 0.89 m/s speeds for
all conditions. Subjects were not blinded to experimental
conditions and given time to re-acclimate themselves with
each experimental condition before data was acquired.
Verbal cues to assist timing were not given during data col-
lection periods. Subjects wore their own athletic shoes for
the without-orthoses condition and commercially availa-
ble orthoses shoes for all other conditions. Heel heights
were similar and should not have affected the results. Par-
tial unloading was provided with a bodyweight support
system (Robomedica Inc., Pasadena, CA). The subjects
wore a modified parachute harness around the trunk that
was attached to a cable supplying a load to offset part of
bodyweight. A feedback controller and pneumatic actua-
tor enforced the desired level of unloading. Unloading
level was set to either 30% (subject supports 70% of his/
her weight) or 50% (subject supports 50% of her/his
weight) depending on walking ability. The bodyweight
support level was constant across the session for each indi-
vidual. Elastic cords provided lateral stabilization. Trials
were pseudo-randomized to eliminate ordering effects.
Breaks were given after each bout of stepping or when the
subject requested a rest. Breaks varied in length but were
typically never longer than 3–5 minutes.
At the beginning of the practice session (day 1) subjects
walked overground with their normal aids (canes, braces,
walkers) so we could record the preferred walking speed.
On day two, during treadmill walking trials, we recorded
two 10-second intervals of bilateral joint angles and foot-
ground contact, lower limb surface electromyography,
pushbutton control signal, artificial muscle force and elas-
tic band force. We recorded bilateral ankle, knee and hip
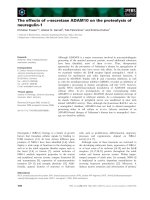
University of Michigan Powered Ankle-Foot OrthosisFigure 1
University of Michigan Powered Ankle-Foot Ortho-
sis. Schematic shows signal flow from hand-held pushbuttons
activated either by a therapist or by the patient. The pushbut-
tons generate a real-time voltage proportional to the amount
of button press. A computer interface converts this voltage
to a control signal (0–10 V). The control signal activates sole-
noid gated pressure valves that regulate the flow of air into
and out of artificial pneumatic muscles on the lightweight car-
bon fiber ankle-foot orthoses. A 24 year old male (ASIA D)
practices walking on a treadmill with partial bodyweight sup-
port using the hand-held pushbuttons to command plantar
flexor torque assistance at his ankles (right).
Pushbutton
Control Signal
Therapist-
Controlled
Patient-
Controlled
Pressure
Regulators
Computer
Interface
Journal of NeuroEngineering and Rehabilitation 2006, 3:3 />Page 5 of 17
(page number not for citation purposes)
joint angles using electrogoniometers (1200 Hz, Biomet-
rics, Ltd., Ladysmith, VA). Goniometers were re-zeroed in
the neutral position before each condition. We recorded
stride cycle data from each foot using a pair of complete
footswitches (B & L Engineering, Tustin CA). We recorded
bilateral lower limb surface electromyography (EMG)
(1200 Hz, Konigsberg Instruments, Inc., Pasadena, CA) of
tibialis anterior (TA), soleus (SOL), medial gastrocnemius
(MG), lateral gastrocnemius (LG), vastus medialis (VM),
vastus lateralis (VL), rectus femoris (RF) and medial ham-
strings (MH) using bipolar surface electrodes (2.5 cm
inter-electrode distance). The EMG amplifier bandwidth
was 1000 Hz. We visually inspected EMG during manual
muscle tests prior to walking to minimize cross talk, mov-
ing electrode placements as necessary. We recorded artifi-
cial pneumatic muscle and elastic band tension using
tension/compression force transducers (1200 Hz, Omega
Engineering, Stamford, CT) placed in series with the
orthoses attachment brackets. All signals were collected
simultaneously via the same data acquisition board to
ensure synchronization.
We formed average stride cycle profiles for EMG, kine-
matic and kinetic variables for each subject using the soft-
ware package Visual 3D (C-Motion Inc., Rockville, MD).
Average stride cycle profiles were calculated from heel
strike to heel strike of the right and left leg using foot con-
tact information from foot switches. All complete stride
cycles occurring for the right and left leg during each of
two 10-second trials for each experimental condition were
used to form the average stride cycle profile. The number
of complete stride cycles captured ranged from 8 to 14
strides depending on the trial speed, trial condition and
fidelity of the data. We calculated the average standard
deviation over the stride cycle (reported in Figures 2 and
5) for each average profile and for each condition to quan-
tify the variability in the data.
EMG data were filtered using a zero-lag fourth-order But-
terworth high pass filter (cutoff frequency 20 Hz) and
then full wave rectified. The stride cycle averaged EMG
data was normalized to the maximum value of the average
stride cycle profile during the without-orthoses condition
at 0.54 m/s for each muscle. To examine changes in EMG
amplitude across conditions, normalized average root
mean square (RMS) EMG values were calculated for each
subject for each condition and speed combination. Aver-
age RMS EMG values were calculated for the total, stance
and swing phases of the gait cycle separately. RMS win-
dow sizes were chosen to match the length of the cycle of
interest and a single average value was computed for each
interval. Average RMS EMG values were normalized to the
maximum value of the average RMS EMG value for the
without-orthoses condition at 0.54 m/s for each muscle.
We also created stride cycle profiles for joint angle data
created from smoothed goniometer data (low pass fil-
tered, cutoff frequency 6 Hz). To examine changes in kin-
ematics across conditions, we calculated the joint range of
motion for the ankle, knee and hip over the gait cycle. In
addition, because our assistance focused on creating
improved ankle push-off kinematics, we measured the
maximum ankle angle over the gait cycle. We also calcu-
lated the total gait cycle duration, stance phase duration,
swing phase duration and double support phase duration.
We created stride cycle control signal profiles from the
recorded pushbutton signal input and stride cycle
orthoses torque profiles from the artificial muscle and
elastic band tension and their respective moment arms.
The orthoses torque was normalized to subject mass. To
quantify the magnitude and repeatability of the control
signal generated by the user (therapist/patient) we calcu-
lated the maximum control signal achieved over the stride
cycle. To quantify the level of mechanical assistance of the
powered orthoses, we calculated the maximum orthoses
torque over the gait cycle. Finally, to examine differences
in the timing of assistance between the therapist-control-
led and patient-controlled conditions, we calculated the
onset of the control signal and the onset of orthoses
plantar flexor torque (i.e. > 0) as a percentage of the gait
cycle.
We used separate repeated measures three-way (by sub-
ject, condition and speed) analysis of variance tests (ANO-
VAs) to test for differences in maximum ankle extension
angle, ankle, knee and hip range of motion and normal-
ized stance phase RMS EMG for the muscles of the lower
leg between conditions (WO, PA, TC) for all five subjects
(JMP IN software, SAS Institute, Inc.). We also calculated
an interaction effect between speed and condition for
ankle range of motion and maximum ankle angle. We car-
ried out the same procedure to test for differences between
active conditions (TC; PC) for the two subjects that could
complete the PC condition. We set the significance level at
p < 0.05 and used Tukey Honestly Significant Difference
(THSD) post-hoc tests where appropriate. Finally we cal-
culated statistical power for each test.
Some data were not included in the average step cycle pro-
files, metric calculations and statistical analysis. Recall
that only four of the five subjects could complete trials at
0.72 m/s and 0.89 m/s. Due to the tight fit of the orthoses
over the lower limbs we lost the TA EMG for one subject.
Two subjects had very low EMG activity in one leg due to
the severity of their injury. For those two subjects we used
only the more active leg to compute subject averages. In
addition, for one subject we could not calculate double
support duration because of a damaged footswitch.
Journal of NeuroEngineering and Rehabilitation 2006, 3:3 />Page 6 of 17
(page number not for citation purposes)
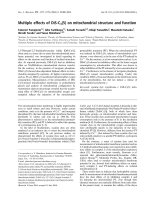
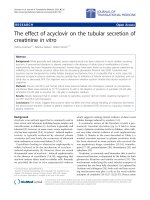
Kinematics, kinetics and electromyography for without vs. passive vs. therapist-controlled-orthosesFigure 2
Kinematics, kinetics and electromyography for without vs. passive vs. therapist-controlled-orthoses. Mean data
for five subjects with incomplete spinal cord injury who walked with partial bodyweight support on a treadmill at 0.54 m/s
while wearing no orthoses (without-orthoses), wearing orthoses unpowered (passive-orthoses) and wearing orthoses pow-
ered under pushbutton control by a therapist (therapist-controlled orthoses). Stride cycles begin (0%) and end (100%) at heel
strike. Double support phases are indicated by vertical lines. The average standard deviation over the stride cycle for each sig-
nal and each condition is reported to the right of each plot in units consistent with that signal.
Without
Orthoses
Therapist-
Controlled
Orthoses
Passive
Orthoses
Control
Signal
(V)
Ankle
Angle
(deg)
Orthosis
Net Torque
(N-m/kg)
Knee
Angle
(deg)
Hip
Angle
(deg)
-20
20
-0.05
0.4
-70
0
-35
5
Stride Cycle (%)
0 100
Tibialis
Anterior
EMG
(Normalized)
Soleus EMG
(Normalized)
Medial
Gastrocnemius
EMG
(Normalized)
Lateral
Gastrocnemius
EMG
(Normalized)
Rectus
Femoris EMG
(Normalized)
Stride Cycle (%)
0 100
0
1.2
0
1.2
0
1.2
0
1.2
0
10
WO= N/A
PA= N/A
TC= ±1.4
WO= N/A
PA= ±0.01
TC= ±0.07
WO= ±8.6
PA= ±7.4
TC= ±8.6
WO= ±10.8
PA= ±12.2
TC= ±11.4
WO= ±6.9
PA= ±6.6
TC= ±7.4
0
1.2
+ PF
+ PF
+ EXT
+ EXT
WO= ±0.16
PA= ±0.15
TC= ±0.12
WO= ±0.16
PA= ±0.17
TC= ±0.14
WO= ±0.18
PA= ±0.23
TC= ±0.22
WO= ±0.20
PA= ±0.25
TC= ±0.20
WO= ±0.17
PA= ±0.19
TC= ±0.24
Journal of NeuroEngineering and Rehabilitation 2006, 3:3 />Page 7 of 17
(page number not for citation purposes)
Table 2: Kinematics for without, passive, and therapist-controlled orthoses by speed. Mean ± standard error and statistical results for kinematics of subjects with incomplete
spinal cord injury who walked without-orthoses (WO), wearing orthoses unpowered or passive (PA) and wearing orthoses powered under pushbutton control by a therapist
(TC) for 0.36 m/s (five subjects), 0.54 m/s (five subjects), 0.72 m/s (four subjects) and 0.89 m/s (four subjects).
ANOVA
p-value
THSD 0.36 m/s 0.54 m/s 0.72 m/s 0.89 m/s
WO PA TC WO PA TC WO PA TC WO PA TC
Ankle ROM (deg) 17.3 ± 4.0 16.5 ± 2.5 31.2 ± 3.5 19.8 ± 5.1 18.9 ± 2.5 29.9 ± 1.8 25.6 ± 6.9 21.7 ± 3.6 27.7 ± 3.5 25.7 ± 7.3 23.7 ± 3.9 25.9 ± 2.7
Max Ankle (deg) <0.0001 *
P = 1.00
TC > PA
TC > WO
PA < WO
2.8 ± 4.2 -1.0 ± 3.9 13.5 ± 3.9 4.0 ± 4.2 0.72 ± 3.9 12.0 ± 3.7 10.7 ± 4.4 4.4 ± 3.4 11.8 ± 2.6 12.0 ± 5.6 6.8 ± 3.5 10.3 ± 1.7
Knee ROM (deg) 0.4136
P = 0.20
44.4 ± 8.8 43.3 ± 8.7 47.3 ± 8.7 44.3 ± 9.7 47.9 ± 7.1 49.4 ± 6.6 52.6 ± 9.1 53.0 ± 5.9 53.6 ± 5.0 53.5 ± 8.7 54.1 ± 5.1 52.9 ± 4.1
Hip ROM (deg) <0.0001 *
P = 1.00
TC < PA
TC < WO
25.6 ± 3.4 24.6 ± 3.5 23.2 ± 2.8 28.4 ± 3.1 28.2 ± 2.7 23.9 ± 2.9 31.5 ± 4.0 28.7 ± 3.5 24.3 ± 3.3 33.6 ± 3.3 32.0 ± 3.6 26.4 ± 3.5
Total Time (s) 0.2360
P = 0.30
1.98 ± 0.24 1.92 ± 0.22 1.88 ± 0.14 1.65 ± 0.17 1.62 ± 0.15 1.54 ± 0.13 1.57 ± 0.15 1.49 ± 0.13 1.42 ± 0.09 1.31 ± 0.08 1.35 ± 0.11 1.34 ± 0.07
Stance Time (s) 0.7611
P = 0.10
1.26 ± 0.19 1.18 ± 0.15 1.26 ± 0.15 1.01 ± 0.11 0.98 ± 0.10 0.99 ± 0.10 0.92 ± 0.09 0.88 ± 0.07 0.87 ± 0.08 0.76 ± 0.03 0.80 ± 0.07 0.74 ± 0.05
Swing Time (s) 0.0643
P = 0.54
0.72 ± 0.06 0.74 ± 0.09 0.61 ± 0.07 0.65 ± 0.06 0.63 ± 0.06 0.56 ± 0.05 0.65 ± 0.06 0.62 ± 0.06 0.56 ± 0.04 0.53 ± 0.06 0.55 ± 0.06 0.60 ± 0.07
Double Support Time (s) 0.0173 *
P = 0.74
TC > WO 0.27 ± 0.12 0.27 ± 0.06 0.43 ± 0.15 0.18 ± 0.06 0.22 ± 0.05 0.25 ± 0.06 0.13 ± 0.03 0.15 ± 0.04 0.17 ± 0.04 0.06 ± 0.04 0.14 ± 0.04 0.14 ± 0.01
Values are means ± SE. See METHODS for calculations.
* Indicates a p-value of less than 0.05 showing significant differences between conditions. Statistical power, P, is reported under the p-value. Tukey Honestly Significant Difference, THSD, results
are reported for metrics with significance.
Five subjects completed all conditions at 0.36 m/s and 0.54 m/s. Four subjects completed all conditions at 0.72 m/s and 0.89 m/s.
Double support time is for four subjects for all conditions at all speeds.
Journal of NeuroEngineering and Rehabilitation 2006, 3:3 />Page 8 of 17
(page number not for citation purposes)
Table 3: Stance RMS EMG for without, passive and therapist-controlled orthoses by speed. Mean ± standard error and statistical results for the normalized average root mean
square muscle activation calculated from the stance phase electromyography records for: tibialis anterior (TA), soleus (SOL), medial gastrocnemius (MG), lateral
gastrocnemius (LG), vastus medialis (VM), vastus lateralis (VL), rectus femoris (RF) and medial hamstrings (MH). Subjects with partial paralysis walked without-orthoses
(WO), wearing orthoses unpowered or passive (PA) and wearing orthoses powered under pushbutton control by a therapist (TC) at 0.36 m/s (five subjects), 0.54 m/s (five
subjects), 0.72 m/s (four subjects) and 0.89 m/s (four subjects). TA is for four subjects at all speeds. Stance phase root mean square EMG was normalized to the without
condition at 0.54 m/s for each muscle.
ANOVA p-
value
THSD 0.36 m/s 0.54 m/s 0.72 m/s 0.89 m/s
WO PA TC WO PA TC WO PA TC WO PA TC
TA 0.0845
P = 0.49
0.87 ± 0.16 0.72 ± 0.16 0.75 ± 0.10 0.89 ± 0.02 0.75 ± 0.12 0.81 ± 0.14 1.10 ± 0.12 0.99 ± 0.12 0.80 ± 0.16 1.04 ± 0.10 1.07 ± 0.04 0.79 ± 0.15
SOL 0.0197 *
P = 0.72
TC < PA 0.81 ± 0.08 0.94 ± 0.06 0.80 ± 0.05 0.95 ± 0.02 1.07 ± 0.06 0.87 ± 0.07 1.06 ± 0.08 1.07 ± 0.06 0.99 ± 0.07 1.14 ± 0.10 1.27 ± 0.15 1.12 ± 0.06
MG 0.0229 *
P = 0.70
PA > WO 0.70 ± 0.11 0.87 ± 0.11 0.79 ± 0.13 0.92 ± 0.02 1.12 ± 0.08 1.00 ± 0.07 1.03 ± 0.10 1.14 ± 0.10 1.08 ± 0.10 1.12 ± 0.13 1.34 ± 0.19 1.27 ± 0.13
LG 0.0436 *
P = 0.61
PA > WO 0.79 ± 0.09 0.91 ± 0.08 0.83 ± 0.10 0.93 ± 0.01 1.08 ± 0.08 0.98 ± 0.07 1.03 ± 0.10 1.15 ± 0.02 1.12 ± 0.06 1.18 ± 0.07 1.35 ± 0.09 1.35 ± 0.14
VM 0.0145 *
P = 0.76
PA > WO 0.81 ± 0.05 0.94 ± 0.05 0.83 ± 0.04 0.97 ± 0.00 1.09 ± 0.07 1.08 ± 0.08 1.12 ± 0.05 1.16 ± 0.06 1.06 ± 0.07 1.16 ± 0.02 1.26 ± 0.05 1.14 ± 0.08
VL 0.0424 *
P = 0.61
PA > WO 0.86 ± 0.03 0.95 ± 0.03 0.90 ± 0.06 0.96 ± 0.01 1.16 ± 0.09 1.05 ± 0.11 1.10 ± 0.04 1.18 ± 0.10 1.07 ± 0.14 1.12 ± 0.02 1.21 ± 0.08 1.16 ± 0.19
RF 0.0123 *
P = 0.77
TC < PA
PA > WO
0.85 ± 0.04 0.94 ± 0.03 0.93 ± 0.08 0.95 ± 0.01 1.13 ± 0.06 1.06 ± 0.09 1.17 ± 0.09 1.15 ± 0.06 1.01 ± 0.10 1.17 ± 0.03 1.30 ± 0.08 1.09 ± 0.13
MH 0.1954
P = 0.34
0.92 ± 0.03 0.86 ± 0.06 0.89 ± 0.07 0.92 ± 0.02 0.98 ± 0.04 1.02 ± 0.08 1.02 ± 0.07 1.03 ± 0.10 1.22 ± 0.18 1.03 ± 0.08 1.13 ± 0.13 1.19 ± 0.22
Values are means ± SE. Data are unitless because of normalization. See METHODS for calculations.
* Indicates a p-value of less than 0.05 showing significant differences between conditions. Statistical power, P, is reported under the p-value. Tukey Honestly Significant Difference, THSD,
results are reported for metrics with significance.
Five subjects completed all conditions at 0.36 m/s and 0.54 m/s. Four subjects completed all conditions at 0.72 m/s and 0.89 m/s.
TA is for four subjects for all conditions at all speeds.
Journal of NeuroEngineering and Rehabilitation 2006, 3:3 />Page 9 of 17
(page number not for citation purposes)
Results
Subjects' preferred overground walking speed with their
walking aids was 0.56 ± 0.10 m/s (all data reported are
mean ± SE). Table 1 indicates the speeds and walking aids
used for each subject. Four of the five subjects exceeded
their preferred overground walking speed when walking
at their top treadmill speed.
The data that follows in the results section are from the
second day of testing after the training session was com-
pleted (see Methods). With the exception of ankle joint
kinematics, all differences in conditions showed similar
trends across speeds. Therefore, data reported in the text
are averaged by condition across subjects and speeds
unless otherwise noted. In addition, data averaged by
speed and by condition across subjects are reported in
Tables 2, 3, 4, 5.
Therapist-controlled vs. passive and without-orthoses
Within the thirty-minute practice session, the therapist
was able to activate the hand-held pushbuttons to pro-
duce appropriate timing of powered assistance for all sub-
jects. The therapist required only a few minutes of practice
with some subjects while other subjects required a longer
training period. In all cases, both the therapist and subject
agreed that they established a consistent walking pattern
by the end of the thirty-minute practice session.
The control signal generated by the therapist had an onset
in early stance at 25.5 ± 3.3% of the gait cycle. Peak con-
trol signal activation was 8.8 ± 0.3 V (out of 10 V) and
resulted in orthoses ankle plantar flexor torque onset at
34.2 ± 4.0% of the gait cycle. The powered orthoses
applied 0.38 ± 0.03 N-m/kg peak ankle plantar flexion
torque at the end of the stance phase (Figure 2).
Powered assistance under therapist control modified joint
kinematics compared to the other conditions. Ankle joint
range of motion was greater for the therapist-controlled
orthoses condition compared to the passive-orthoses and
without-orthoses conditions (ANOVA, p < 0.0001) (Fig-
ure 2, Table 2). Subjects achieved an ankle range of
motion of 28.9 ± 1.4 degrees while walking with the
orthoses providing torque assistance under therapist con-
trol. This was 9 degrees more than while walking with the
orthoses passive and 7 degrees more than while walking
without the orthoses. The improvement in ankle range of
motion was mainly due to increased plantar flexion at
push-off. In the therapist-controlled active condition the
subjects walked with a maximum ankle angle at push-off
of 12.0 ± 1.5 degrees. This was 9.6 degrees more than for
walking with the orthoses passive and 5.1 degrees more
than for walking without the orthoses.
Improvements in ankle kinematics due to powered
plantar flexion assistance were larger for slow walking
speeds than for fast walking speeds (Figure 3, Table 2).
There was a significant interaction between speed and
condition for the maximum ankle angle at push-off (p =
0.02). At 0.54 m/s the maximum ankle angle was 11
Table 4: Kinematics for therapist-controlled and patient-controlled orthoses by speed. Mean ± standard error and statistical results for
kinematics of two subjects with incomplete spinal cord injury who walked wearing orthoses powered under pushbutton control by a
therapist (TC) and wearing orthoses powered under pushbutton control by the patient him/herself (PC) for 0.36 m/s, 0.54 m/s, 0.72 m/
s and 0.89 m/s.
ANOVA p-
value
THSD 0.36 m/s 0.54 m/s 0.72 m/s 0.89 m/s
TC PC TC PC TC PC TC PC
Ankle
ROM (deg)
0.1613
P = 0.28
25.8 ± 2.9 22.3 ± 2.2 29.4 ± 1.3 24.0 ± 7.5 23.1 ± 3.1 20.5 ± 3.0 22.1 ± 3.6 23.7 ± 2.4
Max Ankle
(deg)
0.0224 *
P = 0.68
PC < TC 13.2 ± 0.9 8.5 ± 0.5 15.5 ± 5.9 7.8 ± 2.9 9.5 ± 2.6 3.9 ± 1.3 8.7 ± 2.1 7.5 ± 0.3
Knee ROM
(deg)
0.3591
P = 0.14
52.9 ± 5.7 55.4 ± 7.4 55.5 ± 5.1 54.1 ± 8.7 56.6 ± 4.7 57.3 ± 5.1 55.8 ± 3.9 58.3 ± 7.4
Hip ROM
(deg)
0.1172
P = 0.34
18.2 ± 5.8 23.3 ± 13.7 18.6 ± 5.4 24.3 ± 12.8 21.2 ± 6.7 24.8 ± 14.5 22.4 ± 5.6 26.3 ± 15.4
Total Time
(s)
0.0631
P = 0.47
1.71 ± 0.14 1.67 ± 0.24 1.46 ± 0.13 1.42 ± 0.12 1.31 ± 0.05 1.24 ± 0.10 1.31 ± 0.15 1.15 ± 0.05
Stance
Time (s)
0.0145 *
P = 0.76
PC < TC 1.20 ± 0.01 1.08 ± 0.08 0.93 ± 0.01 0.90 ± 0.00 0.80 ± 0.01 0.73 ± 0.00 0.70 ± 0.03 0.67 ± 0.01
Swing
Time (s)
0.5458
P = 0.09
0.50 ± 0.12 0.57 ± 0.15 0.53 ± 0.12 0.52 ± 0.11 0.51 ± 0.06 0.50 ± 0.10 0.62 ± 0.17 0.48 ± 0.06
Double
Support
Time (s)
N/A 0.41 ± 0.00 0.29 ± 0.00 0.26 ± 0.00 0.24 ± 0.00 0.18 ± 0.00 0.17 ± 0.00 0.14 ± 0.00 0.13 ± 0.00
Values are means ± SE. See METHODS for calculations.
* Indicates a p-value of less than 0.05 showing significant differences between conditions. Statistical power, P, is reported under the p-value. Tukey
Honestly Significant Difference, THSD, results are reported for metrics with significance.
Two subjects completed all conditions at all speeds.
Double support time is for a single subject. As a result no statistical tests could be carried out for this metric.
Journal of NeuroEngineering and Rehabilitation 2006, 3:3 />Page 10 of 17
(page number not for citation purposes)
degrees more in the therapist-controlled orthoses versus
the passive-orthoses condition but at 0.89 m/s that differ-
ence was only 3.5 degrees.
Knee and hip joint kinematics were not modified as
greatly as ankle joint kinematics in the powered orthoses
condition. The knee joint range of motion was not signif-
icantly different between conditions or across speeds (p >
0.05). Powered torque assistance decreased hip joint
range of motion slightly compared to the passive condi-
tion (p < 0.0001) (Figure 2, Table 2). When subjects
walked with the orthoses passive the hip joint range of
motion was 28.2 ± 1.6. When the subjects walked wearing
the orthoses powered under therapist control the hip
range of motion decreased by ~4 degrees to 24.4 ± 1.4
degrees.
Therapist-controlled powered ankle assistance signifi-
cantly increased the time of double support when com-
pared to the without-orthoses condition (p < 0.05) (Table
2). The average time for double support in the therapist-
controlled orthoses condition was 88 ms longer than the
without-orthoses condition and 55 ms longer than the
passive-orthoses condition. The total, stance phase and
swing phase average gait cycle durations were not signifi-
cantly different between conditions (p > 0.05).
Activation in five of the eight muscles studied was signifi-
cantly higher when subjects walked with orthoses passive
compared to when they walked without orthoses. Figure 4
shows the average normalized root mean square EMG of
the ankle muscles over the stance phase of walking for
each speed. Muscle activation was significantly higher in
the passive-orthoses condition for medial gastrocnemius
(18% higher) and lateral gastrocnemius (14% higher) (p
< 0.05) (Table 3). For the knee extensor muscles, the
stance phase RMS EMG for vastus medialis (10% higher),
vastus lateralis (12% higher) and rectus femoris (10%
higher) was greater in the passive-orthoses condition than
in the without-orthoses condition (p < 0.05) (Table 3).
There was no difference in activation for tibialis anterior,
soleus or medial hamstrings (p > 0.05).
Powered assistance under therapist control slightly
decreased muscle activity in the soleus but not in medial
or lateral gastrocnemius (Figure 2, Figure 4). Soleus RMS
EMG decreased by 13% in the therapist-controlled condi-
tion compared to the passive condition (p < 0.05) (Table
3). Medial and lateral gastrocnemius RMS EMG decreased
Table 5: Stance RMS EMG for therapist-controlled and patient-controlled orthoses by speed. Mean ± standard error and statistical
results for the normalized average root mean square muscle activation calculated from the stance phase electromyography records
for: tibialis anterior (TA), soleus (SOL), medial gastrocnemius (MG), lateral gastrocnemius (LG), vastus medialis (VM), vastus lateralis
(VL), rectus femoris (RF) and medial hamstrings (MH). Two subjects with partial paralysis walked with orthoses powered under
pushbutton control by a therapist (TC) and with orthoses powered under pushbutton control by the patient him/herself (PC) at 0.36
m/s, 0.54 m/s, 0.72 m/s and 0.89 m/s. Stance phase root mean square EMG was normalized to the without condition at 0.54 m/s for
each muscle.
ANOVA
p-value
THSD 0.36 m/s 0.54 m/s 0.72 m/s 0.89 m/s
TC PC TC PC TC PC TC PC
TA 0.0090 *
P = 0.83
PC > TC 0.61 ± 0.16 0.89 ± 0.54 0.71 ± 0.32 1.01 ± 0.58 0.76 ± 0.27 1.08 ± 0.41 0.66 ± 0.14 1.04 ± 0.45
SOL 0.4801
P = 0.10
0.85 ± 0.16 0.73 ± 0.33 0.80 ± 0.13 0.78 ± 0.40 0.99 ± 0.16 0.94 ± 0.52 1.13 ± 0.09 1.03 ± 0.49
MG 0.7697
P = 0.06
0.95 ± 0.09 0.92 ± 0.20 0.97 ± 0.01 1.03 ± 0.24 1.17 ± 0.04 1.16 ± 0.35 1.39 ± 0.10 1.26 ± 0.34
LG 0.7072
P = 0.06
0.93 ± 0.21 0.88 ± 0.22 0.95 ± 0.01 1.01 ± 0.28 1.20 ± 0.09 1.21 ± 0.44 1.53 ± 0.21 1.29 ± 0.42
VM 0.2861
P = 0.18
0.86 ± 0.01 0.97 ± 0.07 1.09 ± 0.10 0.77 ± 0.25 1.13 ± 0.07 1.17 ± 0.09 1.22 ± 0.13 1.02 ± 0.00
VL 0.1380
P = 0.31
0.95 ± 0.03 0.89 ± 0.04 0.95 ± 0.03 0.65 ± 0.16 0.98 ± 0.04 1.00 ± 0.16 0.98 ± 0.04 0.91 ± 0.06
RF 0.6351
P = 0.07
0.88 ± 0.06 0.82 ± 0.01 0.94 ± 0.03 0.63 ± 0.18 0.96 ± 0.00 1.12 ± 0.23 0.94 ± 0.05 0.97 ± 0.06
MH 0.3099
P = 0.16
1.01 ± 0.01 1.36 ± 0.35 1.17 ± 0.14 1.18 ± 0.68 1.43 ± 0.34 1.73 ± 0.48 1.48 ± 0.38 1.38 ± 0.31
Values are means ± SE. Data are unitless because of normalization. See METHODS for calculations.
* Indicates a p-value of less than 0.05 showing significant differences between conditions. Statistical power, P, is reported under the p-value. Tukey
Honestly Significant Difference, THSD, results are reported for metrics with significance.
Two subjects completed all conditions at all speeds.
Journal of NeuroEngineering and Rehabilitation 2006, 3:3 />Page 11 of 17
(page number not for citation purposes)
by 7% and 5%, respectively, in the therapist-controlled
condition compared to the passive condition, but these
differences were not statistically significant (p > 0.05)
(Figure 4, Table 3).
Therapist-controlled powered assistance at the ankle joint
had little effect on activation in the knee muscles. Medial
hamstrings and vasti RMS EMG were not affected by ther-
apist-controlled powered assistance (p > 0.05) (Table 3).
Rectus femoris RMS EMG was 9% lower in the therapist-
controlled orthoses condition compared to the passive-
orthoses condition (p < 0.05) (Table 3).
Patient-controlled vs. therapist-controlled orthoses
Two of the five subjects learned to use the pushbuttons to
control the timing and amplitude of the orthoses assist-
ance. The three other subjects practiced but were unable to
learn the appropriate timing of the pushbuttons possibly
due to the high level of cognitive attention and coordina-
tion required.
The amplitude and timing of the control signal was simi-
lar for the patient-controlled orthoses and therapist-con-
trolled orthoses conditions. The two successful subjects
generated a control signal with onset at 33.4 ± 2.2% of the
gait cycle. The control signal reached a maximum 9.4 ± 0.3
V. This resulted in orthoses ankle plantar flexor torque
onset at 43.5 ± 3.7% of the gait cycle. The timing of torque
onset was not significantly different from the therapist-
controlled orthoses condition (p > 0.05) (Figure 5).
The amplitude of orthoses torque assistance was lower for
the patient-controlled orthoses condition compared to
the therapist-controlled orthoses condition (p < 0.05)
(Figure 5). The powered orthoses applied 0.33 ± 0.02 N-
m/kg peak ankle plantar flexor torque near the end of the
stance phase. This was ~0.07 N-m/kg lower than the ther-
apist-controlled orthoses condition.
Joint kinematics were similar between the patient-control-
led orthoses and therapist-controlled orthoses conditions
with a few exceptions. The maximum ankle angle at push-
off was ~5 degrees lower in the patient-controlled condi-
tion when compared to the therapist-controlled condition
(p < 0.05) (Figure 5, Table 4). There were no significant
differences at the knee or hip (p > 0.05) (Figure 5, Table
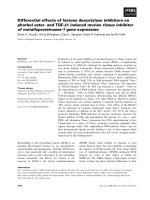
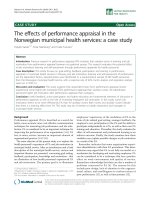
Ankle kinematics for without vs. passive vs. therapist-controlled orthoses across speedsFigure 3
Ankle kinematics for without vs. passive vs. therapist-controlled orthoses across speeds. Mean ankle joint angle
data for subjects with incomplete spinal cord injury who walked on a treadmill with partial bodyweight support at (left to right)
0.36 m/s (five subjects), 0.54 m/s (five subjects), 0.72 m/s (four subjects) and 0.89 m/s (four subjects). For each speed, subjects
walked wearing no orthoses (without-orthoses), wearing orthoses unpowered (passive-orthoses) and wearing orthoses pow-
ered under pushbutton control by a therapist (therapist-controlled orthoses). Stride cycles begin (0%) and end (100%) at heel
strike. Double support phases are indicated by vertical lines.
Without
Orthoses
Therapist-
Controlled
Orthoses
Passive
Orthoses
0.36 m/s 0.54 m/s
0.72 m/s 0.89 m/s
Stride Cycle (%) Stride Cycle (%) Stride Cycle (%) Stride Cycle (%)
Ankle
Angle
(deg)
20
-20
0 100
0 100
0100
0100
+ PF
-DF
Journal of NeuroEngineering and Rehabilitation 2006, 3:3 />Page 12 of 17
(page number not for citation purposes)
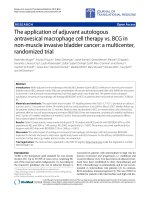
Stance phase RMS EMG for without vs. passive vs. therapist-controlled orthoses across speedsFigure 4
Stance phase RMS EMG for without vs. passive vs. therapist-controlled orthoses across speeds. Muscle activation
amplitudes for tibilais anterior (TA), soleus (SOL), medial gastrocnemius (MG) and lateral gastrocnemius (LG). Data is from
subjects with partial paralysis who walked with partial bodyweight support on a treadmill at (top to bottom) 0.36 m/s (five sub-
jects), 0.54 m/s (five subjects), 0.72 m/s (four subjects) and 0.89 m/s (four subjects). Bars indicate mean ± standard error of the
normalized average root mean square (RMS) EMG amplitude calculated during the stance phase for walking without-orthoses
(WO), wearing orthoses unpowered or passive (PA) and wearing orthoses powered under pushbutton control by a therapist
(TC).
Normalized
RMS EMG
Normalized
RMS EMG
Normalized
RMS EMG
Normalized
RMS EMG
0
1.5
TA SOL MG LG
0.54 m/s
0
1.5
TA SOL MG LG
0.89 m/s
0
1.5
TA SOL MG LG
0.36 m/s
0
1.5
TA SOL MG LG
0.72 m/s
Therapist-
Controlled
Orthoses
Passive
Orthoses
Without
Orthoses
Journal of NeuroEngineering and Rehabilitation 2006, 3:3 />Page 13 of 17
(page number not for citation purposes)
Kinematics, kinetics and electromyography for therapist-controlled vs. patient-controlled orthosesFigure 5
Kinematics, kinetics and electromyography for therapist-controlled vs. patient-controlled orthoses. Mean data
for two subjects with incomplete spinal cord injury walking at 0.54 m/s wearing the orthoses powered under pushbutton con-
trol by a therapist (therapist-controlled orthoses) and powered under pushbutton control by themselves (patient-controlled
orthoses). Stride cycles begin (0%) and end (100%) at heel strike. Double support phases are indicated by vertical lines. The
average standard deviation over the stride cycle for each signal and each condition is reported to the right of each plot in units
consistent with that signal.
0
10
Therapist-
Controlled
Orthoses
Patient-
Controlled
Orthoses
Control
Signal
(V)
Ankle
Angle
(deg)
Orthosis
Net Torque
(N-m/kg)
Knee
Angle
(deg)
Hip
Angle
(deg)
Tibialis
Anterior EMG
(Normalized)
+ EXT
+ EXT
+ PF
+ PF
Stride Cycle (%)
0 100
0
1.2
-0.05
0.4
-20
20
-70
0
-35
5
TC= ±0.8
PC= ±1.2
TC= ±0.03
PC= ±0.03
TC= ±5.9
PC= ±4.4
TC= ±8.8
PC= ±9.4
TC= ±4.5
PC= ±7.2
TC= ±0.08
PC= ±0.11
Journal of NeuroEngineering and Rehabilitation 2006, 3:3 />Page 14 of 17
(page number not for citation purposes)
4). The stance time was 843 ± 62 ms in the patient-con-
trolled condition. This was significantly different (~64 ms
less) than the therapist-controlled condition (p < 0.05)
(Table 4).
There were no significant differences in the activation of
any muscles except for tibialis anterior. Tibialis anterior
RMS EMG was 45% higher in the patient-controlled con-
dition than therapist-controlled condition (p < 0.05) (Fig-
ure 5, Table 5).
Discussion
The purpose of this study was to test the effects of robotic
mechanical assistance at the ankle on joint kinematics
and muscle activation patterns during walking by subjects
with incomplete spinal cord injury. The robotic assistance
resulted in ankle push-off kinematics similar to healthy
walking at slower walking speeds and a slight reduction in
muscle activation of the soleus but not the medial or lat-
eral gastrocnemius across speeds.
Under therapist control, the therapist quickly learned to
use pushbuttons to activate the orthoses, providing ankle
torque with timing and amplitude similar to normal
walking. In healthy subjects, triceps surae muscles nor-
mally develop active force from 10% to 60% of the stride
cycle [41]. In our study, the therapist activated the
orthoses so that they developed active force from 25% to
60% of the stride cycle (Figure 2). Peak plantar flexion
torque in healthy subjects ranges from ~1.0–1.75 N-m/kg
[42,43]. In this study the orthoses generated less peak
torque (~0.4 N-m/kg), but bodyweight support (~38%
unloading on average) decreased the mechanical loading
of the limbs. Both forward and vertical work per stride are
reduced in direct proportion to bodyweight unloading
during walking [44]. Assuming that the same propor-
tional reduction occurs in the peak ankle torque for
healthy walking, we would expect peak plantar flexion
torque to range from ~0.62–1.1 N-m/kg with ~38% bod-
yweight unloading. Therefore, the orthoses provided
~36–65% of the normal peak plantar flexion torque
expected during walking with this level of bodyweight
support. When the powered ankle-foot orthoses were
worn by healthy subjects during walking without body-
weight support, they provided ~56% peak ankle plantar
flexor torque [40]. It is important to highlight the possi-
bility that adjustments by both the patient and therapist
could result in the observed timing of ankle assistance.
Future work could examine the transient behaviour of
both the patient and therapist during the period leading
up to when a steady cycle is established.
The torque assistance supplied by the powered ankle-foot
orthoses improved ankle push-off kinematics at slower
speeds. For healthy subjects walking at 0.54 m/s, ankle
angle at push-off is ~10–12 degrees plantar flexion [45].
Ankle angle trajectories are not affected by bodyweight
support levels below 75% so the support levels in this
study should not have affected ankle kinematics [45]. A
smaller ankle angle at push-off is typical of subjects with
spinal cord injury due to limited ankle propulsion at the
end of the stance phase [31]. As expected, our subjects
were unable to reach normal plantar flexion when walk-
ing at 0.54 m/s without the orthoses (mean 4 deg) or with
passive-orthoses (mean 1 deg). When subjects walked at
0.54 m/s with powered orthoses under therapist control,
maximum ankle angle near push-off increased to a nor-
mal level (mean 12 degrees) (Table 2). The time of double
support was significantly greater in the therapist-control-
led condition (Table 2). Increased double support time
can be an indication of reduced stability. Some subjects
reported that they felt unstable in the active conditions.
Perhaps training over multiple sessions could improve
stability.
The powered orthoses were not as effective at increasing
ankle push-off angle at higher walking speeds. For both
healthy and subjects with spinal cord injury, ankle push-
off angle increase as walking speed increases [31,45].
When our subjects walked without orthoses and with pas-
sive-orthoses, maximum ankle angle at push-off increased
with speed as expected (Figure 3, Table 2). In contrast,
there was a decrease in ankle angle at push-off with
increasing speed when subjects walked with the powered
orthoses. Two possible explanations are pneumatic actua-
tor limitations and pushbutton control limitations. It is
unlikely that the actuators caused the decline in ankle
range of motion at faster speeds. A previous study using
the powered orthoses on healthy subjects demonstrated
ample force production and range of motion at faster
walking speeds [40]. That study used footswitch control-
lers to activate the pneumatic actuators automatically dur-
ing stance rather than handheld pushbuttons. It is
possible that faster walking speeds required more precise
timing of the pushbuttons to activate the artificial mus-
cles. In the current study, the stance phase duration
decreased from 1.26 seconds to 0.74 seconds as walking
speed increased from 0.36 m/s to 0.89 m/s. Shorter stance
duration results in a smaller time period to activate the
orthoses assistance. Small absolute errors in timing may
become significant at fast speeds because of increased rel-
ative error with respect to the stride cycle. To reduce the
possibility for errors in timing future designs could auto-
matically trigger assistance during the stride with a foots-
witch.
An important result of this study was that mechanical
assistance at the ankle joint did not substantially reduce
muscle activation in the plantar flexors. Sinkjaer et al. [46]
used a mechanical device to quickly perturb the ankle
Journal of NeuroEngineering and Rehabilitation 2006, 3:3 />Page 15 of 17
(page number not for citation purposes)
joint during walking and found a clear plantar flexor mus-
cle response to imposed loading in healthy subjects.
When the ankle was forced into rapid plantar flexion,
soleus activity was reduced by up to ~50% [46]. They con-
cluded that muscle spindle group II afferents and Golgi
tendon organ group Ib afferents were responsible for these
modifications in muscle recruitment. In our study,
mechanical assistance caused only a 13% decrease in
soleus muscle activation during stance (Figure 4, Table 2).
An important difference between the perturbation study
and our study is the rate of the ankle unloading. In the
perturbation study, the ankle joint was rapidly unloaded
at approximately 440 N-m/s. In our study, the ankle joint
was unloaded at approximately 85 N-m/s. This rate is
more characteristic of normal plantar flexion torque
development [40]. Studies that use full body unloading
are more analogous to the unloading in our study because
the bodyweight support is nearly constant (i.e. unloading
rate ~0 N-m/s). Ferris et al. found a 10–15% reduction in
soleus muscle activation with 50% bodyweight support in
healthy subjects [47]. Harkema et al. [12] reported similar
reductions in soleus muscle activation in subjects with
incomplete spinal cord injury.
When subjects walked with passive-orthoses, muscle
activity during stance increased in five of the eight muscles
compared to the without-orthoses condition. There are
several factors that may have led to this result. The elastic
bands providing dorsiflexion torque on the orthoses
could have influenced the stance phase activation by
resisting plantar flexion. The orthosis added mass to the
lower limb, but this should have only affected swing
phase muscle activation rather than stance phase muscle
activation. The orthoses limited ankle joint motion to
dorsiflexion/plantar flexion and stabilized the other
degrees of freedom of the ankle joint. It is possible that
increased joint stability in off axis motion could lead to a
decrease in neural inhibition to the plantar flexors [48-
50]. Future studies should examine these possibilities in
greater detail as they could potentially have clinical impli-
cations for improving gait of individuals with spinal cord
injury.
Although we expected that subjects would be able to use
the pushbuttons to control the orthoses, most were not
able to do so. Three of five subjects were unable to ade-
quately control the orthoses with the pushbuttons. Cogni-
tive deficits, sensory impairment, spasticity and muscle
weakness are all factors common in spinal cord injury
populations that could contribute to difficulties in learn-
ing to coordinate an assistive device. Based on feedback
from the subjects, manipulating pushbuttons while
attempting to walk required too large of a cognitive effort.
Even the two subjects who could control the orthoses
themselves did not match the performance of the thera-
pist. Both orthoses torque and ankle angle at push-off
were reduced for patient-controlled compared to thera-
pist-controlled conditions (Figure 5, Table 4). These find-
ings suggest that future robotic rehabilitation devices
designed to place the patient in the control loop need to
simplify the controller interface or somehow reduce cog-
nitive demand of the patient.
Conclusion
Robotic assistance at the ankle can improve push-off kin-
ematics in individuals with incomplete spinal cord injury
without large decreases in muscle activation amplitudes.
The therapist-controlled trials suggest that it is feasible for
robotic rehabilitation devices to incorporate observer-
mediated control. It might also be possible to improve the
consistency of the assistance by using automatic triggering
(eg. a footswitch). The patient-controlled trials indicate
that self-operated robotic rehabilitation devices may
require higher-level controllers that allow off-line adjust-
ments over long time scales (i.e. every third step vs. every
single step) and reduce patient cognitive effort. This study
quantifies changes in kinematics and muscle activation
patterns due to powered ankle assistance within a single
test session following a single session of training. Future
studies are needed to track changes over multiple sessions
and assess long-term training effects. As well, studies are
needed to test whether training with robotic assistance at
the ankle can improve functional walking ability in the
incomplete spinal cord population.
Competing interests
The author(s) declare that they have no competing inter-
ests.
Authors' contributions
GSS recruited subjects, managed all data collections, com-
pleted all data analysis and drafted the manuscript. AD
recruited subjects, assisted with data collections and
edited the manuscript. DPF conceived of the study, pro-
vided expert guidance on experimental design, assisted
with data collections and helped edit the manuscript. All
authors read and approved the final manuscript.
Acknowledgements
The authors would like to thank the members of the University of Michigan
Human Neuromechanics Laboratory for help with data collections,
Ammanath Peethambaran, C.O. and Jared Butler, C.O. for help with
orthoses construction, David Gater, M.D. and his staff for help with recruit-
ing subjects, and the subjects for their cooperation and dedication. This
work was supported by Christopher Reeve Paralysis Foundation grant
FAC2-0101 and National Science foundation grant BES-0347479 both to
DP Ferris.
References
1. Dobkin BH: Neurobiology of rehabilitation. Ann N Y Acad Sci
2004, 1038:148-170.
Journal of NeuroEngineering and Rehabilitation 2006, 3:3 />Page 16 of 17
(page number not for citation purposes)
2. Edgerton VR, Tillakaratne NJ, Bigbee AJ, de Leon RD, Roy RR: Plas-
ticity of the spinal neural circuitry after injury. Annual Review
of Neuroscience 2004, 27:145-167.
3. Kaelin-Lang A, Sawaki L, Cohen LG: Role of voluntary drive in
encoding an elementary motor memory. Journal of Neurophys-
iology 2005, 93:1099-1103.
4. Lotze M, Braun C, Birbaumer N, Anders S, Cohen LG: Motor learn-
ing elicited by voluntary drive. Brain 2003, 126:866-872.
5. Perez MA, Lungholt BK, Nyborg K, Nielsen JB: Motor skill training
induces changes in the excitability of the leg cortical area in
healthy humans. Exp Brain Res 2004.
6. Henry FM: Specificity vs. generality in learning motor skill. In
Classical Studies on Physical Activity Edited by: Brown RC and Kenyon
GS. Englewood Cliffs, N.J., Prentice-Hall; 1968:331-340.
7. Edgerton VR, de Leon RD, Tillakaratne N, Recktenwald MR, Hodgson
JA, Roy RR: Use-dependent plasticity in spinal stepping and
standing. Advances in Neurology 1997, 72:233-247.
8. Lovely RG, Gregor RJ, Roy RR, Edgerton VR: Effects of training on
the recovery of full-weight-bearing stepping in the adult spi-
nal cat. Experimental Neurology 1986, 92:421-435.
9. Barbeau H, Rossignol S: Recovery of locomotion after chronic
spinalization in the adult cat. Brain Research 1987, 412:84-95.
10. de Leon RD, Hodgson JA, Roy RR, Edgerton VR: Locomotor
capacity attributable to step training versus spontaneous
recovery after spinalization in adult cats. Journal of Neurophysi-
ology 1998, 79:1329-1340.
11. Behrman AL, Harkema SJ: Locomotor training after human spi-
nal cord injury: a series of case studies. Physical Therapy 2000,
80:688-700.
12. Harkema SJ, Hurley SL, Patel UK, Requejo PS, Dobkin BH, Edgerton
VR: Human lumbosacral spinal cord interprets loading dur-
ing stepping. Journal of Neurophysiology 1997, 77:797-811.
13. Dietz V, Muller R, Colombo G: Locomotor activity in spinal
man: significance of afferent input from joint and load recep-
tors. Brain 2002, 125:2626-2634.
14. Ferris DP, Gordon KE, Beres-Jones JA, Harkema SJ: Muscle activa-
tion during unilateral stepping occurs in the nonstepping
limb of humans with clinically complete spinal cord injury.
Spinal Cord 2004, 42:14-23.
15. Wernig A, Nanassy A, Muller S: Maintenance of locomotor abil-
ities following Laufband (treadmill) therapy in para- and
tetraplegic persons: follow-up studies. Spinal Cord 1998,
36:744-749.
16. Galvez JA, Reinkensmeyer DJ: Robotics for Gait Training After
Spinal Cord Injury. Topics in Spinal Cord Injury Rehabilitation 2005,
11:18-33.
17. Hesse S, Uhlenbrock D, Werner C, Bardeleben A: A mechanized
gait trainer for restoring gait in nonambulatory subjects.
Archives of Physical Medicine and Rehabilitation 2000, 81:1158-1161.
18. Werner C, Von Frankenberg S, Treig T, Konrad M, Hesse S: Tread-
mill training with partial body weight support and an electro-
mechanical gait trainer for restoration of gait in subacute
stroke patients: a randomized crossover study. Stroke 2002,
33:2895-2901.
19. Colombo G, Joerg M, Schreier R, Dietz V: Treadmill training of
paraplegic patients using a robotic orthosis. Journal of Rehabili-
tation Research and Development 2000, 37:693-700.
20. Hornby TG, Zemon DH, Campbell D: Robotic-assisted, body-
weight-supported treadmill training in individuals following
motor incomplete spinal cord injury. Physical Therapy 2005,
85:52-66.
21. Reinkensmeyer D: Robotic gait training: toward more natural
movements and optimal training algorithms. Proceedings of the
26th Annual International Conference of the IEEE EMBS 2004, San Fran-
cisco, CA:.
22. Meinders M, Gitter A, Czerniecki JM: The role of ankle plantar
flexor muscle work during walking. Scandinavian Journal of Reha-
bilitation Medicine 1998, 30:39-46.
23. Kuo AD, Donelan JM, Ruina A: Energetic consequences of walk-
ing like an inverted pendulum: step-to-step transitions. Exer-
cise and Sport Sciences Reviews 2005, 33:88-97.
24. Neptune RR, Kautz SA, Zajac FE: Contributions of the individual
ankle plantar flexors to support, forward progression and
swing initiation during walking. Journal of Biomechanics 2001,
34:1387-1398.
25. Gottschall JS, Kram R: Energy cost and muscular activity
required for propulsion during walking. Journal of Applied Physi-
ology 2003, 94:1766-1772.
26. Donelan JM, Kram R, Kuo AD: Mechanical work for step-to-step
transitions is a major determinant of the metabolic cost of
human walking. Journal of Experimental Biology 2002,
205:3717-3727.
27. Grey MJ, Mazzaro N, Nielsen JB, Sinkjaer T: Ankle extensor prop-
rioceptors contribute to the enhancement of the soleus
EMG during the stance phase of human walking. Can J Physiol
Pharmacol 2004, 82:610-616.
28. Donelan JM, Pearson KG: Contribution of sensory feedback to
ongoing ankle extensor activity during the stance phase of
walking. Canadian Journal of Physiology and Pharmacology 2004,
82:589-598.
29. Capaday C: The special nature of human walking and its neu-
ral control. Trends Neurosci 2002, 25:370-376.
30. Nielsen JB: Sensorimotor integration at spinal level as a basis
for muscle coordination during voluntary movement in
humans. Journal of Applied Physiology 2004, 96:1961-1967.
31. Pepin A, Norman KE, Barbeau H: Treadmill walking in incom-
plete spinal-cord-injured subjects: 1. Adaptation to changes
in speed. Spinal Cord 2003, 41:257-270.
32. Dietz V, Colombo G, Muller R: Single joint perturbation during
gait: neuronal control of movement trajectory. Experimental
Brain Research 2004, 158:308-316.
33. Hidler JM, Wall AE: Alterations in muscle activation patterns
during robotic-assisted walking. Clinical Biomechanics 2005,
20:184-193.
34. Hornby TG, Campbell DD, Zemon DH, Kahn JH: Clinical and
quantitative evaluation of robotic-assissted treadmill walk-
ing to retrain ambulation after spinal cord injury. Topics in Spi-
nal Cord Injury Rehabilitation 2005, 11:1-17.
35. Colombo G, Wirz M, Dietz V: Driven gait orthosis for improve-
ment of locomotor training in paraplegic patients. Spinal Cord
2001, 39:252-255.
36. Sawicki GS, Gordon KE, Ferris DP: Powered lower limb
orthoses: applications in motor adaptation and rehabilita-
tion: ; Chicago, IL. IEEE; 2005.
37. Ferris DP, Sawicki GS, Domingo AR: Powered lower limb
orthoses for gait rehabilitation. Topics in Spinal Cord Injury Reha-
bilitation 2005, 11:34-49.
38. Ferris DP, Czerniecki JM, Hannaford B: An ankle-foot orthosis
powered by artificial pneumatic muscles. Journal of Applied Bio-
mechanics 2005, 21:189-197.
39. Ferris DP, Gordon KE, Sawicki GS, Peethambaran A: An improved
powered ankle-foot orthosis using proportional myoelectric
control. Gait Posture 2005.
40. Gordon KE, Sawicki GS, Ferris DP: Mechanical performance of
artificial pneumatic muscles to power an ankle-foot orthosis.
Journal of Biomechanics 2005.
41. Finni T, Komi PV, Lukkariniemi J: Achilles tendon loading during
walking: application of a novel optic fiber technique. Eur J Appl
Physiol 1998, 77:289-291.
42. Kuster M, Sakurai S, Wood GA: Kinematic and kinetic compari-
son of downhill and level walking. Clin Biomech (Bristol, Avon)
1995, 10:79-84.
43. Eng JJ, Winter DA: Kinetic analysis of the lower limbs during
walking: what information can be gained from a three-
dimensional model? Journal of Biomechanics 1995, 28:753-758.
44. Griffin TM, Tolani NA, Kram R: Walking in simulated reduced
gravity: mechanical energy fluctuations and exchange. Journal
of Applied Physiology 1999, 86:383-390.
45. van Hedel HJ, Tomatis L, Muller R: Modulation of leg muscle
activity and gait kinematics by walking speed and body-
weight unloading. Gait Posture 2005.
46. Sinkjaer T, Andersen JB, Ladouceur M, Christensen LO, Nielsen JB:
Major role for sensory feedback in soleus EMG activity in the
stance phase of walking in man. Journal of Physiology (London)
2000, 523:817-827.
47. Ferris DP, Aagaard P, Simonsen EB, Farley CT, Dyhre-Poulsen P:
Soleus H-reflex gain in humans walking and running under
simulated reduced gravity. Journal of Physiology (London) 2001,
530:167-180.
Journal of NeuroEngineering and Rehabilitation 2006, 3:3 />Page 17 of 17
(page number not for citation purposes)
48. Pierrot-Deseilligny E, Morin C, Bergego C, Tankov N: Pattern of
group I fibre projections from ankle flexor and extensor
muscles in man. Experimental Brain Research 1981, 42:337-350.
49. Meunier S, Pierrot-Deseilligny E, Simonetta-Moreau M: Pattern of
heteronymous recurrent inhibition in the human lower limb.
Exp Brain Res 1994, 102:149-159.
50. Meunier S, Pierrot-Deseilligny E, Simonetta M: Pattern of monosy-
naptic heteronymous Ia connections in the human lower
limb. Exp Brain Res 1993, 96:534-544.