báo cáo hóa học: " Multivariate analysis of the Fugl-Meyer outcome measures assessing the effectiveness of GENTLE/S robot-mediated stroke therapy" potx
Bạn đang xem bản rút gọn của tài liệu. Xem và tải ngay bản đầy đủ của tài liệu tại đây (1.48 MB, 16 trang )
BioMed Central
Page 1 of 16
(page number not for citation purposes)
Journal of NeuroEngineering and
Rehabilitation
Open Access
Methodology
Multivariate analysis of the Fugl-Meyer outcome measures
assessing the effectiveness of GENTLE/S robot-mediated stroke
therapy
Farshid Amirabdollahian*
†1
, Rui Loureiro
†2
, Elizabeth Gradwell
3
,
Christine Collin
4
, William Harwin
†2
and Garth Johnson
†5
Address:
1
Think Lab, The University of Salford, Maxwell Building, Salford, M5 4WT, UK,
2
Department of Cybernetics, University of Reading,
Reading, RG6 6AY, UK,
3
Community Therapy Team Florence Desmond Day Hospital, Royal Surrey County Hospital, Guildford, Surrey, GU2 7XX,
UK,
4
Department of Neurorehabilitation, South Block Annexe, Royal Berkshire Hospital, London Road, Reading, RG1 5AN, UK and
5
Centre for
Rehabilitation and Engineering Studies, School of Mechanical and Systems Engineering, University of Newcastle upon Tyne, Newcastle, NE1 7RU,
UK
Email: Farshid Amirabdollahian* - ; Rui Loureiro - ;
Elizabeth Gradwell - ; Christine Collin - ; William ;
Garth Johnson -
* Corresponding author †Equal contributors
Abstract
Background: Robot-mediated therapies offer entirely new approaches to neurorehabilitation. In this paper we
present the results obtained from trialling the GENTLE/S neurorehabilitation system assessed using the upper
limb section of the Fugl-Meyer (FM) outcome measure.
Methods: We demonstrate the design of our clinical trial and its results analysed using a novel statistical
approach based on a multivariate analytical model. This paper provides the rational for using multivariate models
in robot-mediated clinical trials and draws conclusions from the clinical data gathered during the GENTLE/S study.
Results: The FM outcome measures recorded during the baseline (8 sessions), robot-mediated therapy (9
sessions) and sling-suspension (9 sessions) was analysed using a multiple regression model. The results indicate
positive but modest recovery trends favouring both interventions used in GENTLE/S clinical trial. The modest
recovery shown occurred at a time late after stroke when changes are not clinically anticipated.
Conclusion: This study has applied a new method for analysing clinical data obtained from rehabilitation robotics
studies. While the data obtained during the clinical trial is of multivariate nature, having multipoint and progressive
nature, the multiple regression model used showed great potential for drawing conclusions from this study.
An important conclusion to draw from this paper is that this study has shown that the intervention and control
phase both caused changes over a period of 9 sessions in comparison to the baseline. This might indicate that use
of new challenging and motivational therapies can influence the outcome of therapies at a point when clinical
changes are not expected.
Further work is required to investigate the effects arising from early intervention, longer exposure and intensity
of the therapies. Finally, more function-oriented robot-mediated therapies or sling-suspension therapies are
needed to clarify the effects resulting from each intervention for stroke recovery.
Published: 19 February 2007
Journal of NeuroEngineering and Rehabilitation 2007, 4:4 doi:10.1186/1743-0003-4-4
Received: 21 April 2006
Accepted: 19 February 2007
This article is available from: />© 2007 Amirabdollahian et al; licensee BioMed Central Ltd.
This is an Open Access article distributed under the terms of the Creative Commons Attribution License ( />),
which permits unrestricted use, distribution, and reproduction in any medium, provided the original work is properly cited.
Journal of NeuroEngineering and Rehabilitation 2007, 4:4 />Page 2 of 16
(page number not for citation purposes)
Background
Introduction
The GENTLE/S project was funded by the European
Union under the Quality of Life initiative of Framework
Five to evaluate robot-mediated therapy (RMT) in upper
limb post stroke rehabilitation. Focusing on neuroreha-
bilitation, one of the goals of the GENTLE/S project was to
develop challenging and motivating therapies that would
foster the patient's attention by means of level exercise
interaction and the feeling of 'being in control' of their
therapy session. GENTLE/S therapies are based on 'shap-
ing' therapy, where the user can perform tailor made
'reach to a target' exercises in three dimensional space.
This spatial configuration allows for the training of com-
plex movements (for example, bringing an object close to
the mouth or touching the forehead) mediated through
the assistance of a sensorimotor, computer-based envi-
ronment.
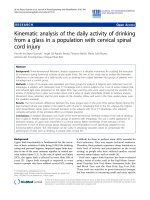
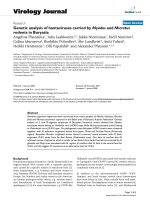
Figure 1 illustrates the GENTLE/S system as used in the
clinical trial while Figure 2 illustrates the precursor com-
mercial incarnation of the system. The system comprises a
3 degree of freedom (DOF) robot manipulator (Haptic-
Master, FCS Robotics, the Netherlands) with an extra
3DOF passive gimbal mechanism, an exercise table, com-
puter screen, overhead frame and chair. The 3DOF passive
gimbal allows for pronation/supination of the elbow as
well as flexion and extension of the wrist. A harness
arrangement was built into the chairs to restrain the user's
trunk movements. This could be used to achieve two
desired effects. The first was to ensure that the patient
would maintain a reasonably upright posture with only a
limited ability to compensate using trunk movements.
The second was that it was then possible to consider the
shoulder as a fixed point and use this information to
determine the pose of the user's arm. Exercise is delivered
by the robot after the user's arm has been placed on an
elbow orthosis suspended from the overhead frame and
on the gimbal using a wrist splint. This arrangement of de-
weighting the paretic arm was in part developed to mini-
mise shoulder subluxation problems and also to compare
with the control phase, sling suspension only. The exer-
cise is executed only when an operation button is pressed
by the user's unaffected arm or by the therapist.
The therapies that were programmed on the HapticMaster
consisted of a series of reaching and withdrawing move-
ments. The empirical minimum jerk approach [1] was
used to pattern the reaching movement as it is simple to
implement in real-time, and has some evidence that it rep-
resents at least the profile of human movements. The
hypothesis suggests that human arm reaching movements
tend to minimise the change of acceleration with respect
to time (jerk) over the movement resulting in graceful and
gentle movements [2]. This is normally expressed as a fifth
or seventh order polynomial in a parametric time 0 <t
<duration although changing the range to -1 <t < 1 simpli-
fies the calculations. Thus equation EQ. 1 was used to
derive the polynomial trajectory of an underlying pre-
ferred movement.
The minimum jerk polynomial requires the therapist to
define a start and end point and the duration of the move-
ment. During the patient setup phase, a graphical user
interface (GUI) is used to fine-tune a therapy session for
each patient. The therapist can insert points in the work-
space by moving the robotic arm to the desired starting
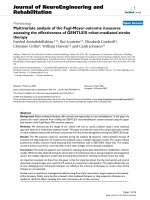
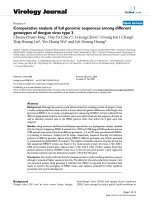
and end points. Figure 3 shows the GUI used for custom-
ising the therapies to each patient. Multiple points could
be inserted for one therapy session. Optionally the thera-
pist can also define a maximum mid point velocity. The
patient's own movement is encouraged to follow this tra-
jectory by programming a variable impedance that is con-
ceptually similar to attaching the patients hand using an
elastic band to a bead placed on a flexible wire-path. This
is termed as bead-pathway concept (Figure 4A). The ther-
apist could also specify the strength of this conceptual
elastic band. Figure 4B depicts the bead-pathway imple-
Jdxdtdt
d
=
∫
33
2
0
1/.EQ
The GENTLE/S system as used in the clinical trialFigure 1
The GENTLE/S system as used in the clinical trial.
The clinical prototype resulting from brainstorming with
patients, clinicians, healthcare professionals and industrial
parties.
Journal of NeuroEngineering and Rehabilitation 2007, 4:4 />Page 3 of 16
(page number not for citation purposes)
mentation using a spring-damper combination and the
trajectory reproduced using the minimum jerk trajectory
model.
There is a selection of virtual environments which can be
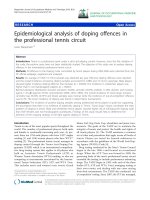
used as patients' workspace. Figure 5 shows some of these
virtual rooms. Using the minimum jerk polynomials, a
number of different therapy exercises were implemented
on the prototype system. These therapies all use the
selected virtual environment. During the therapy, the
location of patient's arm is displayed on the screen using
a pink sphere. Starting and end points of the movement
are displayed using different colours. It is possible to have
a guidance line connecting the starting point to the end
point, providing a straight-line ruler for each task (Figure
6). Different therapeutic modes are implemented as
described below.
Patient Passive
The Patient Passive mode was the first therapy imple-
mented and was intended for patients who have insuffi-
cient arm strength or neural connectivity to move. This is
similar to therapies provided by existing machines and
would simply stimulate sensory neurons. The primary dif-
ference is the virtual environment that is displayed where
the patient is encouraged to observe the planned move-
ment and think about how to make the movements. The
HapticMaster moved the arm to follow the predefined
path with the elastic band strength programmed by the
therapist. When the patient's arm reaches the target, the
movement would pause momentarily and then proceed
to the next target point.
Patient Active Assisted
For more capable patients the HapticMaster was pro-
grammed so that it would only start to move if the patient
initiated a movement by providing a nominal force in the
correct direction. This was done by comparing the force
vectors recorded at the end-effector, to the position vector
constituting the desired direction of the movement. A
threshold value could be set during the setup phase to
tune the sensitivity for movement initiation. After the ini-
tiation was made, the haptic interface assisted the user to
reach to the end point again using bead-pathway concept.
Patient Active
The third mode is the ratchet mode or the Patient Active
mode. The user has an unlimited time to finish the task.
This mode provides a unidirectional movement, where
the amount of deviation can be controlled by changing
spring-damper coefficients. Similar to the previous mode,
the user initiates the right movement. The haptic interface
stays passive until the user deviates from the predefined
path. In this case, the spring-damper combination encour-
ages the patient to return to the pathway. During this
The GUI used by the therapist in order to setup each exer-ciseFigure 3
The GUI used by the therapist in order to setup each
exercise. The GUI allows for easy setup of an exercise while
moving the robot/patient arm to different positions in the
workspace. Different points can be inserted or deleted and
different levels of assistance can be chosen for each exercise.
Precursor commercial incarnation of GENTLE/SFigure 2
Precursor commercial incarnation of GENTLE/S.
This figure depicts the controls for wheelchair docking, and
controlling the arm support forces on the left. Patient con-
trols are seen under the subject's left hand and a therapy can
be chosen or halted and will only proceed if the 'operate'
button is held down. The patient can 'eject' their arm from
the HapticMaster.
Journal of NeuroEngineering and Rehabilitation 2007, 4:4 />Page 4 of 16
(page number not for citation purposes)
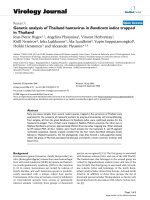
The three difference virtual environments used for the trialFigure 5
The three difference virtual environments used for the trial. A. Empty room – A simple environment that represents
the haptic interface workspace and aims to provide early post-stroke subjects with awareness of physical space and movement.
B. Real room – An environment that resembles what the patient sees on the table in the real world. The mat with 4 different
shapes on the table (as seen in Figure 1) is represented in the 3D graphical environment. This environment was developed to
help discriminating the third dimension that is represented on the Monitor 2D screen. C. Detail room – A high detail 3D envi-
ronment of a room comprising of a table, several objects (a book, can of soft drink), portrait of a baby, window, curtains, etc.
The variable impedance conceptFigure 4
The variable impedance concept. A. The real life example of the bead-pathway concept. B. The bead-pathway concept
implemented using spring-damper combination and pathway model using higher order polynomials.
Journal of NeuroEngineering and Rehabilitation 2007, 4:4 />Page 5 of 16
(page number not for citation purposes)
mode, the robot only assists the patient to correct devia-
tions from the planned trajectory and the patient is solely
responsible to reach from the start point to the end point
defined. This operation will end on reaching the end
point or releasing the operation button. Upon arrival at
the end point, it is up to the user to continue the same
movement back to the start point, a new point or end the
whole session in this mode.
Trajectory Fork
The trajectory fork was intended to augment other thera-
pies and increase involvement in the activity by allowing
the user to decide which movement to make. Before initi-
ating a movement the user was presented with a set of
alternate reaching goals and based on the initial forces
exerted by the user on the HapticMaster, one of these
goals would be selected and the trajectory calculated and
initiated. From a clinical point of view, apart from provid-
ing the stroke patient with repetitive challenge therapies,
the ability to choose was seen to increase the motivation
and challenge of the therapy. It is notable that this mode
was not used during the clinical trial and was only availa-
ble on the precursor commercial model.
Motivational Considerations
Various other methods were considered to increase the
user's motivation and attention as these were seen as
essential elements in the therapy to allow the brain to re-
organise and adapt. The therapies were arranged to occur
in a highly realistic 3D virtual environment and three
were demonstrated in the precursor commercial proto-
type. These were, a simple room with a table, a set of
supermarket shelves to allow reaching and selection of
items from a shelf, and a home environment where items
such as bottles could be selected. This was intended to be
a staging point that would allow the user to eventually
practice the actions needed to pour a drink. An additional
activity was navigating through a simple maze game.
Because the clinical trial was already in progress at the
time when these considerations were made, none of the
above rooms were present during the clinical trial. Other
situations were also considered such as exploring a virtual
museum and other games like activities.
The concept of giving performance cues following a ther-
apy was considered but it was not possible to detail a suf-
ficiently robust measure that could be used to score the
success or otherwise of the movements.
Objectives
The objective of the GENTLE/S study was to assess the
effectiveness of the Robot-mediated therapies (RMT)
compared to sling suspension (SS) therapies using a series
of 31 single case studies conducted in two separate cen-
tres. This paper presents a new approach in analysing mul-
tivariate data obtained in clinical trial of the robotic
system. This rational for using this new approach is the
multivariate and progressive nature of the data and the
complexity induced by the ABC-ACB clinical design. The
next section describes the clinical trial and study design as
used for the GENTLE/S project.
Clinical Trial
The GENTLE/S clinical trial consisted of a series of 31 sin-
gle case studies, using a randomised ABC-ACB design
(ABC and ACB – explained further in the text). The centres
involved in this trial were the Battle Hospital, Reading,
United Kingdom and the Adelaide & Meath Hospital,
Dublin, Republic of Ireland. Subjects at each centre were
randomised into either ABC or ACB groups. Inpatient and
outpatient participants were recruited by referral from
their consultant. They were sought to be medically stable
in order to cope with the duration of the trial. Participants
were all following their first stroke and over 60 years of
age with ability to give informed consent. In addition,
they had to achieve a score higher than 24 in the Short
Orientation Memory Concentration (SOMC) assessment.
Participants with pacemakers were excluded from this
study. The recruited patients attended three times per
week for a period of nine weeks. They completed a base-
line measurement phase (A, 8 measurements). It was in
place to identify the current recovery status or baseline
An exercise setting during executionFigure 6
An exercise setting during execution. Subject's arm
position is presented using the pink sphere. The start and
end point of the trajectory are presented by the blue and yel-
low spheres. The start and end points are connected using a
line providing guidance for execution. In addition to the table
mat, the threads hanging from each sphere (termed as bal-
loons threads) and the shadows are used to provide a better
depth perception.
Journal of NeuroEngineering and Rehabilitation 2007, 4:4 />Page 6 of 16
(page number not for citation purposes)
(BL). During this phase, no therapeutic intervention was
provided. This was followed by a period of RMT (B, 9
measurements) and de-weighted sling suspension (C, 9
measurements). The order in which the B or C phase fol-
lowed the baseline was decided based on subjects' ran-
domisation into the A-B-C or A-C-B groups. Hence, the
only difference between the two groups were the order in
which the B or C phase were delivered. Since there is a sug-
gested dose response to intervention [3], this design in the
study permitted to control for the dose effects by allowing
the comparison between different phases of the trial [4].
The demographic data of the subjects including gender,
stroke paretic side, age and number of months post stroke
are given in Table 1.
At the start of each trial session, for all three phases, sub-
jects were assessed using validated outcome measures.
These measures included the upper limb section of the
Fugl-Meyer (FM), Motor Assessment Scale (MAS) and the
active and passive goniometry for elbow and shoulder
(G). Table 2 shows the randomisation used for the trial
and the order of phase appearance based on this randomi-
sation.
During the B phase, the subject received individually tai-
lored robot-mediated therapy (RMT) using the GENTLE/S
system. Three 10-minute sessions were conducted using
one of the three therapy modes available (patient passive,
patient active-assisted and patient active as mentioned
earlier). Based on the patient's stroke severity and the type
of support required, one of the above modes was chosen
for each 10-minute session.
During the C phase, the subject's paretic arm was sus-
pended from a frame eliminating gravity using sling sus-
pension (SS) techniques. The subject was asked to use the
de-weighted arm to perform different activities. Similar to
the B phase, three 10-minute sessions were carried out
during this phase. For the first section, the combined
movement involving shoulder and elbow flexion and
extension was exercised while patients lay on their side.
The second 10-minute session required activities involv-
ing shoulder flexion and extension only, while the third
10-minute part involved elbow flexion and extension.
The Fugl-Meyer outcome measure
The Fugl-Meyer (FM) scale is an impairment-based scale
used to assess the motor deficits in neurological patients,
mainly stroke survivors. It includes items of upper and
lower-limb sensation and motor control. Listed items in
this scale are scored between 0, 1, and 2 where a score of
2 denotes the ability to respond correctly to a listed item
[5]. The scale consists of 62 items. Hence, the maximum
score for the FM is 124 if the complete response given to
all items is summed. This scale has previously been tested
and shown to be both valid and reliable [6,7].
This scale is one of the most widely used instruments in
clinical assessment [8]. Usually, the overall outcome of
the instrument is calculated by summing the response
given to each item or subscale, which can then be used in
analytical models including statistical analysis [some
examples in rehabilitation robotic literature include: [9-
12]].
One of the outcome measures used at the start of each ses-
sion is the upper-limb section of this assessment. The
GENTLE/S study concentrated only on treatment of the
upper limb, thus only the upper-limb section of the FM
(33 subscales) was chosen for this clinical study. The
scores given to each subscale were summed to calculate
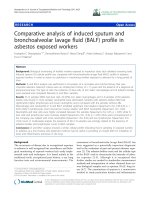
the total score obtained in one session. Figure 7 presents
the sums obtained during the clinical trial for one of the
subjects at Battle Hospital, Reading. Linear regression was
used to calculate the slope for each phase of the trial and
the figure depicts these slopes. It can be seen that better
recovery is achieved during the B phase where the slope is
steeper. A MATLAB routine was used to calculate and
automatically produce these figures at the end of each
subject's trial period. However, due to the complex nature
of the study design, in order to summarise the results sta-
tistically, a more advanced multiple regression model was
used. The following sections will describe this model and
analyse the results obtained from the clinical study.
Table 1: Subject demographics for the GENTLE/S study
Male Female Left Hemi Right Hemi Age Post stroke
Reading (n = 11) ABC Group (n = 6) 4 2 4 2 67 ± 6 19 ± 14.3
ACB Group (n = 5) 4 1 3 2 67 ± 6 37.2 ± 19.5
Subtotal 8 3 7 4 67 ± 6 27.2 ± 18.5
Dublin (n = 20) ABC Group (n = 10) 3 7 5 5 66 ± 8 16 ± 9.4
ACB Group (n = 10) 6 4 4 6 70 ± 11 25.6 ± 25
Subtotal 9 11 9 11 68 ± 9 20.7 ± 19
Total 17 14 16 15 Years (Mean ± SD) Months (Mean ± SD)
Journal of NeuroEngineering and Rehabilitation 2007, 4:4 />Page 7 of 16
(page number not for citation purposes)
Methods
Initial Analysis
As a first approach, the FM results were visually inspected
using boxplots and case summaries. Figure 8 presents the
boxplot comparing the results between the two centres
involved. It depicts the differences observed between the
two centres involved using the FM measure.
The boxplots shown in Figure 9 and Figure 10 illustrates
the results obtained from comparing the three phases of
the trial for subjects in ABC and ACB groups. The main
objective was to identify any existing trend or any signifi-
cant outlier in the data before proceeding with more thor-
ough examination. In addition, these two figures show a
general improvement trend when BL data is compared to
the RMT or SS points. It is also noticeable that the SS
results are generally better than the RMT results as
depicted by their medians. On the other hand, RMT seems
to have caused greater deviation in the scores measured
(i.e compare subject 6 RMT phase to his/her SS phase)
A multiple regression model
The next step was to use a general linear model (GLM) to
identify different parameters contributing to the variance
seen in the recorded trends. The GLM is an advanced form
of ANOVA allowing analysis of multiple levels of unbal-
anced data. This was chosen because during clinical stud-
ies, it was not always possible to obtain a balanced design
as subjects may have missed a therapy session due to ill
health or other causes. The GLM used 'centre', 'grouping',
'subject', and 'session' as its model parameters. The results
showed strong and statistically significant effects for all
these parameters indicating the difference between differ-
ent centres, different groupings (ABC and ACB), and
inherent differences between different subjects. It also
showed that the performance between different sessions
had been diverse demonstrating a positive or negative
trend or change during the trial. Knowing such differ-
Results Comparison between the two centresFigure 8
Results Comparison between the two centres. The
differences in sumFM score is observed between the two
centres involved.
Table 2: Two randomised groups for the clinical trial
Weeks 1 2 3 4 56789
ABC Group Baseline (Phase A) Robot-Mediated Therapy (Phase B) Sling Suspension (Phase C)
Sessions 1 2 3 4 5 6 7 8 9 10 11 12 13 14 15 16 17 18 19 20 21 22 23 24 25 26 27
ACB Group Baseline (Phase A) Sling Suspension (Phase C) Robot-mediated Therapy (Phase B)
Comparison between slopes of the regression line for differ-ent phases of the trial, one typical subjectFigure 7
Comparison between slopes of the regression line for
different phases of the trial, one typical subject. The
sumFM scores from each phase is accompanied by a regres-
sion line calculated using the least square method.
Journal of NeuroEngineering and Rehabilitation 2007, 4:4 />Page 8 of 16
(page number not for citation purposes)
ences, it could be possible to continue the analysis in each
centre and group separately but this would have resulted
in reducing the number of data points and hence, losing
statistical power. A better and more advanced model was
needed to analyse the data without breaking it into frag-
ments.
Noting that one of the objectives of the study was to com-
pare subjects' progress during the different phases of the
trial, a multiple regression model was reasonable. Figure
7 illustrates how this approach might work with a straight
line being fitted to each of the trial phases. Using the least
squares linear regression method provides the slope and
intercept as well as fit statistics for each subject. Moreover,
it is possible to devise a similar technique to analyse the
total trend for all subjects by considering more independ-
ent parameters (such as centre, grouping and subjects) in
this formulation.
Multiple regression is a common way to assess co-varia-
tions between and among different variables [13]. It can
be used to consider multiple independent variables when
The ABC group during the three phases of the trialFigure 9
The ABC group during the three phases of the trial. Comparison between the three phases of the trial for the partici-
pants in the ABC group.
Journal of NeuroEngineering and Rehabilitation 2007, 4:4 />Page 9 of 16
(page number not for citation purposes)
The ACB group during the three phases of the trialFigure 10
The ACB group during the three phases of the trial. Comparison between the three phases of the trial for the partici-
pants in the ACB group.
Table 3: Multiple Regression Model Summary
Model R R Square Adjusted R
Square
Std. Error of
the Estimate
Change Statistics
R Square
Change
F Change df1 df2 Sig. F
Change
1 .988 .975 .974 2.660 .975 898.792 33 754 .000
Journal of NeuroEngineering and Rehabilitation 2007, 4:4 />Page 10 of 16
(page number not for citation purposes)
Table 5: Multiple Regression Model Summary for the Random 60% of the Data
Model R R Square Adjusted R Square Std. Error of the Estimate Change Statistics
R Square Change F Change df1 df2 Sig. F Change
2 . 987 .975 .973 2.694 .975 511.097 33 435 .000
Table 4: Multiple Regression, model Coefficients
Model Unstandardized Coefficients Standardized Coefficients t Sig. 95% Confidence Interval for B
1 B Std. Error Beta Lower Bound Upper Bound
(Constant) .932 .644 1.449 .148 331 2.196
Baseline .114 .053 .021 2.144 .032 .010 .219
RMT .207 .018 .117 11.635 .000 .172 .241
SS .324 .017 .187 18.639 .000 .290 .358
Subject1 43.230 .763 .467 56.684 .000 41.733 44.728
Subject2 8.634 .762 .093 11.337 .000 7.139 10.129
Subject3 23.461 .763 .254 30.762 .000 21.964 24.958
Subject5 13.000 .763 .141 17.045 .000 11.502 14.497
Subject6 15.350 .769 .163 19.966 .000 13.841 16.860
Subject7 17.353 .770 .184 22.536 .000 15.841 18.864
Subject8 8.057 .762 .087 10.579 .000 6.562 9.552
Subject9 50.038 .763 .541 65.610 .000 48.541 51.535
Subject10 4.065 .769 .043 5.288 .000 2.556 5.574
Subject11 13.230 .763 .143 17.348 .000 11.733 14.728
Subject12 32.976 .765 .356 43.102 .000 31.474 34.478
Subject13 55.632 .785 .567 70.854 .000 54.091 57.173
Subject14 44.788 .762 .484 58.807 .000 43.293 46.283
Subject15 42.805 .771 .454 55.535 .000 41.292 44.318
Subject16 31.526 .763 .341 41.297 .000 30.027 33.025
Subject17 47.738 .762 .516 62.622 .000 46.241 49.234
Subject18 53.976 .765 .583 70.551 .000 52.474 55.478
Subject19 33.956 .764 .367 44.449 .000 32.457 35.456
Subject20 19.884 .763 .215 26.072 .000 18.387 21.381
Subject21 .584 .762 .006 .766 .444 913 2.080
Subject22 14.149 .764 .153 18.521 .000 12.649 15.648
Subject23 20.257 .763 .219 26.535 .000 18.758 21.756
Subject24 31.431 .772 .333 40.706 .000 29.915 32.947
Subject25 41.314 .794 .412 52.011 .000 39.755 42.874
Subject26 37.078 .769 .393 48.233 .000 35.569 38.587
Subject27 20.449 .763 .221 26.787 .000 18.951 21.948
Subject28 23.807 .763 .257 31.216 .000 22.310 25.305
Subject29 14.610 .780 .152 18.740 .000 13.079 16.140
Subject30 .168 .765 .002 .220 .826 -1.334 1.670
Subject31 26.596 .762 .287 34.920 .000 25.101 28.091
Journal of NeuroEngineering and Rehabilitation 2007, 4:4 />Page 11 of 16
(page number not for citation purposes)
calculating the least square estimates for a complex data
set. Using a multiple regression analysis, we can devise
our model using the EQ. 2:
where b
c
represents the coefficient for the centre parame-
ter. As there were only two centres involved in this study,
only one binary variable is needed in the model. The BL,
RMT and SS slopes represented by a b variable subscripted
with the correct label, considers the slope for each phase
of the trial accompanied by the sessions attended in each
phase. Subjects form completely independent categories
and pose independent effects on this model. To represent
this variable with more than two categories, dummy cod-
ing or indicator coding is required. Dummy coding is a
way of including nominal or ordinal variables in a regres-
sion equation. Each independent category except one is
added as a dichotomy. The omitted variable provides a
baseline for comparison while avoiding multicollinearity.
Each subject is represented by an independent subject var-
iable and its slope represented by bs
i
with a subscript indi-
cating the variable index. Only one subject is excluded
from this coding and hence is the range of the subscript (n
- 1). The penultimate coefficient, c, is the intercept for the
regression line and e presents the modelling error.
The SPSS statistical package was used to analyse the fitness
of the above model. The variable calculated for the sum of
Fugl-Meyer (sumFM) outcome in each session was used as
the dependent variable. For the independent variables,
additional preparation was needed. To analyse this model
using SPSS, data was stored in the form of rows represent-
ing every measurement session for each subject (8 BL
measures, 9 RMT measures, 9 SS measures) and columns
representing each variable in the above model. As an
example, the S
2
variable, which represents the second sub-
ject in this regression model, is represented by one col-
umn in the datasheet. It is set to 1 for all rows relating to
this subject and 0 for all other rows that represent other
subjects. Other subjects were also inserted using a similar
approach. This technique allows for establishing subject
independence in the model. Subject's data is represented
by a value of one in S
2
column while other subjects have
no effect on this variable due to having zero values. It is
notable that this technique allows for reducing one of the
variables because a column with all zero values can repre-
sent one of the subjects as a baseline subject. Hence the
number of dummy variables is usually one less than the
number of categorical variables. SPSS is capable of detect-
ing multicollinearity and excluding those variables caus-
ing multicollinearity. A more in-depth explanation on
using and creating these variables is given in 'regression
with dummy variables' [14].
One objective of this model was to compare the effective-
ness of our control (SS) to our intervention (RMT) and to
the baseline (BL) phase. The BL, RMT and SS columns
show the session numbers as a sequential number
assigned to each session. The BL column was filled with
session (ordinal) numbers (values ranging from 1 to 8)
during this phase. The rest of cases for this column were
equal to zero indicating that no two phases happened
simultaneously. The RMT and SS variables were inserted
similarly. A question arises regarding grouping effects and
whether there would be any effect arising from differences
between the ABC and ACB, that are to be considered in
this model. Having a separate phase indicator (BL, RMT
and SS) will take into account the grouping effects; recall-
ing from Table 2, the BL, RMT and SS have their sessions
numbered sequentially so that, if the RMT is presented
before SS, or after it, it will have session numbers varying
between 10–18, or 19–27 consequently. This will auto-
matically include the grouping parameter into the model.
The multiple regression model was then executed to iden-
tify the coefficients and their statistical significance. The
next two sections further explain the multiple regression
parameter method used and the cross-validation proce-
dure employed. The reader with less statistical interest can
continue with the 'Analysis of the Results'.
Parameters 'forced entry'
The multiple regression model designed and imple-
mented with the previous parameters was entered into the
SPSS linear regression analysis. The 'Enter' method was
used which forces the model to consider all variables as
significant variables in the model (see Table 3). In addi-
tion, Table 4 shows the coefficients calculated for each
variable entered into the model.
Note that subject 4 was selected as the baseline subject.
The selection of this subject was mainly due to presence of
minute variations in the subject score during all phases of
the trial. As this study sought to investigate progress, com-
paring other subjects to this subject would provide a rea-
sonable base of comparison while avoiding
multicollinearity and inclusion of unnecessary variables.
Cross-validation of the model
The linear regression model in Equation 1 assumes errors
have a normal distribution. Thus after fitting, the residual
errors can be compared to a normal distribution as an aid
towards cross-validation using SPSS. Histograms of the
residuals and the normal probability plots were produced
for the standardised residuals. These suggested that the
assumption of the error distribution is reasonable.
The next step was to investigate the statistical power. The
method used by Dunlap et al. was used to calculate the
statistical power [15]. For the alpha-level (0.05) and the
y b centre b BL b RMT b SS bs Subject c e
cBLRMTSS ii
i
n
=++ ++ ++
=
−
∑
1
1
EEQ .2
Journal of NeuroEngineering and Rehabilitation 2007, 4:4 />Page 12 of 16
(page number not for citation purposes)
sample size used (n = 788), the program used the popula-
tion correlation coefficient obtained from the model sum-
mary table to calculate the statistical power (p = 1.0). This
was in agreement with the power value suggested by the
G*Power program developed and presented by Erdfelder
et al. [16].
Another validation method used was data splitting. Using
SPSS, 60% of the data was randomly selected to estimate
coefficients for a new model. Table 5 presents the model
summary produced for this regression:
The final step was to cross-validate the adjusted R
2
using
Stein's formula as seen in EQ.3 [See [17], page 118]:
Where n is the total number of cases, k is the number of
predictors and R
2
is the unadjusted value obtained from
the model summary. This resulted in the value of 0.972,
which is very close to the value calculated by SPSS and
presented in Table 3.
Analysis of the results
Table 3 and Table 4 show the results as calculated for the
statistical model. The multiple R is a gauge of how well the
model predicts the observed value and is presented by the
R column in the summary table (Table 3). A value of 1
indicates a situation where the model perfectly predicts its
observed values. The value of 0.988 given in this table
presents this model as a good predictor of the observed
values. The R
2
value shows the amount of variation in the
outcome, which is accounted for by the model. The value
of 0.975 indicates that 97.5% of the variation seen in the
outcome is accounted for by the model. The next impor-
tant output in this table is the adjusted R
2
. It gives some
idea of how well this model generalises. Ideally this
should be close to the observed R
2
. These results show
good agreement between these two values. The adjusted
R
2
value cross-validated using the Stein's formula is 0.972,
which is in agreement with both values mentioned previ-
ously. The next column presents the standard error of the
estimated values. A small standard error indicates that
most sample means from the estimated values are similar
to the population mean and so the estimated values are
likely to be an accurate presentation of the population.
The next important section of the results is the F-Change
statistics. The F-ratio is a measure of how much a model
has improved the prediction of the outcome compared to
the level of inaccuracy of the model [18]. For these data, F
is 898.792, which is significant at p < 0.001. This model
causes R
2
to change from zero to 0.975 and this change in
the amount of variance explained gives rise to an F-ratio
of 898.792. This change in F-ratio indicates improvement
in prediction due to the model and the statistically signif-
icant p-value indicates that there is less than 0.1% chance
that an F-ratio of this size would occur by chance alone. It
can be concluded that the regression model results in a
significantly better prediction than if we used mean values
of scored FM results for each trial session and each subject.
In other words, the regression model is a better choice for
tracking progression in subjects' scores compared with the
calculated mean values.
Having established the model using its summary table,
Table 4 presents the model coefficients. These are the
parameters calculated for the equation 1. These values
indicate the individual contribution of each predictor in
the model. Replacing b-values given by B column in this
table will provide the regression equation for the GEN-
TLE/S results. Our main objective in this study was to
compare the effects caused by the RMT to those observed
from the SS phase of the trial. These results are found in
the two highlighted (bold typeface) rows of Table 4. The
b-value calculated for the RMT phase is 0.207 indicating
that for the RMT session, the FM score changes by 0.207
units. The b-values calculated for the SS phase is 0.324,
indicating that better improvements in the FM score can
be attributed to this exercise. As there were nine sessions
in each phase of the trial, from these results we can con-
clude that the SS phase has advanced the FM scores by
1.053 (9 × (0.324 - 0.207)) over RMT. This indicates a
modest and small change in the FM score due to the SS
AdjustedR
n
nk
n
nk
n
n
2
1
1
1
2
2
1
1=−
−
−−
⎛
⎝
⎜
⎞
⎠
⎟
−
−−
⎛
⎝
⎜
⎞
⎠
⎟
+
⎛
⎝
⎜
⎞
⎠
⎟
⎡
⎣
⎢
⎤
⎦
⎥
−−
()
R
2
3EQ .
Comparison between progress during each phase of the trialFigure 11
Comparison between progress during each phase of
the trial. The slopes calculated by the statistical models is
plotted to compare between different phases of the trial.
Arbitrary session numbers is used to allow for this compari-
son.
Journal of NeuroEngineering and Rehabilitation 2007, 4:4 />Page 13 of 16
(page number not for citation purposes)
phase compared to the RMT phase. The standard error
associated with each b-value indicates the extent that
these values would vary across different samples of the
population.
Another important section of this table is the t-statistics.
The t-test indicates whether each b-value differs signifi-
cantly from zero, in other words, whether each predictor
is making a significant contribution to the model. Both
coefficients (RMT and SS) show significant p-values for
this test indicating their contribution to the model with
statistical significance. The larger the value of t, the greater
is the contribution to the model. This also shows that the
SS improves the sumFM score more than the RMT,
although the extent of this contribution is modest [19].
Another important observation is exclusion of the centre
parameter. SPSS application is able to exclude un-neces-
sary variables to avoid multicollinearity. Table 4 does not
present this variable and detailed output from the model
(not presented here) shows that centre variable was par-
tially correlated with other parameters involved in the
model (subject variable), thus failing the multicollinearity
test.
A final statement from these results can be drawn from the
standardised Beta, which shows the number of standard
deviations that the outcome will change as a result of one
standard deviation change in each predictor. In scenarios
where indicators have different standard deviations and
different units, the b-values using the unit change in the
score due to unit change in the indicator do not provide a
good basis for comparison while the standardised Beta is
formulated in terms of unit change of standard deviation
and provides a better ground for comparison. The stand-
ard deviations calculated for the RMT and SS phase indi-
cators are 9.363 and 9.574 respectively. The standard
deviation for the FM score is 16.536. The RMT Beta indi-
cates that 9.363 change in the RMT would result in 1.93
(16.536 × 0.117) change in the FM score. The SS Beta col-
umn indicates that 9.574 change in the SS would result in
3.09 (16.536 × 0.187) change in the FM score. Hence,
based on the standardised Beta values, the SS phase causes
the FM score to change 1.16 unit more compared to the
RMT phase. This is similar to the results calculated from b-
values because the RMT and SS indicators have similar
and close standard deviations in our case.
Based on the standardised Beta values, Figure 11 presents
a comparison plot evaluating the difference between the
baseline, RMT and SS phases.
Discussion
The highly multivariate nature of clinical trials of rehabil-
itation accompanied by a recovery trend for individual
subjects calls for the use of advanced analytical
approaches. It is important to mention that different sta-
tistical models can be used to analyse a selected dataset
and our choice in this paper is only examining one possi-
ble model for this analysis. In this paper, we have used a
multivariate model to draw inference on the data from a
small study (n = 31). The technique has shown great
potential in analysing multipoint multi-variable progres-
sive clinical data and should be used more widely, but
care is needed to ensure that the model is not overfitted.
The cross validation effort presented here is an important
part of the procedure made to ensure a best fit for multi-
variate models.
The presented model is capable of summarising data at
different levels, i.e. centre, phase and subject and of iden-
tifying the influential factors that affect the recovery trend
in a group of subjects undergoing clinical trial. It also pro-
vides the potential to forecast the outcome of individual
subjects in a near future, providing a chance for active
feedback during therapy period. Using this model and the
coefficients calculated, one can see that longer exposure to
both interventions could influence the recovery more.
However, an extension of this research can investigate the
dose-response and response to intensity of RMT or SS
compared to the GENTLE/S trial.
The model used provided a first insight to the results
obtained from trialling the GENTLE/S robotic system. It
provided a chance to compare different indicators used in
the model in terms of their contributions to the total var-
iance seen in the data. In spite of differences between the
two centres involved, the model showed that variations
were caused mainly by different subjects attending the
trial and the phasing of the trial. The centre indicator was
eliminated due to its colinearity with other parameters in
the model. However, it is notable that the issue of inter/
intra rater reliability was not sought during the trial and
also that the therapists involved in each centre were aware
of the objectives of the study as well as subjects' randomi-
sation. Noting these, the model still provided a chance to
summarise the data by empowering individual subjects as
different independent variables. It is noteworthy that this
paper only presented the results obtained from analysing
the FM outcome measures and further publications aim to
investigate the remaining outcomes as collected during
the GENTLE/s clinical trial.
The main objective of this study was to compare between
the RMT phase of the trial relative to the other two phases.
Both phases showed improvement relative to the BL
phase as can be seen in Figure 11. It is important to recall
that subjects involved in this study only received 30 min-
utes of each intervention for each session. However, the
changes shown are statistically significant many months
after stroke providing evidence for recovery when no clin-
Journal of NeuroEngineering and Rehabilitation 2007, 4:4 />Page 14 of 16
(page number not for citation purposes)
ical changes are anticipated. Although statistics showed
that the RMT phase was slightly less effective than the SS
phase, the extent of this difference is clinically disregarded
(within the given time period). On the contrary, it is nota-
ble that accepted clinical measures may not have the sen-
sitivity required for this comparison while robotics and
advanced instrumentation techniques have the potential
to provide quantitative scores of arm function. A study of
the joint angle versus torque plots presented by Mak et al.
showed that it is possible to identify the direction of
energy flow between human and robot. This could inform
the recovery process if one is measuring subject's contri-
bution to an assisted task [20].
It is worth mentioning that both RMT and SS phases
helped the arm against gravity by de-weighting it. It is pos-
sible to argue that perhaps similar results between the two
phases could be entirely due to using similar suspension
systems. Recent research by Sukal et al. has investigated
the abnormal torque patterns in hemiparetic limbs and its
response to supported and unsupported movements.
They have shown that supported movement have the
potential to influence paretic arm's reaching envelope.
Their research has also shown the potential of robotic and
anti-gravity supports in quantifying muscle coordination
after stroke [21]. The results shown by this paper regard-
ing the SS intervention also showed that by de-weighting
the arm against gravity and practicing different groups of
arm movements, subjects involved in this clinical trial
showed better results compared to the intervention tested
and also compared to the baseline phase where no ther-
apy was administered. This was achieved in spite of only
30 minutes of suspension therapies. It can be suggested
that future research can use de-weighting in conjunction
with longer and more intense therapy, performance feed-
back and a motivating therapeutic context in order to
investigate the usefulness of arm suspension more thor-
oughly. This can have further use for home-based rehabil-
itation systems where subjects are allowed to use a system
within their own private home.
The results draws conclusion from a total of 4.5 hours
RMT interventions per subject and a small number of sub-
jects. This is not comparable to other clinical studies, ie
drug trials. Larger number of subjects and longer exposure
to both therapies, in addition to higher resolution assess-
ment techniques are seen as important factors required for
comparison between the control and intervention phases.
A point to consider in future studies is the lack of balance
between different groups within each centre and between
the two centres. A more balanced design in addition to
double-blinding procedure allows for more accurate con-
clusions. Insertion of a baseline phase after each interven-
tion, ie ABACA-ACABA study design can also enable the
researchers to investigate the direct effects caused by an
intervention, ie C phase in ABC, without need to worry
about carry over effects caused by interjecting B before C.
During the trial, it was observed that each subject's ther-
apy was changed over time and did not provide a com-
mon exercise, which could be compared to previous
attempts. To use more accurate measures such as power
flow in clinical trials, it is necessary to have both repeata-
ble and varying elements present during a therapy session.
The repeatable exercises would allow identifying the
changes observed while varying components in each exer-
cise would make the therapy more exciting.
All GENTLE/S therapies were targeting the arm movement
but disregarded grasping. However, the main objective of
many arm movements is to grasp and manipulate the
environment. It can be argued that absence of grasping
made the therapies less exciting and less realistic resulting
in less improvement than expected. In addition, interac-
tive content leading to making decisions are usually
present in daily living activities. Future research should
focus on more directed reaching, grasping and decision
making to make the interaction more realistic.
Conclusion
One of the objectives of the GENTLE/S study was to inves-
tigate the effects arising from the RMT in comparing it to
the SS and the BL phase. The methodology used here
shows competence in facilitating this comparison. This
paper showed that multiple regression can be used to
investigate the differences between diverse variables more
thoroughly. Although the results presented in this paper
show small differences between these RMT and SS phases,
subject's exposure to these phases was not long and the
therapy sessions were not intense, happening only 3 times
a week, and were well beyond the normal period when
recovery is normally expected. It is important to mention
that some patients did not achieve a stable baseline during
this phase. Ideally, these observations are continued until
a stable baseline is achieved. However, due to timelines
imposed by the funded study, continuing the baseline
phase was not possible. Further studies should consider
more flexible timelines to allow for such observations.
The methodology used here has showed differences
between the two interventions involved, RMT and SS, to
the level of one point on the FM scale, while the FM scale
itself lacks the resolution for this type of comparisons. It
can be suggested that the methodology itself is capable of
detecting small changes in similar studies. Future studies
can benefit from biomechanical measures that offer better
resolution in conjunction with the clinical outcomes.
This study has applied a new method for analysing clinical
data obtained from rehabilitation robotics studies. While
Journal of NeuroEngineering and Rehabilitation 2007, 4:4 />Page 15 of 16
(page number not for citation purposes)
the data obtained during the clinical trial is of multivariate
nature, having multipoint and progressive nature, the
multiple regression model used showed great potential
for drawing conclusions from this study. This approach
allows for investigating the effect of different indicators'
contribution into total score variations. These indicators
included phase, centre and subject. The results showed
that the variations in both centres involved are insignifi-
cant in comparison to the effects caused by the SS or RMT
interventions as well as inherent differences existing
between different subjects.
A final conclusion to draw from this paper is that this
study has shown that RMT and SS both caused changes
over a period of 9 sessions in comparison to the baseline.
This might indicate that use of new challenging and moti-
vational therapies can influence the outcome of therapies
at a point when clinical changes are not expected. Future
studies are needed to investigate effects resulting from
motivational context and interactive functional content as
well as feedback during therapies. Such therapies can take
place using the robot-mediated therapy or the sling sus-
pension of the arm. However, the virtual reality and feed-
back mechanism is also a likely promoter to recovery and
can be a target for future investigations. Further work is
required to investigate the effects arising from early inter-
vention, longer exposure and intensity of the therapies.
Finally, more function-oriented RMT or SS therapies are
needed to clarify the effects resulting from each interven-
tion for stroke recovery.
Competing interests
The author(s) declare that they have no competing inter-
ests.
Authors' contributions
FA conceived of this methodological study. He was
involved in multivariate model design and execution, sta-
tistical analysis and coordination activities. He was also
responsible for drafting this manuscript. RL provided
feedback throughout this methodological study and
assisted with drafting the manuscript. EG was one of the
research physiotherapists who conducted the clinical trial,
which included the Fugl Meyer measurements and col-
lected the data from the Reading patients. CC was respon-
sible for the clinical trial in Reading and also assisted in
the design of the clinical study. WH was the coordinator
of the GENTLE/S project and provided advice and feed-
back on the manuscript. GJ was also a leading partner dur-
ing the GENTLE/S project and has contributed to detailed
discussions on the methodology as well as providing help
with the manuscript.
Acknowledgements
The work presented in this paper has been carried out with financial sup-
port from the Commission of the European Union, Framework 5, specific
RTD programme "Quality of Life and Management of Living Resources",
QLK6-1999-02282, "GENTLE/S – Robotic assistance in neuro and motor
rehabilitation". It does not necessarily reflect its views and in no way antic-
ipates the Commission's future policy in this area. We are grateful to all of
the patients that kindly took part in the clinical trial. We are grateful to all
our colleagues in the GENTLE/S consortium (University of Reading, UK;
Rehab Robotics, UK; Zenon, Greece; Virgo, Greece; University of Stafford-
shire, UK; University of Ljubljana, Slovenia; Trinity College Dublin, Ireland;
TNO-TPD, Netherlands; University of Newcastle, UK) for their ongoing
commitment to this work. Also special thanks to Dr. Emma Stokes and Dr
Susan Coote for their roles in designing the clinical study and coordinating
the clinical trial at the Adelaide & Meath Hospital, Dublin and for providing
the Dublin data. The first author also acknowledges support from Dr.
N.S.Barrens fund.
References
1. Amirabdollahian F, Loureiro R, Harwin W: Minimum Jerk Trajec-
tory Control for Rehabilitation and Haptic Applications. In
International conference on robotics and automation; May 2002; Washing-
ton, DC IEEE; 2002:3380-3385.
2. Hogan N: An organizing principle for a class of voluntary
movements. Journal of Neuroscience 1984, 4:2745-2754.
3. Langhorne P, Wagenaar R, Partridge C: Physiotherapy after
stroke, more is better? Physiotherapy Research International 1996,
1:75-88.
4. Coote S, Stokes E, Murphy B, Harwin W: The effect of GENTLE/S
robot-mediated therapy on upper extremity dysfunction post
stroke. ICORR2003, The 8th International Conference on Rehabilitation
Robotics; April 2003; Daejeon, Korea 2003:59-61.
5. Fugl-Meyer AR, Jaasko L, Leyman I: The post-stroke hemiplegic
patient. A method for evaluation of physical performance.
Scand J Rehabil Med 1975, 7:13-31.
6. Duncan PW, Propst M, Nelson SG: Reliability of the Fugl-Meyer
assessment of sensorimotor recovery following cerebrovas-
cular accident. Physical Therapy 1983, 63:1606-1610.
7. Platz T, Pinkowski C, van Wijck F, Kim IH, di Bella P, Johnson G: Reli-
ability and validity of arm function assessment with standard-
ized guidelines for the Fugl-Meyer Test, Action Research
Arm Test and Box and Block Test: a multicentre study. Clini-
cal Rehabilitation 2005, 19:404-411.
8. van Wijck FMJ, Pandyan AD, Johnson GR, Barnes MP: Assessing
Motor Deficits in Neurological Rehabilitation: Patterns of
Instrument Usage. Neurorehabilitation and Neural Repair 2001,
15:23-30.
9. Krebs HI, Volpe BT, Palazzolo J, Rohrer B, Ferraro M, Fasoli S, Edel-
stein L, Hogan N: Robot-Aided Neuro Rehabilitation in Stroke:
Interim Results on the Follow-Up of 76 Patients and on Move-
ment Performance Indices. In Rehabilitation robotics; Integration of
assistive technology in the information age; Every, Paris Edited by: Mokhtari
M. IOS Press; 2001:45-59.
10. Amirabdollahian F, Gradwell E, Loureiro R, Collin C, Harwin W:
Effects of the Gentle/s Robot Mediated Therapy on the Out-
come of Upper Limb Rehabilitation Post-Stroke: Analysis of
the Battle Hospital Data. ICORR2003, the 8th International Confer-
ence on Rehabilitation Robotics; April 2003; Daejeon, Korea 2003:55-58.
11. Lum PS, Burgar CG, Shor P, Majmundar M, Van der Loos M: Robot-
Assisted Movement Training Compared With Conventional
Therapy Techniques for the Rehabilitation of Upper-Limb
Function After Stroke. Arch Phys Med Rehabil 2002, 83:952-959.
12. Volpe BT, Krebs HI, Hogan N: Is robot-aided sensorimotor train-
ing in stroke rehabilitation a realistic option? Current Opinion in
Neurology 2001, 14:745-752.
13. Dimitrov D, Fitzgerald S, Rumrill P: Multiple regression in rehabil-
itation research. Work-Andover Medical Publishers Incorporated 2000,
15:209-216.
14. Hardy MA: Regression with Dummy Variables SAGE Publications; 1993.
15. Dunlap WP, Xin X, Myers L: Computing Aspects of Power for
Multiple Regression. Behavior Research Methods Instruments and
Computers 2004, 36:695-701.
16. Erdfelder E, Faul F, Buchner A: GPOWER: A General Power
Analysis Program. Behavior Research Methods Instruments and Com-
puters 1996, 28:1-11.
17. Stevens JP: Applied Multivariate Statistics for the Social Sciences 4th edi-
tion. Lawrence Erlbaum Associates Inc Publishers; 2002.
18. Field A: Regression. In Discovering Statistics Using SPSS 2nd edition.
Edited by: Wright DB. London: SAGE Publications; 2005:143-217.
Publish with BioMed Central and every
scientist can read your work free of charge
"BioMed Central will be the most significant development for
disseminating the results of biomedical research in our lifetime."
Sir Paul Nurse, Cancer Research UK
Your research papers will be:
available free of charge to the entire biomedical community
peer reviewed and published immediately upon acceptance
cited in PubMed and archived on PubMed Central
yours — you keep the copyright
Submit your manuscript here:
/>BioMedcentral
Journal of NeuroEngineering and Rehabilitation 2007, 4:4 />Page 16 of 16
(page number not for citation purposes)
19. Beckerman H, Vogelaar TW, Lankhorst GJ, Verbeek ALM: A crite-
rion for stability of the motor function of the lower extremity
in stroke patients using the Fugl-Meyer assessment scale.
Scandinavian Journal of Rehabilitation Medicine 1996, 28:3-8.
20. Mak CFP, Gomes GT, Johnson GR: A robotic approach to neu-
rorehabilitation-interpretation of biomechanical data. Seventh
International Symposium on the 3-D Analysis of Human Movement; 10–12
July; Centre for Life, Newcastle upon Tyne 2002.
21. Sukal TM, Ellis MD, Dewald JPA: Dynamic Characterization of
Upper Limb Discoordination Following Hemiparetic Stroke.
9th International Conference on Rehabilitation Robotics; June 28 – July 1,
2005; Chicago, IL, USA 2005.