Nuclear Power Control, Reliability and Human Factors Part 9 doc
Bạn đang xem bản rút gọn của tài liệu. Xem và tải ngay bản đầy đủ của tài liệu tại đây (1.31 MB, 30 trang )
Degradation Due to Neutron Embrittlement of Nuclear Vessel Steels:
A Critical Review about the Current Experimental and Analytical Techniques…
229
(Guthrie, 1984) and (Odette et al., 1984). Both contributions used surveillance data from
commercial power reactors. The bases for their regression correlations were different in that
Odette made greater use of physical models of radiation embrittlement. The two papers
contain similar recommendations: (1) separate correlation functions should be used for weld
and base metal, (2) the function should be the product of a chemistry factor and a fluence
factor, (3) the parameters in the chemistry factor should be the elements copper and nickel,
and (4) the fluence factor should provide a trend curve slope of about 0.25 to 0.30 on log-log
paper at 10
19
n/cm
2
(E > 1 MeV), steeper at low fluences and flatter at high fluences.
0.28 0.10·log
·
f
NDT
RT CF f
(7)
CF (°F) in equation (7) is the chemistry factor, a function of copper and nickel content. CF is
tabulated in (RG 1.99 (2), 1988) for welds and base metal (plates and forgings). Linear
interpolation is permitted. If there is no information available, 0.35% copper and 1.0% nickel
should be assumed.
The neutron fluence at any depth x in the vessel wall, f(x) (10
19
n/cm
2
, E > 1 MeV), is
determined following equation (8):
0.24·
·
x
SURF
fx f e
(8)
where f
surf
(10
19
n/cm
2
, E > 1 MeV) is the calculated value of the neutron fluence at the inner
surface of the vessel, and x (in inches) is the depth in the vessel wall measured from the
vessel inner surface. Alternatively, if dpa calculations are made as part of the fluence
analysis, the ratio of dpa at the depth in question to dpa at the inner surface may be
substituted for the exponential attenuation factor in equation (8).
The third term in (6), M, is the quantity, °F, that is to be added to obtain conservative, upper-
bound values of the adjusted reference temperature. M is obtained through equation (9).
22
2·
U
M
(9)
Here, σ
U
is the standard deviation for the initial RT
NDT
. If a measured value of initial RT
NDT
for the material in question is available, σ
U
is to be estimated from the precision of the test
method. If not, generic mean values for that class of material are used. The standard
deviation in ΔRT
NDT
, σ
Δ
, is 28ºF for welds and 17ºF for base metal, except that σ
Δ
need not
exceed 0.50 times the mean value of ΔRT
NDT
.
Finally, when two or more credible surveillance data sets become available from the reactor
in question, they may be used to determine the adjusted reference temperature of the
beltline materials. In this case, if there is clear evidence that the copper or nickel content of
the surveillance weld differs from that of the vessel weld, the measured values of ΔRT
NDT
should be adjusted by multiplying them by the ratio of the chemistry factor for the vessel
weld, (CF)
V
, to that of the surveillance capsule weld, (CF)
C
, see equation (10).
·
V
NDT NDT
VC
C
CF
RT RT
CF
(10)
Second, the surveillance data should be fitted using equation (7) to obtain the relationship of
ΔRT
NDT
to fluence. To do so, calculate the chemistry factor, CF, for the best fit by
Nuclear Power – Control, Reliability and Human Factors
230
multiplying each adjusted ΔRT
NDT
by its corresponding fluence factor, summing the
products, and dividing by the sum of the squares of the fluence factors. The resulting value
of CF will give the relationship of ΔRT
NDT
to fluence that fits the plant surveillance data in
such a way as to minimise the sum of the squares of the errors.
4.2.2 Standard ASTM E 900 - 02
The purpose of ASTM Standard E 900-02 (ASTM E 900, 2002) is to establish an improved
correlation in respect of that proposed by the Regulatory Guide (RG1.99 (2), 1988) which
allowed the transition temperature shift, ΔT
41J
, to be obtained as a function of the neutron
fluence. The data base used in this case consisted of 600 data; thus, it is much more robust
than that of the Regulatory Guide where only 177 data were available. Here, the
expressions are not purely phenomenological but physically guided, taking into
consideration when possible the nanofeatures participating in the process (described above).
Another interesting feature is that the ASTM E 900-02 formulation is based on robust
statistical techniques for the treatment of the large data set (non-linear, least-square
regression analysis). It is worth noting that the origin of this procedure relies on the
expressions proposed by (Eason et al., 1998). The procedure distinguishes between the three
mechanisms described in Section 4.1:
Stable matrix damage (SMD) associated with the presence of point defects and loop
dislocations.
Copper rich precipitates (CRPs).
Grain Boundary Segregations (GBSs) of embrittling elements as phosphorus.
As there is no evidence of the influence of this last mechanism on USA vessels, the form of
the correlation involves only the two major embrittlement terms: the SMD and the CRP;
nevertheless, the influence of phosphorus is indirectly present through the SMD. The mean
value of the transition temperature shift is calculated as follows (11):
Shift SMD CRP
(11)
The formulas for both terms must take into consideration the empirical reality; specifically,
the CRP mechanism saturates with fluence while, on the contrary, the SMD damage process
grows monotonically, apparently without limit.
Expression (12) represents the transition temperature shift, in ºF, due to the SMD
20730
0.5076
460
18
6.70·10 · ·
i
T
SMD e
(12)
The main characteristics as well as the meaning of the variables are explained below:
The influence of irradiation temperature, T
i
, in ºF, in the range 275-295 ºC (527 – 563 ºF,
respectively) is modelled by means of an exponential function.
The effect of the irradiation, which is expressed in the neutron fluence, Φ (n·cm
-2
, E > 1
MeV), increases indefinitely, without saturation.
There is no explicit dependence on the neutron flux, φ.
The second term in (11) which represents the shift in the transition temperature due to the
CRP mechanism, in ºF, responds to formula (13), together with expressions (14) and (15):
1.173
· 1 2.106· · ·CRP B Ni F Cu G
(13)
Degradation Due to Neutron Embrittlement of Nuclear Vessel Steels:
A Critical Review about the Current Experimental and Analytical Techniques…
231
0.577
0.072FCu Cu
(14)
where Cu≤0.305 in general and Cu≤0.25 for Linde 80 and 0091.
lo
g
18.24
11
·
2 2 1.052
GTanh
(15)
The relevant features in (13-15) and the meaning of the variables is explained in the
following:
The coefficient B takes different values depending on the material (B=234, for welds;
B=128 for forgings; B=208 for combustion engineering plates; B=156 for other plates).
There is a strong influence of the nickel content, Ni (expressed in % wt.).
The influence of Cu is taken into consideration through F(Cu) (14); this effect occurs
only for Cu>0.072% and saturates for Cu>0.305% (0.25% for Linde 80 and 0091)
The irradiation temperature is not considered to play a role.
The neutron fluence Φ influence is represented through the term G(Φ) where the
saturation is modelled as a hyperbolic tangent function.
Moreover, a term corresponding to the standard deviation σ
TTS
=22ºF must be considered. It
takes into consideration the uncertainties in the input data and in the preparation of the
model.
5. The Master Curve model for the description of the fracture toughness in
the DBT region
5.1 Description of the model
Advances in fracture mechanics technology have made it possible to improve the semi-
empirical indirect methodology described above, currently in force to describe the
fracture toughness in the DBT region in different aspects. First, the development of EPFM
allows fracture toughness values to be determined using much smaller specimens and
utilising J integral techniques, that is, measuring values of K
Jc
instead of K
Ic
. Moreover,
the analytical techniques for structural integrity assessment can now be expressed in
terms of EPFM. The first issue, which is considered relevant for the contents of this
chapter, is described in the present section; indeed, the scope is explicitly focused on the
Master Curve (MC) approach to describe the fracture toughness of vessel steels in the
DBT region.
The MC model, originally proposed by Wallin (Wallin, 1984; Wallin et al. 1984; Wallin,
1989; Wallin, 1995), provides a reliable tool based on a direct characterisation of the
fracture toughness in the DBT region. This approach is a consequence of the
developments in EPFM together with an increased understanding of the micro-
mechanisms of cleavage fracture. Valiente et al. (Valiente et al., 2005) have briefly but
comprehensively reviewed the previous contributions made to understand cleavage in a
ferritic matrix that leads to the MC approach. The basic MC method for analysis of brittle
fracture test results is defined in the standard ASTM E 1921 (ASTM E 1921, 2009). The
mathematical and empirical details of the procedure are available in (Merkle et al., 1998;
Ferreño, 2008; Ferreño et al. 2009). The main features and advantages of the method are
hereafter summarised:
Nuclear Power – Control, Reliability and Human Factors
232
MC assumes that cleavage fracture in non austenitic steels is triggered by the
presence of particles close to the crack tip. Therefore, fracture is mainly an initiation
dependent process. As a consequence, fracture is governed by weakest link statistics
which follows a three parameter Weibull distribution. For small-scale yielding
conditions, therefore using EPFM, the cumulative failure probability, P
f
, is given by
equation (16):
min
00min
·
1
m
Jc
KK
B
BKK
f
Pe
(16)
where K
Jc
is the fracture toughness for the selected failure probability, P
f
, K
0
is a
characteristic fracture toughness corresponding to 63.2% cumulative failure probability,
B is the specimen thickness and B
0
a reference specimen thickness, B
0
= 25.4 mm. The
experimental data allows the Weibull exponent, m=4, to be fixed (Merkle et al., 1998)
and the minimum value of fracture toughness for the probability density function,
K
min
= 20 MPa·m
1/2
. Therefore, only K
0
must be estimated from the empirical available
data.
The dependence between K
0
(in MPa·m
1/2
) and temperature (ºC) for cleavage fracture
toughness is assumed to be (17):
0
0.019·
0
31 77·
TT
Ke
(17)
where T
0
is the so-called MC reference temperature; it corresponds to the temperature
where the median fracture toughness for a 25 mm thickness specimen (1T, according to
ASTM terminology) has the value 100 MPa·m
1/2
.
One of the main advantages of the method is that it allows data from different size
specimens to be compared. As thickness increases, the toughness is reduced, due to the
higher probability of finding a critical particle for the applied load. The ASTM standard
(ASTM E 1921, 2009) provides expressions to relate the fracture toughness for
specimens of different thicknesses. Equation (16) can be re-written considering the same
failure cumulative probability, P
f
, for two specimens of different thickness, namely B
1
and B
2
, thus leading to expression (18):
1
4
2
,2 min ,1 min
1
·
cc
JJ
B
KK KK
B
(18)
The distribution fitting procedure involves finding the optimum value of T
0
for a
particular set of data. For this task, all data are thickness adjusted to the reference
specimen thickness B
0
= 25.4 mm using equation (18). The procedure can be applied
either to a single test temperature or to a transition curve data, T
i
being the generic
temperature of the different tests. In the latter approach (the former is just a particular
case) T
0
is estimated from the size adjusted K
JC
data (K
JC,1T
) using a multi-temperature
maximum likelihood expression (see equation (19)). To estimate the reference
temperature, T
0
, a previous censoring of the non size-adjusted data must be applied.
Fracture toughness data that are greater than the validity limit given by equation (20),
as defined in (ASTM E 1921, 2009), are reduced to the validity limit, K
Jc(lim)
and treated
Degradation Due to Neutron Embrittlement of Nuclear Vessel Steels:
A Critical Review about the Current Experimental and Analytical Techniques…
233
as censored values in the subsequent estimation stage (δ
i
=0 in expression (19)). This
condition is imposed to guarantee high constraint conditions in the crack front during
the fracture process.
0
0
0
4
0.019·
0.019·
,
5
0.019·
0.019·
11
20 ·
·0
11 77·
11 77·
i
i
io
i
TT
TT
NN
Jc i
i
TT
TT
ii
Ke
e
e
e
(19)
0
(lim)
2
··
30· 1
Y
Jc
Eb
K
(20)
In equation (20) σ
y
is the yield strength at test temperature, E is the Young’s modulus, b
0
the initial ligament and ν is the Poisson’s ratio. It must be stressed that factor 30 in
equation (20) is currently under discussion (Merkle et al., 1998) and that, for instance,
the ASTM E1820-01 Standard (ASTM E 1820, 2001) imposes a more demanding limit
with a factor 50 or 100 depending on the nature of the steel.
The standard deviation in the estimate of T
0
, expressed in ºC, is given by (21):
0
T
r
(21)
where r represents the total number of valid specimens (not censored results) used to
establish T
0
. The values of the factor β are provided in (ASTM E 1921, 2009).
The statistical analysis can be reliably performed even with a small number of
fracture toughness tests (usually between 6 and 10 specimens). Moreover, as an EPFM
approach is used, the specimen size requirement, equation (20), is much less
demanding than that of the LEFM (ASTM E 399, 2009). These remarks are of great
relevance in nuclear reactor surveillance programmes where the amount of material
available is usually very limited and consists of small size samples (Charpy
specimens).
By rearranging equations (16) and (17) it is possible to obtain expression (22) which
provides an estimate of K
Jc
for a given cumulative failure probability, P
f
, once T
0
has
been determined. In this way, the confidence bounds of the distribution (usually taking
P
f
= 0.01 or 0.05 for the lower bound and 0.95 or 0.99 for the upper bound) can be
obtained. As a particular case, the expression for the median fracture toughness (P
f
=
0.5) (see Equation (23)) is determined.
0
0.25
0.019·
,min
ln 1 · 11 77·
TT
cf
JP f
KK P e
(22)
0
0.019
30 70·
c
TT
Jmed
Ke
(23)
Finally, any test that does not fulfil the requirement for crack front straightness or that
terminates in cleavage after more than a limit of slow-stable crack growth will also be
regarded as invalid.
Nuclear Power – Control, Reliability and Human Factors
234
5.2 Open issues concerning the Master Curve approach
The MC has become a mature tool for characterising the fracture toughness of ferritic steels
in the DBT region. Considerable empirical evidence provides testament to the robustness of
the MC procedure. One of the main advantages of this procedure relies on the possibility of
assessing the state of a RPV vessel by direct measurement of fracture toughness rather than
through the use of the currently accepted correlative approaches, based on Charpy tests.
The procedure currently accepted to assess the steel neutron embrittlement partially
incorporates the MC reference temperature concept, T
0
; in this sense, to enable the use of the
MC methodology without completely modifying the structure of the ASME code the
approach stated in code cases N-629 (ASME CC 629, 1999) and N-631 (ASME CC 631, 1999)
was adopted. It consists of defining a new index temperature, RT
T0
, for the K
Ic
and K
IR
ASME curves (4, 5), as an alternative to RT
NDT
. The definition of RT
T0
is given in equation
(24). This value of RT
T0
is set, see (VanDerSluys et al., 2001), by imposing that the ASME K
Ic
curve indexed with RT
T0
in place of RT
NDT
will bound the majority of the actual material
fracture toughness data. In this sense, RT
T0
was set such that the corresponding ASME K
Ic
curve falls below the MC 95% confidence bound for at least 95% of the data generated with
1T specimens.
0
0
19.4 º
T
RT T C
(24)
Evidently, this approach, currently in force, is merely a compromise solution that attempts
to fit the new concepts into the old structure. Apart from this practical aspect, several other
open issues remain concerning the application of the MC as well as theoretical aspects. The
following issues must be emphasised:
There is no experimental data that allows the MC to be used in special applications such
as irradiated materials with high neutron fluence, materials susceptible to intergranular
fracture or materials showing exceptional lower-shelf or transition behaviour. Indeed,
the main feature of the MC method consisting of assuming that the dependence of the
fracture toughness of a material on temperature in the transition range is not sensitive
to characteristics such as the mechanical properties and the microstructure is purely
speculative for the cases mentioned above.
The published literature shows that the PCCv (Pre Cracked Charpy-V Notched)
specimen analysed using the ASTM Standard E 1921 (ASTM E 1921, 2009) generally
shows a reference temperature ~10 °C lower than the CT (compact tension) specimen.
Compared with the inherent scatter in the transition temperature, this difference is
small. However, it has been observed in many materials. Although different hypotheses
were proposed a decade ago in order to explain this fact, the current consensus in the
scientific community is that this difference is motivated by the different level of
constraint in single edge notch bend and CT geometries.
The above issue is a particular case of the general question of how crack-tip constraint
effects (stress tri-axiality in the vicinity of the crack tip) can be described. In fracture
mechanics, it is well known that crack-tip constraint can be influenced by loading (out
of plane or multi-axial loading) or by the crack shape and crack depth to ligament ratio.
Nevertheless, to date, there is no agreement about how to manage crack tip constraint
in the practical application of structures and components containing postulated or real
cracks and made of ferritic steel.
Degradation Due to Neutron Embrittlement of Nuclear Vessel Steels:
A Critical Review about the Current Experimental and Analytical Techniques…
235
The MC approach procedure standardised in ASTM E1921 (ASTM E 1921, 2009) is
defined for quasi-static loading conditions. However, the extension of the MC method
to dynamic testing is still under discussion although a great effort has been made over
the last decade to qualify the method for dynamic loading conditions and to use it for
structural purposes.
This list of questions currently under discussion reveals that, although the MC methodology
is increasingly being recognised as an attractive alternative for describing the fracture
toughness of ferritic steels in the DBT region, further research needs to be done in order to
properly deal with the open issues mentioned above.
6. Conclusions
The purpose of this chapter was to provide the readers with an introductory text, self-
contained insofar as possible, concerning the current state of the art in the process of
embrittlement that takes place in nuclear vessel steels, paying particular attention to the
ductile to brittle transition region. It was the purpose of the authors to introduce the topics
in a logical sequence in an attempt to explain the scientific and historical arguments that
justify the different methods and tools currently available. A phenomenological and
scientific description of the causes and consequences of material embrittlement was
presented. An explanatory description of the characterisation tools that are available for the
nuclear facilities -implemented in their surveillance programmes- to determine the
evolution of the fracture toughness of the vessel steel throughout the operative lifetime of
the plant, emphasising their advantages and limitations, was also included. This leads, in a
natural way, to the Master Curve methodology, as an alternative procedure for obtaining, in
the context of Elastic-Plastic Fracture Mechanics, the material fracture toughness; as stressed
in the text, this procedure offers many advantages and few limitations, which is why it is
widely used at present in a great number of ambitious scientific research projects. It is the
opinion of the authors that all of the evidence available points to the fact that the Master
Curve approach is set to become an indispensable ingredient in the future of surveillance
programmes.
7. References
ASTM E 23–01. Standard Test Methods for Notched Bar Impact Testing of Metallic
Materials.
Anderson, T.L. (1995). Fracture Mechanics. Fundamentals and Applications (2
nd
Ed.), CRC Press,
ISBN-13: 9780849342608, USA.
Griffith, A.A. (1920). The Phenomena of Rupture and Flow in Solids, Philosophical
Transactions, Series A, Vol. 221, pp. 163-198.
Inglis, C.E. (1913). Stresses in a Plate Due to the Presence of Cracks and Sharp Corners,
Transactions of the Institute of Naval Architects, Vol. 55, pp. 219-241.
Irwin, G.R. (1956). Onset of Fast Crack Propagation in High Strength Steel and Aluminium
Alloys, Sagamore Research Conference Proceedings, Vol. 2, pp. 289-305.
Irwin, G.R. (1957). Analysis of Stresses and Strains near the End of a Crack Traversing a
Plate. Journal of Applied Mechanics, Vol. 24, pp. 361-364.
Nuclear Power – Control, Reliability and Human Factors
236
Westergaard, H.M. (1939). Bearing Pressures and Cracks. Journal of Applied Mechanics, Vol. 6,
pp. 49-53.
ASTM E399 - 09e2. Standard Test Method for Linear-Elastic Plane-Strain Fracture Toughness
K
Ic
of Metallic Materials.
Wells, A.A. (1961). Unstable Crack Propagation in Metals: Cleavage and Fast Fracture,
Proceedings of the Crack Propagation Symposium, Vol. I, Paper 84.
Rice J.R. (1968). A Path Independent Integral and the Approximate Analysis of Strains
Concentration by Notches and Cracks. Journal of Applied Mechanics, Vol. 35, pp. 379-
386.
ASME Boiler and Pressure Vessel Code. American Society of Mechanical Engineers, New
York.
ASTM E 208 – 95a. Standard Test Method for Conducting Drop-Weight Test to Determine
Nil-Ductility Transition Temperature of Ferritic Steels.
Rules and Regulations Title 10 Code of Federal Regulations (CFR) Part 50.61, Appendix G
(1986). Fracture Toughness Requirements for Protection Against Pressurized
Thermal Shock Events, Washington, D.C., U.S. Government Printing Office, U.S.
Nuclear Regulatory Commission.
Regulatory Guide 1.99-Rev 2 (1988). Radiation Embrittlement of Reactor Pressure Vessel
Materials, U.S. Government Printing Office, U.S. Nuclear Regulatory Commission,
NRC, Washington D.C
ASTM E 185 – 02. Standard Practice for Design of Surveillance Programs for Light-Water
Moderated Nuclear Power Reactor Vessels.
ASTM E 2215 – 02. Standard Practice for Evaluation of Surveillance Capsules from Light-
Water Moderated Nuclear Power Reactor Vessels.
ASTM E 853 – 01. Standard Practice for Analysis and Interpretation of Light-Water Reactor
Surveillance Results, E706(IA).
ASTM E8 / E8M - 09 Standard Test Methods for Tension Testing of Metallic Materials
ASTM E1820-01. Standard Test Method for Measurement of Fracture Toughness.
ASTM E1921-09-a. Test Method for the Determination of Reference Temperature T0 for
Ferritic Steels in the Transition Range.
ASTM E 900-02. Standard Guide for Predicting Radiation-Induced Transition Temperature
Shift in Reactor Vessel Materials, E706 (IIF).
ASTM 1253-99. Standard Guide for Reconstitution of Irradiated Charpy Specimens.
Eason, E.D., Wright, J.E., Odette, G.R. (1998). Improved Embrittlement Correlations for Reactor
Pressure Vessel Steels. NUREG/CR-6551, MCS 970501, U.S. Government Printing
Office, U.S. Nuclear Regulatory Commission, NRC, Washington D.C
Odette, G.R., Lucas, G.E. (1998). Recent Progress in Understanding Reactor Pressure Vessel
Embrittlement. Radiation Effects and Defects in Solids, No. 144, pp. 189-231.
Odette, G.R., Lucas, G.E. (2001). Embrittlement of Nuclear Reactor Pressure Vessels. JOM, Vol.
53, No. 7, pp. 18-22.
Stoller, R.E., Odette, G.R., Wirth, B.D. (1997). Primary Damage Formation in BCC Iron. Journal
of Nuclear Materials, No. 251, pp 49-60.
Degradation Due to Neutron Embrittlement of Nuclear Vessel Steels:
A Critical Review about the Current Experimental and Analytical Techniques…
237
Wirth, B.D., Odette, G.R. (1999). Kinetic Lattice Monte Carlo Simulations of Cascade Aging in
Dilute Iron-Copper Alloys. Microstructural Processes in Irradiated Materials, MRS
Symp. Proc. 540, ed. J. Zinkle el al. , pp. 637-642.
Server, W., English, C., Naiman, D., Rosinski, S. (2001). Charpy Embrittlement
Correlations-Status of Combined Mechanistic and Statistical Bases for U.S. RPV
Steels (MRP-45), PWR Materials Reliability Programme (PWRMRP), 1000705,
EPRI Final Report.
Yamashita, N., Iwasaki, M., Dozaki, K. (2010). Industry Practice for the Neutron Irradiation
Embrittlement of Reactor Pressure Vessels in Japan. J. Eng. Gas Turbines Power, Vol.
132, Issue 10.
Guthrie, G.L. (1984). Charpy Trend Curves Based on 177 PWR Data Points. LWR Pressure
Vessel Surveillance Dosimetry Improved Program. NUREG/CR-3391.
Odette, G.R. et al. (1984). Physically Based Regression Correlations of Embrittlement Data from
Reactor Pressure Vessel Surveillance Programs. Electric Power Research Institute, NP-
3319.
Wallin, K. (1984). The scatter in K
IC
-results. Engineering Fracture Mechanics, Vol. 19, Issue 6,
pp. 1085-1093.
Wallin K, Saario T & Törrönen K (1984). Statistical model for carbide induced brittle fracture
in steel. Metal Sci , Vol. 18, pp. 13–16.
Wallin K. (1989). A simple theoretical Charpy V–K
Ic
correlation for irradiation
embrittlement. Innovative approaches to irradiation damage and fracture analysis, PVP
170. ASME. pp. 93–100.
Wallin, K. (1995). The size effect in K
IC
results. Engineering Fracture Mechanics, Vol. 22, Issue
1, pp. 149-163.
Valiente, A. Ruiz J. & Elices, M. (2005). A probabilistic model for the pearlite-induced
cleavage of a plain carbon structural steel. Engineering Fracture Mechanics, Vol. 72,
Issue 5, pp. 709-728.
Merkle J., Wallin K. & McCabe D. (1998). Technical basis for an ASTM Standard on
determining the reference temperature, T
0
, for ferritic steels in the transition range.
Washington, DC: Oak Ridge National Laboratory. NUREG/CR-5504, ORNL/TM-
13631.
Ferreño, D (2008). Integridad estructural de vasijas nucleares en base a la curva patrón
obtenida mediante probetas reconstruidas. PhD thesis, University of Cantabria,
Spain.
Ferreño D., Scibetta M., Gorrochategui I., Lacalle R., van Walle, E. & Gutiérrez- Solana, F.
(2009). Engineering Fracture Mechanics, Vol. 76, Issue 16, pp. 2495-2511.
ASME Boiler and Pressure Vessel Code–Code Case N-629. Use of fracture toughness test
data to establish reference temperature for pressure retaining materials, Section XI,
Division 1, 1999.
ASME Boiler and Pressure Vessel Code–Code Case N-631. Use of fracture toughness test
data to establish reference temperature for pressure retaining materials other than
bolting for class 1 vessels, Section III, Division 1, 1999.
Nuclear Power – Control, Reliability and Human Factors
238
VanDerSluys, W.A., Hoffmann, C.L., Yoon, K.K., Server, W.L., Lott, R.G., Rosinski, S., Kirk,
M.T., Byrne, S., Kim, C.C. (2001). Fracture toughness master curve development:
Application of master curve fracture toughness methodology for ferritic steels,
Bulletin 458, Welding Research Council, WRC, New York.
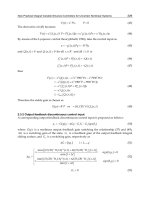
13
Corrosion Monitoring of the Steam
Generators of V-th and VI-th Energy
Blocks of Nuclear Power Plant “Kozloduy”
Nikolai Boshkov, Georgi Raichevski, Katja Minkova and Penjo Penev
Institute of Physical Chemistry, Bulgarian Academy of Sciences
Nuclear Power Plant “Kozloduy”
Bulgaria
1. Introduction
Corrosion resistance and erosion wear of the metal equipment (body, pipe bundles, steam
generators etc.) are of great importance for the operating time limit of the nuclear power
plants (NPP) bearing in mind their extremely heavy technological and water-chemical
regime (WCR). The horizontally placed steam generators (SGs) used in the Energy Blocks of
NPP “Kozloduy” work at exploitation conditions leading to corrosion and erosion provoked
processes (Andreeva M. et. al., 2008). Similar is the situation in the greater part of the
modern power plants (R.W. Staehle & J.A. Gorman, 2003; R.W. Staehle & J.A. Gorman, 2004;
R.W. Staehle & J.A. Gorman, 2004). This fact predetermines the necessity of very careful
daily and also periodical monitoring concerning the real operating state of the equipment
during its exploitation time (Sviridenko, I., 2008; Hadavi, S.M.H., 2008; Viehrig, H W., et.
al., 2006; Slugen, V., et. al., 2005). The evaluation and explanation of the obtained results for
the electrochemical-corrosion parameters will ensure a realistic base for a precise prognosis
and trouble-free operation of the installations (J. Congleton et all, 1985; Raichevski G. et al.,.
2007; Hojna A. et. al, 2007; Kaczorowski D. et. al., 2006).
Markedly dangerous negative influences leading to technical failures and damages have the
conglomerated corrosion products (CPs) the latter appearing as a result of the WCR mainly
in the second contour of NPP. Considerable part of them enters the condense-feeding part of
SGs and deposit as loose layers on the pipe surface or falls as middling slime on the bottom
changing in such a way the overall electrochemical and hydrodynamic situation in the
internal volume during the operation procedures.
In general, CPs presenting in the steam generators consist of iron and copper oxides and
hydroxides. If their adhesion to the surface is enough strong (for example, like in the case of
magnetite – Fe
3
O
4
) it can be expected that a passive layer will appear on the surface of the
equipment and in such a way this part of the installation will be additionally protected. If
CPs are crumbly the operative situation in the SGs will be worsen since these deposits often
lead to accelerated formation and development of local corrosion phenomena – holes, pits,
cracks, including appearance of stress corrosion cracking process etc., the latter being one of
the most dangerous events due to its practical invisibility up to the moment of the sudden
physical-mechanical destroying (Zubchenko, A.S., et al., 2004; Slugen, V., et al., 2002; Lunin,
G.L., et al., 1997; N.D. Budiansky, et al., 2005).
Nuclear Power – Control, Reliability and Human Factors
240
The presence of sulphate, copper and especially chloride ions additionally contributes to the
corrosion damages resulting in local ruptures with different sizes. When CPs have loose
structure and high porosity the concentration of Cl
-
ions in their volume increases due to the
flowing capillary processes. This effect is stronger expressed in the contact places of the
pipes with the distance grid as well as at the lowest placed rows of the pipe bundles in SGs.
In general, the aim of the present investigation is to determine and evaluate the role of
different aggressive components presenting in the technological medium on the corrosion
behavior of austenitic stainless steel of the type 18Cr10NiTi which material is used to
produce the pipe bundles in the SGs of the second contour of Energy blocks No. V and No.
VI of NPP “Kozloduy”. Some of the results obtained by polarization technique are
compared with the experimental data of low-alloyed steel.
2. Experimental
2.1 Samples
Two different steel sample types with dimensions 1 x 1 cm (working area of 2 cm
2
) are used:
- High-alloyed (HAS) austenitic stainless steel 18Cr10NiTi which is applied as a main
construction material for the pipe bundles in the SGs of NPP “Kozloduy” (composition:
Cr – 18 wt.%; Ni – 10 wt.%; Ti – about 1 wt.%; balance – Fe).
- Low-alloyed (LAS) steel 38GN2MFA (composition: Cr, Ni, Mn and Si – about 6 wt.%
total; balance - Fe) used in general as a construction steel and as a comparative sample.
2.2 Corrosion medium
The corrosion tests are carried out in a model corrosion medium (MCM) consisting of trebly
distilled demineralised water (specific electric conductivity ≤ 1 μS/cm), hydrazine (25 μg/L)
and in definite cases selected anions or cations (Cl
-
, SO
4
2-
, Na
+
, Cu
+
, Cu
2+
- both latter
presented in the text as Cu
total
). The pH value is about 9 aiming the modelling of conditions
maximal close to the exploitation ones. Special attention is paid to the effectiveness of the
added compound that inhibits the development of the damaging processes on the surface
and in the depth – monoethanolamine (MEA) at concentration of 2 mg/L.
2.3 Sample characterization
2.3.1 Potentiodynamic (PD) and potentiostatic (PS) polarization curves
Potentiodynamic (PD) polarization curves (scan rate of 1 mV/s.) are carried out at two
selected operating temperatures (35
o
C and 95
o
C, respectively) in a three-electrode
experimental glass cell using “VersaStat” (AMETEK PAR) device. The cell has a volume of
300 cm
3
and Luggin capillary for minimizing the Ohmic resistance. Platinum plate serves as
a counter electrode and saturated calomel electrode (SCE) - as a reference electrode.
The investigations of the local corrosion phenomena are realized in a special constructed test
electrode the latter allowing simulation of the processes taking place in cracks with different
widths. This electrode consists of ceramic body, separators (mica lamellas), titanium linings
etc. giving the opportunity to work also at high temperatures and pressures aiming the
modelling (approaching) of the real operating conditions in the SGs.
In order to receive also several results at conditions maximal close to the exploitation ones
an autoclave system is used for some of the electrochemical and corrosion measurements.
The autoclave volume is approximately 1,5L and its maximum capacity is to work at
temperatures of 350
o
C and pressures of 150 atm. Aiming better safety the experiments are
Corrosion Monitoring of the Steam
Generators of V-th and VI-th Energy Blocks of Nuclear Power Plant “Kozloduy”
241
carried out in the interval of about 220 - 230
o
C and pressure of 150 atm. Three-electrode
electrochemical Teflon cell with working volume of 300 cm
3
and Ag/AgCl reference
electrode assembly is mounted in the autoclave unit. The polarization studies in that case
are carried out in a potentiostatic way contrary to the anodic and cathodic polarization
curves realized at the abovementioned temperatures and at atmospheric pressure.
2.3.2 Scanning electron microscopy
SEM images and EDX analysis complete the results of the investigation giving more
information about the surface morphology of the tested samples and of the collected CPs. A
scanning electron microscope JEOL JSM-5300, Japan (equipped with EDX device) is used for
registration of the morphology changes on the sample surfaces of HAS after the treatment in
the medium. This device is used also for quantitative analysis of the element composition in
selected special places – pits, cracks etc. The results obtained by this method ensure the
possibility to present more realistic prognosis about the future exploitation of the SGs.
2.3.3 Moessbauer spectroscopy
Moessbauer spectroscopy completes phase analysis of the chemical compounds for
characterization of the type and quantity of the iron compounds presenting on the sample.
This method is based on the high sensitivity of Fe in relation to the resonance adsorption
toward the beams of the radiation source applied. In the present investigations the
absorption variant of the method is used which allows to receive information from the
whole thickness of the CPs. The separation of the phases is realized with high sensitivity
accepting that the whole amount of all compounds presenting is 100%. Actually,
Moessbayer spectra are carried out at room temperature using electromechanical
spectrometer working at conditions of a constant acceleration with a
57
Co/Cr source
(activity 60 mCi) and -Fe probe as a standard. Experimentally obtained spectrum is
additionally calculated using a special program based on the method of the least squares.
The content of iron ions in every component is determined under the conditions of the
presumption of identical Moessbayer-Lamb factor.
2.3.4 X-ray photoelectron spectroscopy
XPS analysis is carried out with ESCALAB MkII (VG Scientific) electron spectrometer
characterizing with base pressure in the chamber up to 5 x 10
-10
mbar (during the test 1 x 10
-8
mbar) with MgK X-ray source (excitation energy h = 1253,6 eV).
Due to the weak signals for Ni2p and Cr2p as well as the presence of a broadly expressed
Fe2p line an accelerating energy value of 50 eV and a sighthole with 6 mm width
(entry/exit) is used. Instrumental resolution measured as full width at a half maximum
(FWHM) of the photo electron peak of Ag3d
5/2
is lower than 1 eV. The binding energy scale
is corrected to the maximal C1s peak at 285 eV for electrostatic charge. The spectra obtained
are additionally analyzed using symmetric fitting Gauss-Lorenz curve after eliminating the
background accordingly to the requirements of the method of Shirley.
3. Results and discussion
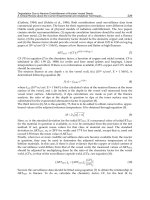
3.1 Potentiodynamic polarization investigations
3.1.1 Potentiodynamic investigations of low-alloyed steel (LAS)
The results for the corrosion behavior of LAS at 35
o
C are demonstrated in Figure 1 and are
used to characterize this steel and as a benchmark for comparison with high-alloyed steel.
Nuclear Power – Control, Reliability and Human Factors
242
-600 -300 0 300
10
-7
10
-6
10
-5
10
-4
10
-3
10
-2
2
2
1
I, A/cm
2
E, mV (SCE)
1
Fig. 1. PD polarization curves of LAS at 35
o
C in:
1 – MCM; 2 – MCM with addition of 10 μg/L Cl
-
.
It can be registered that even at low concentration of the added corrosion activators - Cl
-
ions (10 μg/L), curve 2 - their unfavourable influence is well expressed. As seen from the
results the corrosion potential value (E
corr
) of the tested steel sample is strongly shifted in
negative direction in that case with about 170 mV compared to the same parameter in the
initial MCM (curve 1). Accordingly to this observation and as could be expected, the
corrosion current density (i
corr
) and the rate of the active anodic dissolution in the presence
of chloride ions are about 2-3 times higher leading to accelerated damaging processes
(greater anodic dissolution) under the conditions of external polarization.
-600 -300 0 300
10
-9
10
-8
10
-7
10
-6
10
-5
10
-4
10
-3
10
-2
3
3
2
2
1
1
I, A/cm
2
E, mV (SCE)
Fig. 2. PD polarization curves of LAS at 35
o
C in:
1 – MCM with 300 μg/L Cl
-
; 2 – MCM with 300 μg/L Cl
-
and 2 mg/L MEA;
3 – MCM with 1 mg/L Cl
-
and 2 mg/L MEA.
Corrosion Monitoring of the Steam
Generators of V-th and VI-th Energy Blocks of Nuclear Power Plant “Kozloduy”
243
-600 -300 0 300
10
-7
10
-6
10
-5
10
-4
10
-3
10
-2
3
3
2
2
1
1
I, A/cm
2
E, mV (SCE)
Fig. 3. PD polarization curves of LAS at 35
o
C in:
1 – MCM; 2 – MCM with 300 μg/L SO
4
2-
;
3 – MCM with 300 μg/L SO
4
2-
and 2 mg/L MEA.
Further increasing of the Cl
-
ions concentration up to 300 μg/L (Figure 2, curve 1) results in
another potential shift in the negative direction with about 200 - 230 mV compared to the
case in MCM without addition of activators (Figure 1, curve 1) and with about 70 mV
compared to case with the lower Cl- concentration (Figure 1, curve 2). Corrosion current
density value also increases especially in the potential range between -300 and 0 mV (SCE).
The addition of MEA even at not very high concentration (that could be applied in the
practice) plays definitely a positive role – curve 2 – leading to lower corrosion and anodic
current density values and fixing the further shifting of the corrosion potential. Even at very
high concentration of corrosion activators (1 mg/L chloride ions – Figure 2, curve 3) the
presence of the added corrosion inhibitor MEA decrease partially the cathodic (oxygen
reduction) and also the anodic (metal dissolution) reactions demonstrating lower corrosion
current - i
corr
– values and ensuring better protection against corrosion.
Similar effect of MEA is observed also in the case when sulphate ions are used as corrosion
activators in the same model medium and at the same experimental conditions (Fig. 3). The
corrosion potential is shifted with about 220-230 mV in negative direction (curve 2) and i
corr
increases about 4 – 5 times. After the addition of MEA the anodic dissolution rate is slowed
down (curve 3) which demonstrates the positive influence of this compound. That result
leads also to the conclusion that the protecting mechanism of MEA is most probably similar
in aggressive media with different corrosion activators.
It is very important for the practice to register and estimate the effects also in the case when
some of the most dangerous corrosion activators (Cl
-
, SO
4
2-
and Cu
total
) simultaneously
present in the medium at their extreme high concentrations.
The results obtained for LAS treated in this type of model solution are demonstrated in Fig.
4. It is evident that E
corr
is strongly shifted in negative direction again and the corrosion
current density values are very high which can be expected at these conditions. Also at these
Nuclear Power – Control, Reliability and Human Factors
244
extremely aggressive medium the addition of MEA decreases the i
corr
and the dissolution in
the whole anodic region. The reason for this positive result is that the influence of MEA
simultaneously slow down the cathodic (reduction of depolarizer) and the anodic
(dissolution of the metal) reaction rates. It can be supposed from these observations that the
used compound MEA is an inhibitor of a “mixed” type.
-600 -300 0 300
10
-8
10
-7
10
-6
10
-5
10
-4
10
-3
10
-2
2
1
I, A/cm
2
E, mV (SCE)
1
2
Fig. 4. PD polarization curves of LAS at 35
o
C in:
1 – MCM with 1 mg/L Cl
-
, 1 mg/L SO
4
2-
and 5 μg/L Cu
total
;
2 – MCM with 1 mg/L Cl
-
, 1 mg/L SO
4
2-
, 5 μg/L Cu
total
and 2 mg/L MEA.
The potentiostatic studies in the autoclave realized in MCM containing chloride ions show a
slight shift of the corrosion potential in cathodic direction and about 3,5 times increase of the
corrosion current density value for this steel type.
3.1.2 Potentiodynamic investigations of high-alloyed steel (HAS)
The results obtained for HAS which is practically used in the steam generators are
demonstrated in Figure 5. It can be observed that low Cl
-
ions concentration in the model
medium (10 μg/L) – curve 2 - increases significantly (about 4-5 times) the corrosion rate.
Additionally, well expressed shift of E
corr
in negative direction of about 300 mV can be
registered. Nevertheless, compared to the case of LAS (see Figures 1 and 3, curves 1) i
corr
is
about 5 – 6 times lower at these conditions. The registered differences are attributed to the
better protective influence of the alloying components presenting in HAS. The addition of
MEA (curve 3) expresses strong favourable effect leading to the shifting of E
corr
in positive
direction with about 350 mV while i
corr
decreases about 4 times compared to the case of
MCM with addition of Cl
-
, but without MEA (compare curves 2 and 3).
Similar is the influence of MEA also in the case when SO
4
2-
ions present as activators at
equal concentrations in the model medium (Figure 6). As can be registered sulphate ions
extremely increase the corrosion current density but the addition of MEA leads to inhibiting
of the corrosion and anodic processes.
Corrosion Monitoring of the Steam
Generators of V-th and VI-th Energy Blocks of Nuclear Power Plant “Kozloduy”
245
-600 -300 0 300 600
10
-7
10
-6
10
-5
10
-4
10
-3
3
3
2
2
1
I, A/cm
2
E, mV (SCE)
1
Fig. 5. PD polarization curves of HAS at 35
o
C in:
1 – MCM; 2 – MCM with 10 μg/L Cl
-
;
3 – MCM with 10 μg/L Cl
-
and 2 mg/L MEA.
-600 -300 0 300 600
10
-8
10
-7
10
-6
10
-5
10
-4
10
-3
1
3
2
I, A/cm
2
E, mV (SCE)
2
3
1
Fig. 6. PD polarization curves of HAS at 35
o
C in:
1 – MCM; 2 – MCM with 300 μg/L SO
4
2-
;
3 – MCM with 300 μg/L SO
4
2-
and 2 mg/L MEA.
Nuclear Power – Control, Reliability and Human Factors
246
-600 -300 0 300 600
10
-8
10
-7
10
-6
10
-5
10
-4
10
-3
2
2
1
1
I, A/cm
2
E, mV (SCE)
Fig. 7. PD polarization curves of HAS at 35
o
C in:
1 – MCM with 1 mg/L Cl
-
, 1 mg/L SO
4
2-
and 5 μg/L Cu
total
;
2 – MCM with 1 mg/L Cl
-
, 1 mg/L SO
4
2-
, 5 μg/L Cu
total
and 2 mg/L MEA.
In the case, when the combination of the most dangerous activators (Cl
-
, SO
4
2-
and Cu
total
) is
applied in MCM the corrosion activity is also very strong demonstrated - Figure 7. It is
evident from the figure that the corrosion rate in that case is much greater and the corrosion
potential is additionally shifted to the negative direction up to the value of about -410 mV.
Nevertheless, the inhibiting effect of MEA is also very strong (curve 2) - the corrosion
potential is placed in positive direction, i
corr
value is more than 10 times lower and the
anodic dissolution seems to be partially hampered. The latter can be explained with the
process of the effective inhibitor adsorption exactly on the active anodic zones on the metal
surface. Finally, it could be prognosticated that MEA will slow down the corrosion
processes also at exploitation conditions in the case when the three activators
simultaneously present in their extreme high for the practice concentrations.
The potentiostatic investigations in the autoclave show more clearly expressed shift of the
corrosion potential in cathodic direction with about 100 mV and about 4 times increase of
the corrosion current density value for this steel. Despite of these results the new data
obtained from this test are much lower compared to the case of LAS.
3.1.3 Potentiodynamic investigations of HAS in cracks
As a result of the operating conditions and WCR the equipment in NPP and in particular the
SGs can be effective damaged by large number of cracks, holes, slits etc. This is a specific
type of local corrosion and these dangerous places strongly differ in their morphology and
element content compared to the whole surface of the unit. For example, in the case of
newly appeared cracks the electrochemical potentials in and outside can be extremely
different which will lead to appearance of galvanic macro-elements with own electromotive
force. It is very important to know that local corrosion phenomena can appear not only in
the already existing constructive slits. During the exploitation new cracks can occur
especially in the cases where different materials or media are in contact or as a result of
simultaneous action of electrochemical and mechanical forces.
Corrosion Monitoring of the Steam
Generators of V-th and VI-th Energy Blocks of Nuclear Power Plant “Kozloduy”
247
-0.3 -0.2 -0.1 0.0 0.1 0.2 0.3
10
-9
10
-8
10
-7
10
-6
10
-5
10
-4
10
-3
10
-2
10
-1
4
4
3
3
2
2
1
I, A/cm
2
E, V (SCE)
1
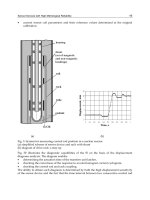
Fig. 8. PD curves of HAS in MCM with 1 mg/L Cl
-
, 1 mg/L SO
4
2-
and 5 μg/L Cu
total
:
1 – in crack 0,5 mm at 35
o
С; 3 - in crack 0,1 mm at 35
o
С;
2 - in crack 0,5 mm at 95
o
С; 4 - in crack 0,1 mm at 95
o
С.
It such a case it is very important to know the current density value into the crack that can
be mould out of a specially constructed for this case electrode. It allows simulating the
corrosion processes in cracks with different preliminary fixed widths. The present
investigations are realized using two artificially constructed widths (sizes of 0,1 and 0,5 mm
respectively). For practical purpose the special electrode has being filled in with the
experimental solutions (with or without addition of corrosion activators) directly before the
beginning of the test aimed to eliminate possible diffusion limitations.
The polarization investigations presented here (Fig. 8 and Fig. 9) are carried out in MCM
containing the extreme high concentrations of the corrosion activators – 1 mg/l Cl
-
, 1 mg/l
SO
4
2-
and 5 μg/l Cu
total
– with and without addition of MEA, respectively. Comparing the
characteristic parameter E
corr
following can be summarized – Fig. 8:
- at 35
o
С Е
corr
for the narrower crack (0,1 mm – curve 3) is strongly replaced in negative
direction with about 100 mV compared to the wider one (0,5 mm - curve 1) as a result of
the reasons described above;
- at 95
o
С Е
corr
of both samples are relative closer – compare curves 2 and 4.
The oscillations of the curves are most probably on account of the inhibition of the processes
of access and taking away the oxygen into the depth of the crack. In the anodic region the
current density values are higher in the case of the narrower crack which means that the
processes of dissolution are strongly expressed.
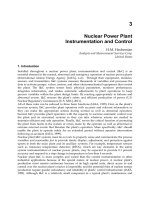
The addition of MEA in concentration of 2 mg/l shows favourable effect – Е
corr
shifts in
positive direction for all investigated samples (compare Figures 8 and 9). Additionally, the
observed i
corr
values are also lower at both temperatures and crack widths – Fig. 9 – which is
a sign for inhibiting of the corrosion processes. The electrochemical behavior of the steel in
the narrow cracks and holes characterizes with some peculiarities mainly as a result of the
transportation difficulties – inhibited access of the corrosive and passivating agents and
difficult take away of CPs from these places. In neutral medium Fe shows increased rate of
the anodic process and decreased – of the cathodic one. The lower oxygen concentration in
Nuclear Power – Control, Reliability and Human Factors
248
the cracks leads to more negative potentials of iron ionization with predominantly
formation of bi-valence ions and their compounds the latter in general possessing
insufficient protective properties.
-0.2 -0.1 0.0 0.1 0.2 0.3
10
-9
10
-8
10
-7
10
-6
10
-5
10
-4
10
-3
10
-2
10
-1
3
3
4
4
2
2
1
I, A/cm
2
E, V (SCE)
1
Fig. 9. PD curves of HAS in MCM with 1 mg/L Cl
-
, 1 mg/L SO
4
2-
, 5 μg/L Cu
total
and 2 mg/L
MEA:
1 – in crack 0,5 mm at 35
o
С; 3 - in crack 0,1 mm at 35
o
С;
2 - in crack 0,5 mm at 95
o
С; 4 - in crack 0,1 mm at 95
o
С.
The passive state of the metals owed mainly to the presence of oxygen may be affected by
inhibited access of this component leading to depassivating and accelerating of the anodic
reaction. Additionally, the cathodic reduction of the depolarizer becomes slowly, Е
corr
and PD
curves shift to negative direction. The reason for this effect is the fact that the electrolyte
situated in the cracks does not intermix convectively any more and the oxygen transportation
occurs only by molecular diffusion. The inhibited refreshing of the electrolyte leads to relative
fast change of the pH value of the medium in these places compared to the surface outside the
cracks. The composition of the electrolyte in these close volumes also changes during the
exploitation process and as result oxides, hydroxides etc. accumulate on the surface. Their
concentration depends in general on the product of solubility value of the CPs. The main
changes of the corrosion medium in the cracks appear as a result of the macro-element activity
between these places and the “bare surface”. The metal inside the cracks works as an anode
and after incubation period during which the current of the galvanic element is very low the
“inner” electrolyte becomes more acidic that leads to beginning of depassivation process.
After prolonged exploitation of the equipment the corrosion damages in the cracks become
extremely dangerous due to the fact that the appearance of the passive state of the steels is
ensured mainly from the oxygen in the medium. The permanent lack of this element into the
deep volume of the cracks leads to depassivating of different places and acceleration of local
corrosion processes. These results confirm that the modelling (although approximately) of
the exploitation conditions is useful and necessary in order to receive experimental data for
dangerous corrosion phenomena and their detrimental influence as well as to give the
opportunity to prognosticate them.
Corrosion Monitoring of the Steam
Generators of V-th and VI-th Energy Blocks of Nuclear Power Plant “Kozloduy”
249
3.2 SEM and EDX investigations
3.2.1 SEM investigations
Steel samples are initially placed in the special electrode for investigation of the corrosion
processes in cracks with different widths. Thereafter the same electrode is putted in an
autoclave and leaved at Е
corr
in MCM containing the extreme high concentrations of
chloride, sulphate and copper ions. One 24 hours-cycle test consists of 4 hours stay at the
operating conditions (selected temperature and pressure) followed by 20 hours for
equalizing with the room temperature (slow cooling process). The SEM images of HAS
samples are presented in Fig. 10(A,B). The results are obtained after preliminary preparation
of the corrosion treated steel samples – rinsing with distilled water and drying with hot air.
Figure 10A shows typical corrosion damages of HAS samples placed in the electrode with
0,5 mm width after 3 cycles of the corrosion treatment described above. It can be registered
that after the treatment a damaged place appears on the surface. Much hardly attacked
seems to be the sample simulating the crack with 0,1 mm width – Fig. 10B. The reasons for
this result are most probably the lower oxygen concentration in the solution. Additional risk
is the accumulation of loose corrosion products in which mass the activators concentration
will be greater.
Fig. 10. SEM images of steel morphology after corrosion treatment of HAS samples:
A – in simulated crack with 0,5 mm width; B – in simulated crack with 0,1 mm width.
3.2.2 EDX investigations
The method gives the opportunity to determine the element composition in selected places
on the steel surface characterized with different phenomena and processes - local holes,
cracks etc. appeared after ruptures of the passive film. It is well known that after a definite
time period the passive film in or over the crack or pitting can be totally destroyed and as a
result open pits take shape. The average results from the analysis inside selected separate
pits registered on the surface of the sample placed in the special electrode for investigation
of the corrosion processes in the cracks and tested in MCM are presented in Table 1.
The main differences in the composition of the pits registered with and without MEA refer
to the alloying components – Cr and Ni – both latter demonstrating higher percentages in
the case with MEA. This is a clear positive effect since higher Ni and Cr amounts inhibit the
penetration of the corrosion processes into the depth. The higher amount of iron detected
when MEA present in MCM means that the dissolution of this metal is slowly.
Nuclear Power – Control, Reliability and Human Factors
250
Element
Content
(
in wt.%
)
after treatment in MCM
without MEA with МЕА
Fe 63,6 66,3
Cr 15,7 18,7
C 9,9 3,8
Ni 8,5 10,0
Si 1,9 0,8
Ti 0,4 0,4
Table 1. EDX analysis in selected pits and influence of MEA
3.2.3 SEM investigations of CPs
As already presented above the presence of MEA in the exploitation (or model) medium
plays a positive role concerning the corrosion processes leading to their inhibiting. This
compound can influence the appearance and development of the corrosion damages
especially in places with limited oxygen access. The looseness, adhesion and the average
size of the CPs particles are also of great importance in that case.
In the steam generators the corrosion products deposit on the body, pipe bundles, distance
grids, bottom etc. and have in general sizes between 1 and 10 μm. On some places a compact
film with good adhesion and low solubility consisting mainly of magnetite (Fe
3
O
4
) can
appear. Additionally, a loose mass of new porous and with bad adhesion layers accumulate
on it. As a result a strong increase of the local concentrations of Cl
-
,
SO
4
2-
and Cu
total
ions
occur which leads to depassivation and appearance of pits on several places. In that sense
some changes in the WCR leading to CPs with high dispersion are desirable aiming the
easier removing of the particles from that zones.
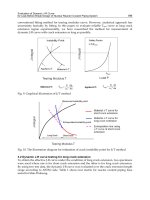
The addition of MEA results in obtaining of CPs with high dispersion having average
particle sizes less than 1 μm. Positive sign is also the fact that MEA do not lead to changes in
the element and phase composition of CP. These effects are presented in Fig. 11.
Fig. 11. SEM images of corrosion products:
A – without MEA in the medium; B – in the presence of 2 mg/l MEA.
3.3 Moessbauer investigations
The Moessbauer analysis (Fig. 12) of the surface film of corrosion products collected from
characteristic places from the inner volume of the SGs during the shut-down procedure
Corrosion Monitoring of the Steam
Generators of V-th and VI-th Energy Blocks of Nuclear Power Plant “Kozloduy”
251
show that the film consists of magnetite - Fe
3
O
4
- and alpha-hematite - – Fe
2
O
3
. As well
known, these compounds are low soluble and highly resistive oxides, even in aggressive
corrosion medium. This fact suggests that the corrosion products on the bundle surfaces
may form a layer with high protective properties the latter impeding the penetration of the
destructive corrosion processes in the depth of the metal tubes. The obtained average results
are presented in Table 2.
Components Weight %
Sxt 1 - Hematite, – Fe
2
O
3
Sxt 2 - Magnetite – tetra, Fe
3
O
4
Sxt 3 - Magnetite - octa, Fe
3
O
4
62
15
23
Table 2. Results from Moessbauer investigations
The experimental Moessbauer spectra include two types of components:
- components without super fine magnetic structure – quadruple doublets
- components with expressed super fine magnetic structure – sextets
In the present case the models for computer calculating of the Moessbauer spectra include
only sextets (three sextet components). The values of the determined parameters of the six-
component lines in the spectra (marked as Sxt 1, Sxt 2 and Sxt 3 in Table 2) can be attributed
to the presence of iron-oxide phases – –hematite (Sxt 1) and magnetite (Sxt 2 and Sxt 3).
These two phases characterize with well expressed super fine magnetic structure (sextet
components).
-12 -10 -8 -6 -4 -2 0 2 4 6 8 10 12
94
95
96
97
98
99
100
Relative transmission, %
Velocity, mm/s
Fig. 12. Moessbauer spectra of CPs taken from SGs (average results)
The registered parameters for Sxt 1 demonstrate that all iron ions exist in the third oxidized
state and octahedral surrounding. The appearance of two components of the magnetic
phase, Sxt 2 and Sxt 3, is due to the existence of Fe in the third oxidized state and in
tetrahedral surrounding. This is the reason for the presence of Sxt 2 in the spectrum as well
as to a spectral appearance of iron ions with interstitial oxidized state (Fe
2.5+
) in octahedral
Nuclear Power – Control, Reliability and Human Factors
252
position (its spectral expression is Sxt 3). As well known, magnetite is one of the widely
distributed mixed valence compound with high frequency electron exchange between the
ions 3d
6
Fe
2+
↔ 3d
5
Fe
3+
. Magnetite characterizes with cubic symmetry and the results
demonstrate that it is with low degree of non-stoichiometry - Fe
3
O
4-х
, while the vacancies are
localized most probably in the octahedral places.
3.4 XPS investigations
The results described below are related to powder CPs selected from different places in the
volume of the SGs during the shut-down procedure. The data presented in Table 3 are
summarized for all test samples.
Element O 1s Fe 2p Cu 2p Cr 2p Ni 2p
Binding energy, eV
(main peaks)
529,9
531,2
711,1
932,9
934,5
576,8 855,2
Percentage, at.% 76 8 14 1 1
Table 3. Results from XPS investigations of CPs taken from the inner volume of SGs
(average results from all investigated samples)
528 530 532 534
Intensity, cps
Binding energy, eV
O 1s
Fig. 13. XPS measurements for O1s from the CPs of the SGs (average results)
The XRD spectra obtained for different registered elements are presented with more
details in the Figures 13 – 17. In general, these experimental results are in correlation with
the Moessbauer investigations and also in fair agreement with the conclusions from the
potentiodynamic polarization curves and SEM images. The presence of Cu is not a desired
event since it could lead to local corrosion damages being more cathodic compared to
iron.
As can be observed the main element with the highest content (in atomic percent) is oxygen
followed by copper and iron as well as by much smaller amounts of Cr and Ni. In such a
case it could be expected that the compounds on the surface will be mainly iron, copper or
iron-copper oxides and hydroxides. The very low amounts of chromium and nickel
compounds clearly demonstrate that their participation in the occurred corrosion processes
is weaker expressed.
Corrosion Monitoring of the Steam
Generators of V-th and VI-th Energy Blocks of Nuclear Power Plant “Kozloduy”
253
708 710 712 714 716
Intensity, cps
Binding energy, eV
Fe 2p
Fig. 14. XPS measurements for Fe2p from the CPs of the SGs (average results)
Element Bindin
g
ener
gy
E, eV/
(
at.%
)
Possible com
p
ounds
O 1s
530,1 / (56,3)
531,6 / (37,0)
533,2 /
(
6,7
)
Fe
2
O
3
; FeO; CuO
FeOOH; Cu(OH)
2
H
2
O
Cu 2p
932,8 / (57,0)
934,4 /
(
43,0
)
Cu
2
O; Cu.
CuO; Cu
(
OH
)
2
; CuCr
2
O
4
Table 4. Results after mathematical deconvolution of XPS investigations of CPs
However, the iron content is not very high which means that the used construction is to a
definite degree protected at these conditions. The alloying elements nickel and chromium
which are also registered during the investigations show practically their positive influence
for the increased corrosion resistance of the used alloy.
930 932 934 936 938
Intensity, cps
Binding energy, eV
Cu 2p
Fig. 15. XPS measurements for Cu2p from the CPs of the SGs (average results)
Aimed to receive clear results the XPS spectra obtained are additionally mathematically
calculated using a special software aimed to determine also another peaks of possible