Aeronautics and Astronautics Part 11 potx
Bạn đang xem bản rút gọn của tài liệu. Xem và tải ngay bản đầy đủ của tài liệu tại đây (3.29 MB, 40 trang )
O
2
/CH
4
Kinetic Mechanisms for Aerospace Applications at
Low Pressure and Temperature, Validity Ranges and Comparison
389
M
echanisms
Reactants Temperature
32species
177reactions
17species
58reactions
6species
2reactions
4species
1reactio
n
5species
2reactions
1000 41.13% 95.32% 17.53% 59.31%
1100 19.85% 94.66% 46.47% 72.87%
1200 0.43% 94.81% 56.65% 78.11%
1300 -14.90% 93.34% 58.80% 79.40%
1400 -14.93% -8009.45% 93.83% 60.05% 79.90%
1500 -28.68% -4812.84% 95.28% 53.09% 76.55%
1600 -19.76% -2839.52% 93.35% 50.81% 75.56%
1700 -19.61% -1958.82% 93.17% 45.39% 73.53%
1800 -20.25% -1444.89% 90.21% 40.29% 70.15%
1900 -19.92% -1127.09% 88.09% 38.25% 69.28%
2000 -20.28% -913.99% 85.87% 37.83% 69.37%
Table A10. P=3atm, Φ=1.9: t
id
% differences between reduced and reference mechanisms
M
echanisms
Reactants Temperature
32species
177reactions
17species
58reactions
6species
2reactions
4species
1reactio
n
5species
2reactions
1000 23.60% -3020.00%
1100 -0.43% -652.14%
1200 -13.69% -225.82%
1300 -20.00% -87.65%
1400 -17.47% -39.45%
1500 -13.16% -7838.60% -32.02%
1600 -9.90% -3919.80% -49.50%
1700 -8.67% -2115.80% -71.10%
1800 -9.24% -1236.63% -87.46%
1900 -10.89% -746.53% -89.60%
2000 -13.64% -452.60% -75.32%
Table A11. P=5atm, Φ=0.3: t
id
% differences between reduced and reference mechanisms
M
echanisms
Reactants Temperature
32species
177reactions
17species
58reactions
6species
2reactions
4species
1reactio
n
5species
2reactions
1000 23.13% -80.60%
1100 0.73% -9.85%
1200 -15.98% 20.53%
1300 -19.12% 40.20%
1400 -20.15% 55.47%
1500 -16.86% -7664.71% 62.31%
1600 -16.04% -4098.11% 61.60%
1700 -10.71% -2360.32% 57.14%
1800 -9.54% -1518.32% 50.00%
1900 -10.88% -1063.27% 41.63%
2000 -9.07% -780.18% 34.15%
Table A12. P=5atm, Φ=0.5: t
id
% differences between reduced and reference mechanisms
Aeronautics and Astronautics
390
M
echanisms
Reactants Temperature
32species
177reactions
17species
58reactions
6species
2reactions
4species
1reactio
n
5species
2reactions
1000 26.80% 60.13%
1100 0.31% 63.35%
1200 -10.16% 72.91%
1300 -16.94% 73.97%
1400 -30.08% 79.95%
1500 -20.00% -7198.25% 85.79%
1600 -17.54% -4022.81% 80.70%
1700 -13.42% -2357.47% 79.21%
1800 -12.88% -1574.24% 75.49%
1900 -12.41% -1127.59% 71.24%
2000 -9.79% -836.64% 67.28%
Table A13. P=5atm, Φ=0.7: t
id
% differences between reduced and reference mechanisms
M
echanisms
Reactants Temperature
32species
177reactions
17species
58reactions
6species
2reactions
4species
1reactio
n
5species
2reactions
1000 29.65% 82.33%
1100 8.29% 83.12%
1200 -10.51% 86.89%
1300 -18.38% 84.60%
1400 -16.25% 86.00%
1500 -20.89% -6703.80% 87.85%
1600 -17.89% -3859.35% 87.97%
1700 -15.68% -2332.43% 87.19%
1800 -14.34% -1576.47% 85.00%
1900 -14.38% -1153.42% 82.19%
2000 -15.90% -892.88% 79.12%
Table A14. P=5atm, Φ=0.9: t
id
% differences between reduced and reference mechanisms
M
echanisms
Reactants Temperature
32species
177reactions
17species
58reactions
6species
2reactions
4species
1reactio
n
5species
2reactions
1000 29.07% 86.34%
1100 8.12% 86.52%
1200 -3.87% 86.66%
1300 -20.92% 87.16% 37.23%
1400 -21.61% 88.27% 44.63%
1500 -21.45% -6486.10% 89.73% 39.58%
1600 -16.03% -3678.63% 90.31%
1700 -16.29% -2299.30% 89.47% 33.45%
1800 -16.00% -1580.00% 87.60% 30.55%
1900 -15.65% -1158.50% 85.24% 30.61%
2000 -14.63% -884.90% 82.93%
Table A15. P=5atm, Φ=1.0: t
id
% differences between reduced and reference mechanisms
O
2
/CH
4
Kinetic Mechanisms for Aerospace Applications at
Low Pressure and Temperature, Validity Ranges and Comparison
391
M
echanisms
Reactants Temperature
32species
177reactions
17species
58reactions
6species
2reactions
4species
1reactio
n
5species
2reactions
1000 32.97% 93.46% -53.85% 27.47%
1100 9.95% 89.85% 5.22% 52.74%
1200 -9.80% 88.92% 30.29% 68.92%
1300 -16.94% 91.33% 38.21% 69.83%
1400 -21.03% 95.11% 43.59% 73.95%
1500 -23.10% -6332.75% 90.99% 38.30% 69.88%
1600 -21.97% -3695.45% 91.21% 34.70% 69.09%
1700 -10.48% -2288.32% 91.07% 31.10% 65.46%
1800 -16.79% -1571.43% 89.57% 28.21% 63.93%
1900 4.03% -1155.03% 87.65% 27.52% 64.23%
2000 -17.87% -915.38% 85.09% 26.86% 62.72%
Table A16. P=5atm, Φ=1.1: t
id
% differences between reduced and reference mechanisms
M
echanisms
Reactants Temperature
32species
177reactions
17species
58reactions
6species
2reactions
4species
1reactio
n
5species
2reactions
1000 34.65% 93.37% -51.49% 25.25%
1100 11.14% 92.95% 4.55% 51.82%
1200 -8.04% 92.58% 27.95% 63.84%
1300 -18.60% 92.50% 37.80% 69.21%
1400 -28.43% 92.53% 40.29% 69.71%
1500 -14.56% -5964.69% 93.34% 37.47% 69.27%
1600 8.45% -3505.63% 93.66% 33.03% 67.46%
1700 -17.65% -2220.26% 93.28% 31.05% 63.89%
1800 -17.99% -1553.98% 92.18% 22.49% 61.59%
1900 -17.88% -1164.90% 90.40% 20.53% 60.40%
2000 -16.97% -905.73% 89.12% 21.22% 62.04%
Table A17. P=5atm, Φ=1.3: t
id
% differences between reduced and reference mechanisms
M
echanisms
Reactants Temperature
32species
177reactions
17species
58reactions
6species
2reactions
4species
1reactio
n
5species
2reactions
1000 33.33% 95.12% -55.40% 24.41%
1100 10.81% 95.49% 4.24% 53.18%
1200 -6.56% 97.86% 30.66% 65.98%
1300 -19.32% 94.18% 36.93% 68.18%
1400 -25.89% 97.54% 38.21% 71.96%
1500 -25.58% -5731.20% 94.42% 35.29% 68.29%
1600 -39.69% -3884.73% 96.45% 20.61% 61.37%
1700 -23.43% -2227.45% 94.56% 23.92% 61.48%
1800 -19.80% -1537.58% 93.83% 18.46% 59.40%
1900 -19.48% -1166.23% 92.47% 14.94% 58.12%
2000 -18.59% -920.52% 91.61% 14.37% 58.15%
Table A18. P=5atm, Φ=1.5: t
id
% differences between reduced and reference mechanisms
Aeronautics and Astronautics
392
M
echanisms
Reactants Temperature
32species
177reactions
17species
58reactions
6species
2reactions
4species
1reactio
n
5species
2reactions
1000 34.76% 96.42% -50.64% 90.60%
1100 12.30% 96.11% 4.30% 52.93%
1200 0.00% 95.83% 30.83% 68.33%
1300 -17.59% 95.54% 36.75% 68.77%
1400 -23.77% 95.48% 41.48% 74.02%
1500 -24.41% -5397.63% 95.64% 46.45% 68.25%
1600 -21.25% -3218.75% 95.80% 29.38% 66.06%
1700 -21.65% -2110.53% 95.58% 22.71% 60.90%
1800 -21.10% -1510.39% 95.00% 13.96% 57.47%
1900 -20.13% -1151.57% 93.91% 10.06% 55.66%
2000 -19.73% -911.09% 93.28% 9.09% 55.21%
Table A19. P=5atm, Φ=1.7: t
id
% differences between reduced and reference mechanisms
M
echanisms
Reactants Temperature
32species
177reactions
17species
58reactions
6species
2reactions
4species
1reactio
n
5species
2reactions
1000 34.68% 98.90% -53.63% 26.61%
1100 13.08% 97.77% 5.16% 53.22%
1200 -0.71% 98.01% 28.37% 64.18%
1300 -17.91% 96.99% 35.32% 68.66%
1400 -25.78% -9821.88% 97.76% 37.27% 69.06%
1500 -30.23% -5365.12% 96.98% 32.56% 66.28%
1600 -24.70% -3146.99% 97.99% 26.51% 63.73%
1700 -25.44% -2105.88% 96.16% 18.09% 58.82%
1800 -22.64% -1484.91% 95.75% 10.06% 55.66%
1900 -22.09% -1139.26% 95.11% 4.91% 53.68%
2000 -21.18% -913.10% 94.26% 2.95% 53.06%
Table A20. P=5atm, Φ=1.9: t
id
% differences between reduced and reference mechanisms
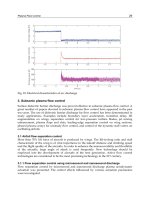
Fig. A1. Φ=0.3, P=3atm, temperature
O
2
/CH
4
Kinetic Mechanisms for Aerospace Applications at
Low Pressure and Temperature, Validity Ranges and Comparison
393
Fig. A2. Φ=0.5, P=3atm, temperature
Fig. A3. Φ=0.7, P=3atm, temperature
Fig. A4. Φ=0.9, P=3atm, temperature
Aeronautics and Astronautics
394
Fig. A5. Φ=1, P=3atm, temperature
Fig. A6. Φ=1.1, P=3atm, temperature
Fig. A7. Φ=1.3, P=3atm, temperature
O
2
/CH
4
Kinetic Mechanisms for Aerospace Applications at
Low Pressure and Temperature, Validity Ranges and Comparison
395
Fig. A8. Φ=1.5, P=3atm, temperature
Fig. A9. Φ=1.7, P=3atm, temperature
Fig. A10. Φ=1.9, P=3atm, temperature
Aeronautics and Astronautics
396
Fig. A11. Φ=0.3, P=5atm, temperature
Fig. A12. Φ=0.5, P=5atm, temperature
Fig. A13. Φ=0.7, P=5atm, temperature
O
2
/CH
4
Kinetic Mechanisms for Aerospace Applications at
Low Pressure and Temperature, Validity Ranges and Comparison
397
Fig. A14. Φ=0.9, P=5atm, temperature
Fig. A15. Φ=1, P=5atm, temperature
Fig. A16. Φ=1.1, P=5atm, temperature
Aeronautics and Astronautics
398
Fig. A17. Φ=1.3, P=5atm, temperature
Fig. A18. Φ=1.5, P=5atm, temperature
Fig. A19. Φ=1.7, P=5atm, temperature
O
2
/CH
4
Kinetic Mechanisms for Aerospace Applications at
Low Pressure and Temperature, Validity Ranges and Comparison
399
Fig. A20. Φ=1.9, P=5atm, temperature
8. References
Arione, L. (2010) “Development status of the LM10-MIRA engine for the LYRA Launch
Vehicle”, Proceedings of the “Space 2010” Conference, San Sebastian.
Bowman, C.T. (1986) Chemical Kinetics Models for Complex Reacting Flows, Ber.
Bunsenges. Phys. Chem. 90, 934.
Bruno, C. (2001) “Chemical Microthrusters: Effect of Scaling on Combustion”, AIAA Paper
2001-3711, AIAA JPC, Salt Lake City.
Bruno, C. (2003) Giacomazzi, E., Ingenito, A. Chemical Microrocket: Scaling and
Performance Enhancement, EOARD Contract FA8655-02-M034, SPC 02-4034 Final
report, London, UK.
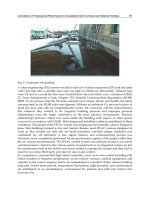
Cozzi, F. (2007) Experimental Analysis of a Swirl Flow in a meso-scale combustor by LDV,
XV A.I.VE.LA National Meeting, Milano, Italy.
Cozzi, F., Caratti, L. (2007) Temperature measurements by Spontaneous Raman Scattering in
a meso-scale combustor, XV A.I.VE.LA National Meeting, Milano, Italy.
Cozzi, F., Coghe, A., Olivani, A., Rogora, M. (2007): Stability and Combustion Efficiency of
a Meso-Scale Combustor Burning Different Hydrocarbon Fuels, 30th Meeting on
Combustion, Ischia, Naple, Italy.
Dagaut, P., Boettner, J-C., Cathonnet, M. (1991) Methane Oxidation: Experimental and
Kinetic Modeling Study, Combust. Sci. and Tech. 77, pp. 127-148.
DeGroot, W.A., and Oleson, S.R., (1996), "Chemical Microthruster Options", AIAA Paper 96-
2863, presented at the AIAA Joint Propulsion Conference, Buena Vista, FL.
Gardiner, W.C. Jr. (1999) Gas-Phase Combustion Chemistry, Springer-Verlag, pp. 31-41.
GRI-Mech Version 1.2 released 11/16/94,
GRI-Mech Version 3.0 released 07/30/99,
Hurlbert, E., Angstadt, T., Villemarette, M., Collins, J., Allred, J., Mahoney, J., Peters, T.,
(2008) 870 lbf Reaction control system test using Lox/Ethanol and LOx/Methane at
white sands test facility, AIAA 2008-5247, Hartford.
Heffington, W.M., Parks, G.W., Salzman, K.G.P., Penner, S.S. (1997) Studies of Methane
Oxidation Kinetics, 16
th
Symp. (Int.) Combust. [Proc.], 997.
Aeronautics and Astronautics
400
Hautman, D.J., Dryer, F.L., Shug, K.P., Glassman, I. (1981) A Multiple Step Overall Kinetics
Mechanism for the Oxydation of Hydrocarbon, Combust. Sci. Technol. 25, 219.
Kawashima, H., Okita, K., Aoki, K., Azuma, N., Kumawaka, A., Onodera, T., Yoshida, S.,
Negeshi, H., Manako, H., Koganezawa, T. (2009) “Combustion and regenerative
cooling characteristics of LOx/Methane engine”, Transactions of the Japan Society
for Aeronautical and Space Sciences, Space Technology Japan, Vol. 7, ists 26 (ISTS
Special Issue: Selected papers from the 26
th
International Symposium on Space
Technology and Science), pp Ta_7-Ta_11
Kee, R.J., Grcar, J.F., Smooke, M.D., Miller, J.A. (1985) A Fortran Program for Modeling
Steady Laminar One-Dimensional Premixed Flames, Report No. SAND85-8240,
Sandia National Laboratories.
Janson, S.W., (1994), "Chemical and Electric Micropropulsion Concepts for Nanosatellites",
AIAA paper 94-2998, presented at the AIAA Joint Propulsion Conference,
Indianapolis.
Minotti, A., Bruno, C., Cozzi, F. (2009) Numerical Simulation of a Micro Combustion
Chamber, AIAA Aerospace Science Meeting and Exhibit, Orlando, FL, AIAA-2009-
0447.
Mueller, J., (1997), "Thruster Options for Microspacecraft: A Review and Evaluation of
Existing Hardware and Emerging Technologies", AIAA Paper 97-3058, presented at
the AIAA Joint Propulsion Conference, Seattle, July 1997.
Paczko, G., Lefdal, P.M., Peters, N. (1988) Reduced Reaction Schemes for Methane,
Methanol and Propane Flames, 21
st
Symp. (Int.) Combust. [Proc.], 739.
Stone, R., Tiliakos, N., Balepin, V., Tsai, C Y., Engers, R. (2008) “Altitude testing of LOx-
Methane Rocket engine at ATK-GASL”, AIAA 2008-3701, Seattle.
Trevino, C., Mendez, F. (1992) Reduced Kinetic Mechanism for Methane Ignition, 24
TH
Symp. (Int.) on Combust., The Combust. Inst., pp.121-127
Westbrook, K. C., Dryer, L. F. (1981) Simplified reaction mechanism for the oxidation of
hydrocarbon fuels in flames, Combustion Science and Technology 27, pp. 31-43.
Part 3
Materials and Structures
14
Creep Behaviors and Influence
Factors of FGH95 Nickel-Base Superalloy
Tian Sugui
and Xie Jun
Shenyang University of Technology
China
1. Introduction
With the development of aerospace and ground transportation industry, the properties of
aerospace engine are increasingly required to be improved. And especially, Turbine disk
is one of the important component parts for advanced aero-engines, serving usually in the
condition of 540~840°C at higher stress, so the turbine disks are required to be of high
temperature tolerance and creep resistance (Flageolet B. et al., 2005; Liu D. M. et al.,
2006 ). Thereinto, the continuous plastic flow of a material during creep can eventually
result in large plastic deformations and significant modifications to the microstructure
of the material, so that occurs the creep fracture of the turbine disk parts. Therefore, it is
very important for the aero-engine materials to have a better property of the creep
resistance.
Traditional wrought superalloys can hardly meet the requirements of the turbine disks in
the advanced aerospace for their poor temperature tolerance and loading capacity resulted
from their serious composition segregation in ingots and poor hot processability (Park N. K.
& Kim I. S., 2001; Lherbier L. W. & Kent W. B., 1990; S. Terzi et al., 2008 ), especially the
weaker cohesive force of grain boundaries (Paul L., 1988; Wang P. et al., 2008; Jia CH. CH. et
al., 2006 ). While nickel based powder superalloys are an excellent material used for
preparing the high temperature rotating section of the advanced aero-engine because its
advantages are no macro-segregation in the ingot, chemical composition uniformity and
high yield strength (Lu Z. Z. et al., 2005; Zhou J. B. et al., 2002 ).
FGH95 alloy is a nickel-base powder superalloy in which microstructure consists of
matrix, and carbide phases. The characteristics of FGH95 superalloy include the high
extent of alloying and high volume fraction of -phase (about 50%), besides the alloy
possesses excellent integrating mechanical properties at 650°C (Domingue J. A., et al. 1980;
Hu B. F. et al., 2006 ). Moreover, various size, morphology and distribution of phase in the
alloy can be obtained by different heat treatment regimes (Zainul H. D., 2007 ). The
preparation technologies of FGH95 superalloy includes the powder pretreatment, hot
isostatic pressing (HIP) and heat treatment. The heat treatment regimes of the alloy include
the high temperature solution and twice aging treatment. After solution treated at high
temperature, the alloy may adopt the different cooling methods, such as cooled in molten
salt or in oil bath, and the microstructure and creep properties of the alloy are related to the
chosen heat treatment regimes (Klepser C. A., 1995 ).
Aeronautics and Astronautics
404
The deformation mechanism of the polycrystalline Ni-base superalloys during creep
includes twinning, dislocations by-passing or shearing into the phase (Raujol S. et al.,
2004 ; Kovarik L. et al., 2009 ). Actually, the mechanical properties and creep behaviors of
the alloy are related to the quantities, morphology and distribution of -phase, and
especially, the configuration of the boundary and carbides have an important effect on the
creep resistance of the alloy (Viswanathan G. B. et al., 2005; Hu B. F. et al., 2003 ). For
example, after the alloy is solution treated for cooling in molten salt, the total number and
size of secondary phase increase, which can effectively improve the plasticity of the alloy
at high temperature ( Zhang Y. W. et al., 2002 ). Because the various microstructures in the
alloy may be obtained by different heat treatment regimes, it is very important to
understand the influence of heat treatment regimes on the microstructure and creep
resistance of the alloy.
In this chapter, the different HIP alloys are solution treated at different temperatures, and
cooled in the molten salt or oil bath, respectively, then through twice aging treatment.
Besides, some full heat treated alloys are aged for different time at high temperatures, and
then the parameters of , phases in the alloy are measured for evaluating the effect of the
long term aging time on the misfits. The creep properties of the alloy treated by different
heat treated regimes are measured under the conditions of the applied different
temperatures and stresses, and the microstructures of the alloy are observed by using SEM
and TEM for investigating the influences of the heat treatment regimes on the
microstructure and creep properties. Additionally, the deformation mechanism and fracture
feature of the alloy during creep are briefly discussed.
2. Experimental procedure
FGH95 powder particles of the nickel-base superalloy with the size of about 150 meshes
were put into a stainless steel can for pre-treating at 1050 °C for 4 h. The can containing
FGH95 powder alloy was hot isostatic pressed (HIP) for 4 h under the applied stress of 120
MPa at 1120 °C, 1150 °C and 1180 °C, respectively. The heat treatment and long term aged
treatment regimes of the alloy are listed, respectively, in the Table 2.1 and Table 2.2. The
cooled rates of the specimen in the oil bath and molten salt are measured to be about 205
°C/min and 110 °C/min, respectively. The error ranges of the used heating furnace are
about ± 2 °C. The chemical composition of FGH95 superalloy is shown in Table 2.3.
HIP
Temp., (°C)
Solution
Temp., (°C)
Quenching
Temp., (°C)
Double aging treatment
1120
1140 for 1 h
1150 for 1 h
1160 for 1 h
1165 for 1 h
cooled for 15 min in molten salt at 583 °C
870 °C×1h + 650 °C×24h
1180
1150 for 1 h
1160 for 1 h
cooled for 15 min in oil bath at 120 °C
1150 for 1 h
1160 for 1 h
cooled for 15 min in molten salt at 583 °C
Table 2.1. Heat treatment regime of FGH95 superalloy
Creep Behaviors and Influence Factors of FGH95 Nickel-Base Superalloy
405
HIP Temp.,
(°C)
Heat treatment Aging regime
1120
1155 for 1 h + cooled for 15 min in molten salt at
550 °C + 870 °C×1h +650 °C×24 h
450 °C×500
h
450 °C×1000 h
550 °C×500 h
550 °C×1000 h
1150
1180
Table 2.2. Long time aging treated regime of FGH95 superalloy
C B Cr Co Al Ti W Mo Nb Ni
0.060 0.012 12.98 8.00 3.48 2.55 3.40 3.40 3.50 Bal
Table 2.3. Composition of FGH95 superalloy(mass fraction,%)
By means of the anode selective dissolving method, the volume fraction of -phase in
FGH95 alloy was measured to be about 47%. Thereinto, the electrolytic extraction of phase
in the alloy was conducted for separating from the matrix under the condition of the
temperature at 0°C and current density about 50mA/cm
2
. The choosing electrolyte solution
consisted of (NH4)
2
SO
4
and citric acid, the experimental device of the electrolytic extraction
was shown in Fig. 2.1. After the electrolytic extraction was conducted, the granularity
distribution, phases constituting and the misfit of , phases in the alloy were measured by
means of the XRD analysis and SEM/EDS observation.
The ingot of FGH95 superalloy was cut into the specimens with the cross-section of 4.5 mm
2.5 mm and the gauge length of 20 mm, and the size of the sample was shown in Fig. 2.2.
Uniaxial constant load tensile testing was performed, in a GWT504 model creep testing
machine, for measuring creep curves under the experimental conditions of 984 MPa ~ 1050
MPa and 630 °C ~ 670 °C. The yield strength of FGH95 alloy was measured to be 1110 MPa
at 650 °C. The strain data of the alloy at different conditions were measured with an
extensometer to portray the creep curves, twice of the each creep testing were conducted for
ensuring the statistical confidence. The specimens of FGH95 alloy at different states were
grinded and polished for observing the microstructure by using SEM and TEM, so that the
influence of the heat treatment technics on the microstructure, the creep feature and fracture
mechanism of the alloy was investigated.
Fig. 2.1. Experimental equipment
1 Power supply, 2 sample, 3 cathode, 4 solution, 5 container
V A
1
2
3
4
5
Aeronautics and Astronautics
406
Fig. 2.2. Schematic diagram of the tensile creep sample
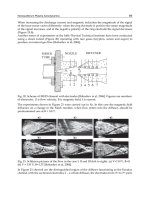
3. Influence of HIP temperatures on microstructure
3.1 Influence of HIP temperatures on microstructure of FGH95 alloys
After the alloy was hot isostatic pressed at different temperatures, the microstructure of the
HIP alloys was shown in Fig. 3.1. The regions which were encompassed by coarse phase
were defined as previous powder particles. After 1120 °C hot isostatic pressing molded, the
alloy consisted of and phases, thereinto, the coarser phase distributed around the
powder particles was defined as the previous particle boundaries (PPB). Therefore, the
configuration of sphere-like previous particle was clearly appeared, and the power particle
size was about 15~25 μm, as shown in Fig. 3.1(a).
With the HIP temperature increased to 1150 °C, the size of the powder particles was similar
to the former, but the sphere-like configuration was not clearly. The PPBs consisted mainly
of the coarse phase, and the size and amount of the coarser phase decreased slightly as
shown in Fig. 3.1(b). As the HIP temperature increased to 1180 °C, the size of the grain grew
up obviously, being about 20~40 μm. Besides, the grain boundaries appeared the straight-
like feature, and the amount and size of the coarse phase decreased obviously as shown in
Fig. 3.1(c). The dark regions around the powder particles were defined as the previous
particle boundaries (PPB) in which the secondary phase was precipitated along the
different orientations as marked by letters A and B.
Fig. 3.1. Microstructure of the alloy after HIP treated at different temperatures.
(a) 1120 °C,(b) 1150 °C,(c) 1180 °C
(a)
20
m
(b)
20
m
20m
(c)
A
B
Creep Behaviors and Influence Factors of FGH95 Nickel-Base Superalloy
407
Fig. 3.2. Magnified morphology of the alloy HIP treated at different temperatures. (a) finer
-phase precipitated within the grain of the alloy treated by HIP at 1120 °C, (b) after HIP
treated at 1150 °C, no - phase particles precipitated in the regions near the coarser -phase
as marked by arrow, (c) after the alloy treated by HIP at 1180 °C, particle-like carbides
precipitated along the boundary as marked by short arrow.
The magnified morphology of the alloys which were hot isostatic pressed at different
temperatures was shown in Fig. 3.2. Thereinto, the phase displayed the black color due to
the dissolved during chemical corrosion, and the matrix which is not dissolved displays
the gray color. After HIP treated at 1120 °C, the coarser phase which distributed around
the PPB was about 1~2 μm in size and was defined as the primary phase. Besides, the fine
secondary phase was regularly distributed along the same orientation within the previous
powder particles as shown in Fig. 3.2(b). As the HIP temperature increased to 1150 °C, the
secondary phase about 0.1~0.3 μm in size was dispersedly precipitated within the grain,
and the coarser phase still existed in the PPB regions. Moreover, the depleted zone of the
fine -phase appeared in the regions near the coarser phase, as marked by the arrow in
Fig. 3.2(b).
The magnified morphology of the powder particle in the 1180 °C HIP alloy was shown in
Fig. 3.2(c), indicating that the fine secondary particles with different orientations were
precipitated within the same grain as marked by A and B in Fig. 3.2(c). No fine particles
were precipitated in the PPB regions near the coarser phase, so the region was defined as
the depleted zone of the fine -phase as marked by the long arrow in Fig. 3.2(c). Moreover,
some white carbide particles were precipitated in the PPB region as marked with the white
short arrow in Fig. 3.2(c).
The microstructure of the different temperature HIP alloys which were solution treated at
1155 °C, cooled in the molten salt at 520 °C and twice aging treated was shown in Fig. 3.3.
The microstructure of the 1120 °C HIP alloy after full heat treated was shown in Fig. 3.3(a),
illustrating that a few of coarser phase was distributed along the grain boundaries. And
the size of the coarse phase was about 1 ~ 2 μm, as marked with the white short arrow in
Fig. 3.3(a). Besides, the fine phase was dispersedly precipitated within the grain as marked
with the long arrow in Fig. 3.3(a). Comparing to Fig. 3.3(a), the microstructure of the 1150 °C
HIP after full heat treatment had no obvious distinction to the former, and the grain size
(
a
)
4
m 4
m
(
b
)
4m
(
c
)
A
B
Aeronautics and Astronautics
408
was about 10~25μm. The secondary phase was dispersedly distributed in the alloy as
shown in Fig. 3.3(b). With the HIP temperature increased to 1180 °C and after full heat
treatment, the PPB trace was kept in the alloy as marked with the long arrow in Fig. 3.3(c),
indicating that the grain grew up obviously after HIP treated at 1180 °C, and the coarse
phase dissolved completely, only kept a few of primary phase which size was about 1μm
in the grain boundaries as marked with the short arrow in Fig. 3.3(c). Moreover, some fine
carbide particles were dispersedly precipitated in the alloy as shown in Fig. 3.3(c).
Fig. 3.3. Microstructure of the different temperatures HIP alloy after fully heat treated.
(a) 1120 °C, (b) 1150 °C, (c) 1180 °C
The magnified morphology of the different temperature HIP alloy after fully heat treated was
shown Fig. 3.4. After the 1120 °C and 1150 °C HIP alloys were fully heat treated, a few of
coarse phase was precipitated along the boundary regions as marked with short arrow in
Fig. 3.4(a) and (b). And the coarse phase appeared in the boundary as shown in Fig. 3.4(a).
Fig. 3.4. Magnified morphology of the different temperature HIP alloy after fully heat
treated (a) 1120 °C, (b) 1150 °C, (c) 1180 °C
15m
(a)
(b)
15m
(c)
15m
4m
(a)
(c)
4m
(b)
4m
Creep Behaviors and Influence Factors of FGH95 Nickel-Base Superalloy
409
Moreover, fine white particles were discontinuously precipitated along the boundaries as
marked with the long arrow in Fig. 3.4(a) and (b), and the fine secondary phase and white
particles were dispersedly distributed in the alloy as shown in Fig. 3.4(a) and (b). With the HIP
temperature increased to 1180 °C and after fully heat treated, the sphere-like PPB kept in the
alloy as marked with long arrow in Fig. 3.4(c), and the boundaries displayed an obvious
straight feature as marked with short arrow in Fig. 3.4(c). Moreover, fine phase was
dispersedly distributed within the grain, and the white particles of about 0.2 μm in size were
dispersedly precipitated in the grain as shown in Fig. 3.4(c).
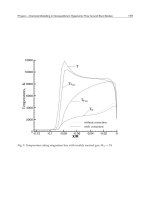
3.2 Analysis on the influence of HIP temperatures on microstructure
When the FGH95 alloy was HIP treated at 1120 °C and 1150 °C which is lower than the
dissolving temperature of phase ( T
m
= 1160 °C ), the coarse phase distributed around
the PPB were not completely dissolved. Therefore, the phase which was reserved in the
PPB regions was going to grow up during the slowly cooling stage of HIP, which resulted in
forming the morphology of the coarser particles distributed along the PPB. The size of
previous powder particles were kept in the alloy because no enough deformed energy
which come from the HIP deformation promoted the powder particles growth up, as shown
in Fig. 3.1(a) and (b).
When the alloy was hot isostatic pressed under the conditions of 120 MPa at 1180 °C, the
coarser phase in the PPB regions was completely dissolved, which may enhance the
diffusion rate of the elements and reduce the transferring resistance of the boundaries to
promote the growth of the grain, therefore, the alloy displayed a larger grain size as shown
in Fig. 3.1(c). At the same time, the nucleation and growth of the carbide occurred on the
fine oxides which existed in the powder particle surface, and the carbide nucleation process
only needs lower energy (Domingue J. A. et al., 1980). Consequently, some white carbide
and coarser particles were discontinuously precipitated in the PPB regions as shown in
Fig. 3.2(c), and the depleted zones of the fine phase appeared in the region near the coarse
particles, due to the coarsening of particles to consume the much more elements of
former, as shown in Fig. 3.2(c).
4. Influence of solution temperatures on microstructure
4.1 Influence of solution temperature on the microstructure
After the 1120 °C HIP alloy was solution treated at 1140 °C and twice aged, the grain size of
the alloy was homogeneous, and fine phase was dispersedly precipitated within the grain,
as shown in Fig. 4.1(a). Besides, much more coarse phase precipitated along the grain
boundaries as marked with the arrow in Fig. 4.1(a). The magnified morphology was shown
in Fig. 4.1(b), significant amount of fine phase were dispersedly distributed in the alloy,
and the depleted zone of -phase appeared around the coarse phase which distributed
along the boundary regions, as shown in the Fig. 4.1(b).
With the solution temperature increased to 1150 °C, the microstructure of the alloy consisted
of the and phases, the average grain size of the alloy was about 10~20 m, as shown in
Fig. 4.2(a), which indicated that some coarser -particles are precipitated in the wider
boundary regions, and the average size of the coarser phase was about 1~2.5 μm. The
magnified morphology of the alloy was shown in Fig. 4.2(b), indicating that significant
amount of the fine particles were dispersedly distributed within the grains, the size of the
Aeronautics and Astronautics
410
Fig. 4.1. Microstructure of the alloy after solution treated at 1140 °C. (a) after solution treated
at 1140 °C, coarse phase distributed in the alloy, (b) no finer phase precipitated in the
regions near the coarser phase
ones was about 0.1~0.3 μm. And no fine -particles were precipitated in the regions near the
coarser -phase, the regions were defined as the depleted zone of the fine -phase as
marked by the arrow in Fig. 4.2(b), the magnified morphology of the depleted zone of -
phase was marked by the arrow in Fig. 4.2(c).
Fig. 4.2. Microstructure of the alloy after solution treated at 1150 °C. (a) After solution
treated at 1150 °C, some coarser phase precipitated in the wider boundary regions, (b) fine
phase distributed dispersedly within the grains, and the depleted zones of the fine
phase marked by arrow, (c) magnified morphology of the depleted zone of -phase
As the solution temperature increased to 1160 °C, the grain boundaries appeared obviously,
and the average size of the grains in the alloy was about 15 ~ 25 m as shown in Fig. 4.3(a).
Compared to Fig. 4.2(a), the coarser -precipitates in the boundary regions disappeared, and
the white particles with size about 0.2 μm were precipitated within the grains and along the
boundaries as marked by the arrows in Fig. 4.3(a). The magnified morphology of the alloy
was shown in Fig. 4.3(b), indicating that the coarser particles and depleted zone of the fine
(a)
15
m
(b)
3m
(b)
m
(c)
m
(a)
15m
Creep Behaviors and Influence Factors of FGH95 Nickel-Base Superalloy
411
phase had disappeared, and the secondary phase was dispersedly distributed within the
grains. The grain boundary in the alloy was marked by longer arrow and some particles
were homogeneously precipitated along the boundaries and within the grains as marked by
the short arrows in Fig. 4.3(b).
Fig. 4.3. Microstructure of the alloy after solution treated at 1160 °C. (a) after solution treated
at 1160 °C, the coarser phase disappearing and the grain boundaries appearing obviously
in the alloy, (b) the secondary phase distributed dispersedly within the grain, and some
particles precipitated in the alloy as marked by the arrows
Fig. 4.4. Microstructure of the alloy after solution treated at 1165 °C. (a) After solution
treated at 1165 °C, the average size of the grains in the alloy increasing obviously, and films
of white phase precipitated along the boundaries as marked by arrows, (b) the secondary
phase distributed dispersedly within the grains, and films of the white phase distributed
along the grain boundaries
As the solution temperature increased to 1165 °C, the grain sizes in the alloy increased, the
linear-like boundaries appeared in the alloy, and the films of the white phase were
continuously precipitated along the boundaries as marked by the arrows in Fig. 4.4(a). The
magnified morphology of the white phase was shown in Fig. 4.4(b), indicating that white
particles were continuous precipitated to form the films along the boundaries as marked by
(a)
15
m
(b)
3m
(a)
15m
(b)
3m
Aeronautics and Astronautics
412
the arrow in Fig. 4.4(b), and significant amount of the fine secondary phase were
precipitated within the grains, no depleted zones of the fine phase were detected in the alloy.
The grain sizes after the alloy was solution treated at various temperatures were measured as
listed in Table 4.1. Moreover, by means of composition analysis under SEM/EDS, it is
indicated that the elements Nb, Ti and C are richer in the white particles which were located
within the grain and boundary regions as shown in Fig. 4.3 and Fig. 4.4, respectively.
After the alloy was solution treated at 1160 °C, the fine -particles with the size of about 0.1
m were dispersedly precipitated within the grains as shown in Fig. 4.5(a), the particles can
effectively hinder the dislocation movement to enhance the creep resistance of the alloy. The
smaller space between the fine -particle was measured to be about 0.03 m, the bigger
space between the fine -particles is measured to be about 0.12 m as marked by letters L
1
and L
2
in Fig. 4.5(a), respectively. It was indicated by TEM/EDS analysis that the elements
Nb, Ti and C richer in the carbide particle which was located in the boundary as shown in
Fig. 4.5(b), and the particle was identified as (Nb, Ti)C phase by means of the diffraction
spots analysis as marked in Fig. 4.5(c).
Solution temp. (°C) 1140 1150 1160 1165
Average grain sizes (μm) 10~20 10~20 15~25 20~40
Table 4.1. Grain sizes of the alloy solution treated at different temperatures
Fig. 4.5. Morphologies of and carbide phases. (a) Fine phase precipitated dispersedly
within the grain, (b) carbide particles precipitated along the boundaries, (c) SAD patterns
4.2 Influence of quenching method on the microstructure
After the 1180 °C HIP alloy was solution treated at different temperatures and cooled in oil
bath at 120 °C and twice aging treated, the alloy displayed the various sizes of grains in
which the fine phase was dispersedly and regularly precipitated, as marked by white long
arrow in Fig. 4.6(a). The bigger grains was about 40~60 m in size, the smaller grains was
about 20 m in size, the bunch-like coarser particles were distributed in the PPB regions,
or some coarser particles were congregated in the local regions as marked by black arrow
in Fig. 4.6(a). The depleted zone of the fine -phase appeared in the regions near the coarser
phase as marked with the white short arrow in Fig. 4.6(a). As the solution temperature
0.5
m
(b)
0.25
m
(a)
400
000
422
022
(c)
L
1
L
Creep Behaviors and Influence Factors of FGH95 Nickel-Base Superalloy
413
increased to 1160 °C, the coarser phase in the alloy was completely dissolved due to the
higher solution temperature. Moreover, the fine phase and the white particles were
dispersedly distributed within the grains, respectively, and some white particles were
precipitated along the boundaries as marked by white arrow in Fig. 4.6(b). Furthermore, the
twinning appeared within the grain as marked by black arrow in Fig. 4.6(b).
Fig. 4.6. Morphology of the alloy after solution treated at different temperatures and cooled
in oil bath. (a) After solution treated at 1150 °C, the fine phase distributed dispersedly
within the grains, and the depleted zone of -phase as marked by shorter arrow. (b) after
solution treated at 1160 °C, the fine phase and carbide particles distributed dispersedly
within the grains, respectively
After solution treated at 1150 °C, then cooled in molten salt and twice aged, the microstructure
of the alloy consisted of the particle-like phase with different size, the coarser -phase was
distributed in the PPB regions as marked by white arrow, and the fine phase was
dispersedly distributed within the grain as marked by black arrow in Fig. 4.7(a). Furthermore,
the depleted zone of the fine phase appeared in the region near the coarser -phase as
marked by white short arrow in Fig. 4.7(a), and the size of the fine phase was about 0.15 m.
Fig. 4.7. Morphology of the alloy after solution treated at different temperatures, and cooled
in molten salt. (a) After solution treated at 1150 °C, the fine phase distributed dispersedly
in the grains, and the coarse particles precipitated along the boundaries, (b) after solution
treated at 1160 °C, straight-like boundaries marked by black arrow, and the fine particles
distributed dispersedly within the grains.
(a)
10m
(b)
10m
(b)
10m
10m
m
(a)