Optoelectronics Devices and Applications Part 11 potx
Bạn đang xem bản rút gọn của tài liệu. Xem và tải ngay bản đầy đủ của tài liệu tại đây (1.75 MB, 40 trang )
Integrated ASIC System and CMOS-MEMS
Thermally Actuated Optoelectronic Switch Array for Communication Network
389
(a)
(c)
(b)
Fig. 4. Simulated fundamental mode profile from BPM-based calculations.
In the process of making the rib waveguide as shown in Table 2, we also examined four
different process parameters to see how they affect the final waveguide’s dimensions. The
first step was to investigate the polarization characteristics of the waveguide due to its
geometry. Various waveguide heights ranging from 0.3 to 1.0um and width ranging from
0.9 to 2.0um are considered. While keeping waveguide height constant during the
computation, the difference in effective indices of the fundamental TE waveguide modes
has been evaluated as the etch depth and waveguide width were varied.
Process number Process step
1 Thermally grown SiO2 on Si wafer
2 LPCVD deposition of Si3N4 layer
3
Spinning of resist, patterned by photolithography(E-Beam) and
structure by RIE
4
Deposition of PECVD SiO2 cladding layer and annealing of layer
stack
5 Sputtering a Platinum (Pt) thin film
6 Patterned by photolithography and Pt wet-etch.
Table 2. Process flow for SiO2/Si3N4 coupled microring resonators.
Optoelectronics – Devices and Applications
390
Single mode propagation is an important requirement for optical waveguide devices for use
with single-mode fiber; it can reduce the coupling loss. In this research, a technique is used
for calculating the field distribution of the Si3N4 rib waveguide. The waveguide was
modeled using the three-dimensional full-vectorial beam propagation method (BPM) to
calculate the effective refractive indices and modal field profiles for various waveguide
widths, heights and etch depths. The scanning electron micrograph (SEM) of Fig. 5 shows
such a fabricated rib waveguide.
We experimentally verify the practically single mode nature of our deeply etched rib
waveguides by imaging control straight waveguides output intensity patterns. Fig.6 shows
the representative imaged waveguide output intensity profile with waveguide of the order
of 1550nm.
Fig. 5. SEM image of the waveguide cross section.
Fig. 6. Imaged waveguide output intensity profile.
In the wavelength modulation, thermal optic effect was employed to shift the resonance
wavelength at an amount of
△λ by the tuning of effective index at different temperatures.
This wavelength shift can be used to tune the passband to the desired wavelength. The
principle of wavelength modulation is shown in Fig. 1, illustrating that the elevation of
temperature on one MR switch shifts the center wavelength by
△λ but remain the same
Free Spectral Range (FSR). The term FSR is borrowed from Fabry Perot interferometry, and
describes the maximum spectral range one can arbitrarily resolve without the interference
Integrated ASIC System and CMOS-MEMS
Thermally Actuated Optoelectronic Switch Array for Communication Network
391
from the neighbouring signals. On the other hand, a high extinction ratio can be obtained
through the filtering effect from the MRs with a steep wavelength response. A relationship
between the radius of the ring R, the effective group index n
g
, and the FSR is given by
equation (6):
2
2
g
FSR
Rn
(6)
where λ is the wavelength [14-15].
In temperature control, frequency modulation was employed instead of voltage level
modulation due to the simplicity of implementation by digital signals. Through frequency
modulation, the temperature in the thermally tuneable PLC modules can be maintained
almost constant and this will result in a more accurate center wavelength for the optical
communication channel. It also ensures rapid response of the PLC module as the heater has
been modulated on and off in a high frequency (~MHz). As a result, the PLC module at
room temperature was able to achieve a very small temperature fluctuation within 0.1
C
which can not be achieved by using traditional DC controls.
In order to compensate the fabrication error of the thermal ring switch, a simple and
practical phase-trimming technology was employed to avoid the need of electrical biasing.
The phase-trimming technique employs a local heating technology by the employment of a
thin-film heater embedded under the optical ring in a feedback loop for the fine tune of the
optical phase. However, if DC bias is employed in the phase control, the temperature of the
neighbouring switch may encounter drift (cross talk) as well as slow response for
temperature compensation. To lower down the cross talk effect, provide more accurate
temperature control, and speed up thermal response of the optical ring, a frequency
modulated heating scheme is employed by dynamic feedback of the frequency of heating
pulses.
To achieve the above goal by frequency modulation for accurate temperature control, this
study employs a selection algorithm to select a proper waveform pre-stored in the lookup
table in an ASIC(Application specific integrated circuits ) chip, in which all waveforms have
been simulated and optimized for different temperature situations. Each drop and filter
channel is assigned a temperature for the desired wavelength shift. The temperature is
maintained by a corresponding waveform from the result of the sum of three signals,
including data (address), select, and power.
2.2 Design of three dimensional controller
In traditional control circuit design for thermal optical type switch array, each optical ring
requires one heater for wavelength adjustment. As a result, when the optical switches
scale up into a large array, the numbers of input/output ports will increase enormously.
To handle large array of driving circuits for such a heater array, two dimensional (2D)
circuit architecture was employed by traditional driving circuits to reduce the IO number
from n*n into 2n+1. However, this reduction still can not meet the requirement for high
speed signal scanning with low data accessing points when switch numbers greater than
1000.
To achieve this, in this study, a three dimensional data registration scheme to reduce the
number of data accessing points as well as scanning lines for large array optical packet
switching chip with switch number more than 1000 is proposed. The total numbers of data
Optoelectronics – Devices and Applications
392
accessing points will be N=3
3
Y +1, which is 31 for 1000 switches by the 3D novel design,
the scanning time is reduced down to 33% (The scanning speed is also increased by 3 times)
thanks to the great reduction of lines for 3D scanning, instead of 2D scanning. The property
comparison among 1D, 2D, and 3D architectures is listed in Table 3. As the optical switch
number increases, a higher order control circuit can effectively reduce the pad number. In
addition, the shape and amplitude of the driving signal can be optimized to increase the
speed of the response with low driving powers [16].
Table 3. Performance comparison among 1D, 2D, and 3D driving schemes.
Fig. 7. Block diagram of control algorithm for micro-ring switches.
Integrated ASIC System and CMOS-MEMS
Thermally Actuated Optoelectronic Switch Array for Communication Network
393
In the proposed novel 3D design, different from the 2D one, as shown in Fig. 3, the digital
driver includes a clock-control circuit, a serial/parallel-conversion circuit, a latch circuit, a
level shifter, a D/A converter comprised of a decoder, and an output buffer comprised of an
operation amplifier. The D/A converter receive a gray-scale reference voltage from an
external source [17-21]. The clock-control circuit receives control signals from an external
control circuit. Based on the received control signals, the clock-control circuit attends to
control of the latch circuit, the D/A converter [22-24], the output buffer by using a latch-
control signal.
The general strategy that we employ is to integrate all relatively small-signal electronic
functions into one ASIC to minimize the total number of the components. This strategy
demonstrates that both the cost is lowered and the amount of the printed circuit board area
is reduced. Based on this concept, a smart 3D multiplexed driver for optical packet
switching chip with more than 1000 rings are proposed and the circuit architecture is shown
in Fig. 7. Three lines are employed to control the heating of one micro-ring, including
voltage, shift register, and data line. The relationship among the waveforms is shown in Fig.
8. Each heater resistor requires a voltage line for the driving current flow and shares the
same ground with the other resistors. The resistors are individually addressable to provide
unconstraint signal permutations by a serial data stream fed from the controller. The shift
register is employed to shift a token bit from one group to another through AND gates to
power the switch of a micro-ring group. The selection of a ring is thus a combined selection
of the shift register for the group and the data for the specific ring. Such an arrangement
allows encoding one data line from the controller to provide data to all of the rings,
permitting high-speed printing by shortening the ring selection path and low IC fabrication
cost from the greater reduction of circuit component numbers.
Fig. 8. Example of input waveform for controller from FPGA.
Optoelectronics – Devices and Applications
394
The received optical data information has to be converted into data at an optimal transfer
rate (frequency) in order to conform to the ring characteristics. To the end, the clock-control
circuit divides the 8-bit optical packet switching signals supplied to the data driver, as
shown in Fig. 7, with an aim at lowering the operation frequency. The serial/parallel-
conversion circuit converts serial signals of a plurality of channels into parallel signals, and
supplies the parallel signals to the latch circuit. The latch circuit temporarily stores the
received parallel signals, and supplies them to the level shifter and the D/A converter at
predetermined time [25-27]. The level shifter converts a logic level ranging approximately
from 3.5 V to 5 V into a ring array voltage level that ranges from 5.5V to 8.5V for various
heater resistors as a result of variation processing conditions.
In the signal flow design, optical switches are usually scanned over one by one without
jumping on un-activity switches. As a result, for the optical packet switching chip with 448
optical switches, a 1, 2 or 3 dimensional circuit architect will needs 448, 36, and 5 unit times
for scanning over all of the switches. Therefore, the scanning time of the 3D multiplexing
circuit from the first address line to the 16th, as an example, takes only 5 units of clock time
from the simulation result, much faster than that of the 2D configuration with 16 units of
clock time. Thus the maximum scanning time for the 3D circuit will be reduced to 30% of
that in the 2D case.
To simultaneously write signals into the driving circuit, multiplexing data latches and shift
registers are employed by the application of commercial available CMOS ICs. Small
numbers of shift registers, control logics, and driving circuits can be electrically connected
and integrated with optical packet switching using standard CMOS processes. Fig. 9 shows
the driving circuit of the three-dimensional architect. The desired signal for “S” selections
and “A” selections can be pre-registered and latched in the circuit for one time writing.
Fig. 9. Architect of three-dimensional driving circuit for micro-ring switches.
Integrated ASIC System and CMOS-MEMS
Thermally Actuated Optoelectronic Switch Array for Communication Network
395
The SPICE simulation results on the relationship of input and output signal at 5s clock
time. Fig. 10 demonstrates that not only the switch speed is higher by the level shift device
than that of one without level shift circuit, but also the voltage has been enhanced to 5V. An
adjustable voltage pulse from 7.98V to 8.02V amplitude modulation is applied to the various
heater resistors thanks to the processing condition.
The cooling down of the structure is equally important, though enhancing the speed of the
cooling down process might be done by active cooling, but this would require major
adaptations to the device and the low cost low power principle would not hold anymore. A
much easier way to do this is biasing. In biasing, a DC-current is applied, that will result in a
relatively small change in temperature, refractive index and therefore resonance
wavelength. To heat the device, the wide pulse width signal or high gray scale level voltage
is applied; to cool it down, a narrow pulse width signal or low-level voltage is applied. See
Fig. 10 for the simulated behavior of high and low bias driving. The maximum current that
can be applied is limited, due to the destruction of the heaters at high powers. The use of a
bias will therefore cause a smaller modulation depth, but the modulation will be faster, since
the time needed for cooling down is reduced.
Fig. 10. Transient simulation of the input and output signals of the level shift device.
Power consumption of a narrow pulse width signal or low-level voltage applied for the
thermally actuated optical switch array is very small comparing a DC-current applied. The
main advancement of this new concept is that the drive signal opening the switch tracks the
serial/parallel- conversion circuit, which converts serial signals of a plurality of channels
into parallel signals, and supplies the parallel signals to the latch circuit.
Optoelectronics – Devices and Applications
396
If we analyze the total wire power, we calculate that the intermediate interconnection power
is the dominant part of the total wire power. The total wire power is scaled down of the
three dimensional hierarchy of high gray scale control circuit design, which effectively
reduces the terminal numbers into the cubic root of the total control unit numbers.
3. Experimental and results
3.1 Wavelength modulation and lock
By using a Commercial Finite Difference Solver (CFD-RC, USA) for thermo-optical
problems, the temperature profile of the MR and the relative changes of refractive indexes
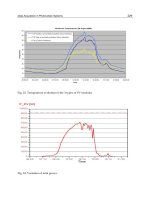
can be simulated, as shown in Fig.11(a) and Fig.11(b). Electro-thermal changed temperature
by ASIC multiplexing data signal applying to coupled-ring-resonator for adjustment core
index. Optimal tunable center wavelength 1511nm conform the shifted core indexes from
2.000 to 2.008. Although the temperature distribution on the ring is about 1
°C, the average
temperature of the ring is employed as a reference for the temperature control and the
tolerance is within 0.1
°C. To reduce overshooting and obtain rapid set up of ring
temperature, heating pulses with amplitude modulation were employed. Through
simulation, optimized driving signal can be obtained to maintain stable wavelength in 0.1
ms by accurate temperature modulation [28]. The temperature fluctuation can be controlled
within 0.1
C, with a wavelength variation locked in 0.01 nm, as the measured result shown
in Fig. 12.
Fig. 11(a). Driving architecture of wavelength lock and simulation profile.
Integrated ASIC System and CMOS-MEMS
Thermally Actuated Optoelectronic Switch Array for Communication Network
397
Fig. 11(b). The relative of shifted index and wavelength.
1533.0 1533.2 1533.4 1533.6 1533.8 1534.0 1534.2 1534.4
-0.26
-0.24
-0.22
-0.20
-0.18
-0.16
-0.14
Transmittance(dB)
Wavelength(nm)
蚓
32.2
蚓
29.3
蚓
32
Fig. 12. Wavelength lock.
Optoelectronics – Devices and Applications
398
3.2 Controller and wavelength modulation result
To demonstrate basic functions of the 3D controller, as a result, we were able to reduce the
number of electrical terminals to 5 control terminals and 1 power supply terminal. The
controller was designed for a 0.35 μm CMOS process with a total circuit area of 2500×2500
μm
2
, which is 80% of the circuit area by 2D configuration for 448 switches.
In the Logic Analysis, the relationship between the ASIC input and output is shown in Fig.
13. The input signals include DATA (signal for selected switch action), CLK1(signal to scan
DATA signal), CLK2(signal to latch DATA signal or select), CTRL(signal to select enable
type), as well as SETB(the time sequence to set up CTRL or power), and the output signals
match the designed ASIC signals very well. Fig. 14. shows the image of a fabricated 16×28
matrix switch controller module. In this module, the chip area of 2.5×2.5 mm and was
fabricated by a two-poly four-metal (2P4M) 0.35
m twin-well CMOS technology (TSMC,
Taiwan Semiconductor Manufacturing Company Ltd). Each transistor is surrounded by full
guard ring for preventing electrostatic shock.
Fig. 13. FPGA verification result.
The testing result of the IC demonstrated the scanning of 448 ring switches takes 60.5
s for
2D circuit architect while 20.5
s for the 3D one, representing a time saving of 40 μs or a 67%
time reduction. The measurement results of serial output signals for four channels, as shown
in Fig. 15, demonstrated a simultaneous operation of four different temperature
/wavelength modulations in each channel. By using the optimized driving signals,
modulation frequencies up to 10 kHz were measured, resulting in thermal switching speeds
in the order of 0.1 ms.
The micro-rings are made with the use of standard clean room fabrication technology. The
fabrication of silicon nitride waveguides starts with a six inch diameter polished <100>
silicon wafer. First a planar waveguide structure with a SiN(n=2.06@
λ=1550nm) core and
SiO2(n=1.452@
λ=1550nm) cladding is formed. Finally the heater layer is deposited by
Integrated ASIC System and CMOS-MEMS
Thermally Actuated Optoelectronic Switch Array for Communication Network
399
sputtering a Platinum (Pt) thin film and patterned by photolithography and Pt wet-etch.
Some results of temperature coefficient of resistance (TCR) measurements on platinum thin
films. The shift in center wavelength of the ring λc is a function of the difference in effective
index induced by heating the device that is given by equation (7):
Neff
Neff
c
(7)
Fig. 14. Photograph of fabricated control IC chip.
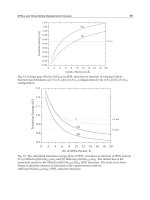
In the wavelength modulation, temperature variation induced spectrum shift was
measured, and the result is shown in Fig. 16, for the temperature changed from 29
C to
32
C, for which the thermal resonance shift is determined to be 0.1nm/C. The temperature
fluctuation can be controlled within 0.1
C, with a wavelength variation locked in 0.01 nm.
The measured values are FSR=1.5nm and center wavelength shift λc=0.3nm at a center
wavelength of λ=1532nm.
Optoelectronics – Devices and Applications
400
Fig. 15. Measurement result of serial outputs.
Fig. 16. Wavelength shift of transmission spectrum in coupled-ring-resonator.
Integrated ASIC System and CMOS-MEMS
Thermally Actuated Optoelectronic Switch Array for Communication Network
401
4. Conclusion
The next generation of optical networking requires optical switches with complex
functionality, small size and low cost. In this research, we have successfully designed and
fabricated a silica-based 16×28 PLC-SW controller module in which we incorporated a
switch chip based on PLC technology and new driving circuits with a serial-to-parallel
signal conversion function. The new driving circuits significantly reduced the number of
control terminals, and enabled us to realize a simple module structure suitable for use in a
large-scale switch. It has been demonstrated that the scanning of 448 ring switches takes 20.5
s by the novel 3D architect, representing a 67% time reduction.
On the other hand, thermal-optical effect was employed for wavelength modulation in this
optical switch. To reduce overshooting and obtain rapid set up of ring temperature, heating
pulses with amplitude modulation were employed. A temperature variation within 0.1
C
can be maintained by this design, which can provide a very accurate wavelength
modulation to 0.3 nm within 0.01 nm variation.
5. References
C. A. Brackett, et. al.(1993) “A Scalable Multi-wavelength Multihop Optical Network: A Proposal
for Research on All-Optical Networks”, J.Lightwave Technol., vol. 11, 736-753.
K. Okamoto, K. Takiguchi & Y. Ohmori,(1995) “16-channel optical add/drop multiplexer
using silica-based arrayed-waveguide gratings”, Electron. Lett., vol. 31, pp. 723-724.
H. Li, C. Lee, W. Lin, L.S. Didde, Y. J. Chen & D. Stone(1997) “8- wavelength photonics
integrated 2x2 WDM cross-connect switch using 2xN phased-array waveguide
grating (PAWG) multi/demultiplexers”, Electron. Lett., vol. 33, pp. 592-594.
C. R. Doerr, et. al.,(1999) “40-wavelength add-drop filter”, IEEE photon. Technol. Lett., vol.
11, pp. 1437-1439.
M. Okuno, A. Sugita, T. Matsunaga, M. Kawachi, Y. Ohmori, & K. Katoh,(1993) “8×8 optical
matrix switch using silica-based planar lightwave circuits,” IEICE Trans. Electron.,
vol. E76-C, no. 7, pp. 1215–1223.
M. Okuno, K. Kato, Y. Ohmori, M. Kawachi, & T. Matsunaga,(1994) “Improved 8×8
integrated optical matrix switch using silica-based planar lightwave circuits,” J.
Lightwave Technol., vol. 12, pp. 1597–1606.
T. Goh, A. Himeno, M. Okuno, H. Takahashi, & K. Hattori,(1998) “Highextinction ratio and
low-loss silica-based 8×8 thermooptic matrix switch,” IEEE Photon. Technol. Lett.,
vol. 10, pp. 358–360.
T. Goh, M. Yasu, K. Hattori, A. Himeno, M. Okuno, & Y. Ohmori,(1998) “Low-loss and high-
extinction-ratio silica-based strictly nonblocking 16×16 thermo-optic matrix
switch,” IEEE Photon. Technol. Lett., vol. 10, pp. 810–812.
Wenlu Chen, Zhonghua Zhu, Yung Jui(Ray) Chen, Jacob Sun, Boris Grek, & Kevin
Schmidt,(2003) ”Monolithically integrated 32×four-channel client reconfigurable
optical add/drop multiplexer on planar lightwave circuit”, IEEE photonics
technology letters,vol.15,no10,pp.1413-1415.
J.E. Ford, V. Aksyun, D. Bishop & J. Walker,(1999) “Wavelength add-drop switching using
tilting mirrors”, J. Lightwave Technol., vol. 17, pp. 904-911.
C. Pu, L. Lin, E. Goldstein & R. Tkach,(2000) “Client-configurable eight channel optical
add/drop multiplexer using micromachining technology”, IEEE photon. Technol.
Lett., vol. 12, pp. 1665-1667.
Optoelectronics – Devices and Applications
402
William M. J. Green, Hendrik F. Hamann, Lidija Sekaric, Michael J. Rooks, & Yurii A.
Vlasov,(2006) ”Ultra-compact reconfigurable silicon optical devices using micron-
scale localized thermal heating”, Optical Society of America, pp.1-3.
Andreas Witzig, Matthias Streiff, Wolfgang Fichtner ,“Eigen-mode Analysis of Vertical-
Cavity Lasers”,pp.1-34.
N. A. Riza & S. Yuan,(1999) “Reconfigurable wavelength add-drop filtering based on a
Banyan network topology and ferroelectric liquid crystal fiber-optic switches”, J.
Lightwave Technol., vol. 17, pp. 1575-1584.
Wenhua Lin, Haifeng Li, Y. J. Chen, M Dagenais & D. Stone,(1996) “Novel Dual-Channel-
Spacing WDM Multi/Demultiplexers Based on Phased- Array Waveguide
Grating”, Photonics Tech. Lett. 8, 1501.
Jian-Chiun Liou, & Fan-Gang Tseng,(2008)” Integrated Control Circuit For Thermally
Actuated Optical Packet Switch“,Wireless And Optical Communications (WOC)
pp.213-218.
Young-Kai Chen, Andreas Leven, Ting Hu, Nils Weimann, Rose Kopf, Al Tate,(2008)”
Integrated Photonic Digital-to-Analog Converter for Arbitrary Waveform
Generation”, Photonics in Switching (PS), Optical Switches and Routing Devices,
D-08-2, pp.1-2.
WANG Meng-Yao, WEI PAN, BIN LUO, ZHANG Wei-Li, & ZOU Xi-Hua (2007)
“Optimization of gray-scale performance in pixellated-metal-mirror FLC-OASLM
by equivalent circuit model” Microelectronics journal, vol. 38, no2, pp. 203-209.
Christopher M Waits, Alireza Modafe & Reza Ghodssi,(2003)”Investigation of gray-scale
technology for large area 3D silicon MEMS structures”, J. Micromech. Microeng. 13
170-177.
S. Mias, L.G. Manolis, N. Collings, T.D. Wikinson, W.A. Crossland,(2005) Phase-modulating
bistable optically addressed spatial light modulators using wide-switching-angle
ferroelectric liquid crystal, Opt. Eng. 44 (1) 014003
–014017.
C.A.T.H. Tee, W.A. Crossland, T.D. Wilkinson, A.B. Davey,(2000) Binary phase modulation
using electrically addressed transmissive and silicon backplane spatial light
modulators, Opt. Eng. 39 (9) 2527-2534.
S. Mias, N. Collings, T.D. Wilkinson, S. Coomber, M. Stanley, W.A. Crossland,(2003) Spatial
sampling in pixelated-metal-mirror ferroelectricliquid- crystal optically addressed
spatial-light-modulator, Opt. Eng. 42 (7) 2075
–2081.
Y. Kuno, Y. Taura, M. Yagura, S. Hamada, N.S. Takashashi, S. Kurita,(1991) Amorphous-silicon
photosensor-based ferroelectric-liquidcrystal light valve, Proc. SID 32 (3), 187-190.
W. Li, R.A. Rice, G. Moddel, L.A. Pagano-Stauffer, M.A.Handschy,(1989) Hydrogenated
amorphous-silicon photosensor for opticallyaddressed high-speed spatial light
modulator, IEEE Trans.Electron Dev. 36 (12) 2959
–2964.
M.Y. Wang, W. Pan, B. Luo, X.H. Zou, W.L. Zhang, (2007) The t
–V min addressing mode
and an improved equivalent circuit model for ferroelectric liquid crystal displays,
IEE Proc Opto- electron , vol. 1, no1, pp. 16-22.
M.Y. Wang, W. Pan, B. Luo, (2004) Study of the respondent characteristicsin ferroelectric
liquid crystal spatial light modulator, J. Funct. Mater.Dev. 10 (4) 489
–492.
Meng-yao Wang, Wei Pan, Bin Luo, Wei-li Zhang and Xi-hua Zou,(2007)”Optimization of
gray-scale performance in pixellated-metal-mirror FLC-OASLM by equivalent
circuit model “Microelectronics Journal (38) 203-209.
Jian-Chiun Liou & Fan-Gang Tseng (2008) “An Intelligent Multiplexing Control Thermal
Actuated Optical Packet Switch”, Photonics in Switching (PS), Optical Switches and
Routing Devices, D-06-2, pp.1-2.
Part 5
Signals and Fields in Optoelectronic Devices
20
Low Frequency Noise as a Tool for OCDs
Reliability Screening
Qiuzhan Zhou, Jian Gao and Dan’e Wu
Jilin University
China
1. Introduction
With the rapid development of the information and science, more and more newly
semiconductor devices are used in the electronic equipments or systems, and so is the
Optoelectronic Coupled Devices (OCDs). Because of excellent characteristics of it such as
small size, long life, non-contact mode and strong anti-interference, OCDs can replace many
kinds of devices e.g. relays, transformers, choppers when used in switching circuits, A/D
conversion, remote transmission, over-current protection and so on. The reliability of OCDs
is very important in numerous applications. It has draw great attention in switching circuit,
isolation circuit, analog-digital converter, logic circuit, etc.
However in some high reliability fields, such as navigation and communication of the
satellite, it is necessary to make sure of the reliability of the OCDs. In the past, the reliability
screening of the OCDs contained ageing experiments; physical analysis at high and low
temperature as well as static testing which are either expensive, time-consuming or cannot
separate the good ones from the bad ones. So some researchers proposed that using low
frequency noise as a reliability indicator.
From the ninety of the last century, we do the research of using noise as reliability screening
of the OCDs and improve it continually. So in this paper, we will introduce how to use low
frequency noise as a tool for OCDs reliability screening, and summarize what all we had
done as well as the latest research.
2. Analysis of noise types in OCDs
Noise as a diagnostic tool for quality control and reliability estimation of semiconductor
devices has been widely accepted and used, and there are many papers published in this
area. It is very useful to describe the judging rules, which enable us to predict the individual
quality of electronic components, based on measurements of their noise.
It is known that an OCD is made of two parts: LED and Photo detector, both of which are p-
n junction devices. So it can be concluded that the noise in OCDs below 1 MHz mainly
consists of shot noise, 1/f noise, generation-recombination noise and burst noise. Among
them, shot noise and 1/f noise are fundamental. It should be noted that the noise that we are
interested in here has strong relation to some typical defects in a device. For this reason, it is
necessary that the generation mechanisms of 1/f noise, g-r noise and burst noise in OCDs
are all briefly discussed, especially on what kinds of defects can lead to these three kinds of
noises. And the relation between them should be discussed as well.
Optoelectronics – Devices and Applications
406
2.1 1/f noise
1/f noise spectrum is inversely proportional to frequency in a very wide range. In
homogeneous semiconductors, its spectrum can be characterized by a parameter α
according to
2
R
N
Sa
f
R
(1)
where S
R
is the power spectral density of the noise in the resistance R, N is the total number
of free charge carriers, and f is the measurement spot frequency. The parameter α then is the
contribution of one electron to the relative noise at 1 Hz, assuming that the N electrons are
uncorrelated noise sources.
In addition, it has been found that α is not a constant, whose value is between 10
-6
and 10
-3
,
but that α depends on the prevailing type of scattering of the electrons and perfection of the
crystal lattice. In recent years much progress has been made and found that it is mainly
caused by lattice scattering.
Vandamme has shown that the 1/f noise parameter a increases with the concentration of
dislocations and its noise spectrum is proportional to a and inversely proportional to the
carrier lifetime. Konczakowska research has indicated that there is a strong relation between
bipolar device lifetime and 1/f noise.
Usually 1/f noise in a semiconductor device usually can be divided into fundamental 1/f
noise and non-fundamental (or excess) 1/f noise. The fundamental 1/f noise is connected
with phenomena which are included in the process of the operation of the electronic
component. It is believed that this 1/f noise has no relation to the semiconductor surface
and the defects in the bulk.
The 1/f noise which is related to device defects is called non-fundamental 1/f noise, which
means that this kind of 1/f noise is caused by device surface or bulk defects in most cases.
Thus, it is possible for us to evaluate the device quality and reliability according to its
magnitude. From this point of view, non-fundamental 1/f noise is of great value to device
quality evaluation and reliability prediction. Most of the evidence suggests that in some
types of device it is a surface effect, as in the case of a MOSFET where the
semiconductor/oxide interface plays an important role, but in other devices, such as a
homogeneous resistor, 1/f noise is thought to be a bulk effect associated with a random
modulation of the resistance, implying a fluctuation in either the number or the mobility of
the charge carriers. For example, M. Mihaila et al have shown that 1/f noise in a specimen
with more dislocations is at least one order of magnitude larger than that of the specimen
with fewer dislocations.
Different causes for 1/f noise generation have been reported as follows: (1) the fluctuation of
surface recombination velocity in the p-n junction, (2) the fluctuation of trapping in the
oxide layer in BJTs or in MOSFETs, (3) dislocation 1/f noise, (4) quantum 1/f noise (in
dispute). It is obvious that 1/f noise intensity is related to the generation-recombination
center (surface defect) numbers in device oxide layer. Thus, the establishment of a
relationship between device surface quality and reliability can help us judge and screen
devices according to excess noise intensity.
Therefore it is possible for us to evaluate the device quality and reliability according to its
magnitude. From this point of view, 1/f noise is of great value to device quality evaluation
and reliability prediction. It is verified that crystal defects cause 1/f noise to increase. The
Low Frequency Noise as a Tool for OCDs Reliability Screening
407
experimental results have proved that 1/f noise in the specimen with more dislocation is at
least one order of magnitude larger than that of the specimen with fewer dislocations.
At present, a major cause of 1/f noise in semiconductor devices is traceable to properties of
the surface of the material. The generation and recombination of carriers in surface energy
states and density of surface states are important factors, but even the interfaces between
silicon surfaces and grown oxide passivation are centers of noise generation. It is obvious
that 1/f noise intensity has a relation to the generation-recombination center (surface defect)
numbers in device oxide layer. Thus, the relation between device surface quality and 1/f
noise is closely related and can be used to screen poor quality devices according to their
intensity of excess noise.
2.2 g-r noise
Generation-recombination (g-r) noise distribution is Gaussian and its signal spectrum can be
expressed as Lorentzian,
0
222 2
0
1
V
RI
SA
SS
RV I
(2)
Here, τ
0
=1/ω
0
is the characteristic time corresponding to a characteristic (or corner)
frequency f
0
or ω
0
, and ω
0
=2πf is the angular frequency of measurement. g-r noise has a
Gaussian amplitude distribution function because it is actually made up from the
superposition of a very large number of independent random telegraph signal processes
with the same characteristic time. The coefficient, A, is a measure of the number of such
individual processes. It depends on g-r center density, current and device structures.
It has been found experimentally that g-r noise is often absent in high quality silicon
devices, but not yet in heterostructures, where lattice defects are often a problem. In poor
quality devices, the g-r noise is generated at the contacts or at the surface. In better samples,
the dominant conductance noise source is in the bulk. Hence, g-r noise used as a useful
diagnostic tool to study trap centers in compound semiconductors, is indispensable.
By experimentation it has been shown that the defects (dislocation, deep-level impurities) in
the emitter junction and surface are the main g-r noise sources of transistor, especially as a
p-n junction is in a forward biased state. Jevtic and Lazovic have shown that excess g-r noise
in reverse biased p-n junctions can be caused by g-r centers near the metallurgical junction.
These centers may be the impurity in metal clusters associated with dislocations.
Thus, it can be seen that g-r noise in a device has a direct relation to semiconductor defects
(impurities, damage etc.). Therefore, it has become an effective method of analyzing bulk
defects and reliability screening by means of measuring g-r noise in devices.
2.3 Burst noise
A random telegraph signal (RTS) known as burst noise, is often observed in p-n junction
devices such as diodes, transistors and detectors operating under forward biased conditions.
All authors have attributed the phenomenon to defects located in the neighborhood of the
emitter base junction.
Hsu et al. first presented a physical model of explaining burst noise. In this model, it is
thought that heavy metal impurities deposited in the charge region of p-n junction is the
major cause of this noise.
Optoelectronics – Devices and Applications
408
But Blasquez has found that so-called ``pure'' lattice dislocation can also cause burst noise
even when heavy metal impurity deposits have been removed. Therefore it seems that metal
impurity precipitates are not indispensable to produce burst noise. Dai et al. has proposed a
new burst model, which emphasizes the built-in electric field in the p-n junction and the
variation of the potential barrier near the defects. This model not only is consistent with the
experimental results given by Blasquez, but also can explain various burst noise waveforms.
In addition, Jevtic has also presented a new physical model of noise sources, which is based
on the assumptions that a conduction channel (p-inversion layer) exists in degraded p-n
junctions and that the current flow through the defects is modulated by traps adjacent to the
defects. The model explains the appearance of two polarity and multi-level pulse noise.
Although burst noise spectrum is not Gaussian as are the other types of noise, its current
noise spectrum has the shape of Lorentzian,
2
22
1
bb
I
b
A
Sf
(3)
Where A
b
is a constant depending on the nature of the defects and τ
b
is defined as 1/τ
b
=1/τ
1
+1/τ
2
. According to the random switch mode, during the time interval dt, an open
switch has the probability dt/τ
1
of closing, and a closed switch a probability dt/τ
2
of
opening. The information on the defects is contained in the parameter A
b
and τ
b
.
Besides, burst (or RTS) noise is a problem typical for submicron MOST's or bipolar devices
with crystallographic damage in sensitive areas and this noise is also temperature and bias
dependent. Many experiments have already shown that lattice dislocation, a serious defect,
is the major source of burst noise for both bipolar transistor and integrated circuit.
Therefore, devices with burst noise often degrade faster and at least show a poor noise
behavior. Fig. 1 shows a noise waveform of time-domain in an OCD with excess noise.
Fig. 1. Noise waveform of time-domain in an OCD with excess noise.
Low Frequency Noise as a Tool for OCDs Reliability Screening
409
2.4 Brief summary
It can be seen that 1/f noise, g-r noise and burst noise are closely related with some defects such
as surface defects, impurities and dislocations, etc. Dislocations and electromigration in
metallization affect device reliability, and has been identified as the main source of device failure.
Thus, it can be said that 1/f noise is closely related to the surface states of the semiconductor
device, g-r noise related to device bulk defects such as impurities, dislocation, etc., and burst
noise related to lattice dislocation as well as heavy metal impurity deposits. Besides, emitter
region edge dislocation makes both 1/f noise and burst noise increase at the same time in
most cases. Strasilla and Struut demonstrated that experimentally observed burst noise
consist of a random telegraph signal superimposed on 1/f noise, but the two processes were
statistically independent.
Hence in order to exclude these defects and meet high reliability, we can use the three
independent noise, 1/f, g-r and burst noise, as reliability indicator for quality estimation of
OCDs.
3. The noise measurement and analysis of OCDs
Harder C et al have presented that the noise equivalent circuit of a semiconductor laser
diode from the rate equations including Langevin noise sources. This equivalent circuit
allows a straightforward calculation of the noise performance of a laser diode combined
with extrinsic elements, such as the driving source and the parasitic elements. Recently,
using this rate equation, these intrinsic intensity fluctuations in semiconductor laser diode
(LD), optoelectronic integrated device (OEID) made by heterojunction phototransistor
(HPT) and laser diodes have been analyzed, then the relative intensity noise (RIN) and the
correlation between the terminal electrical noise and output optical photocurrent noise have
been investigated.
At present, the key to design of low-frequency low noise devices and circuits lies in
reducing level of white noise and corner frequency of l/f noise, which has been realized
gradually and Whether voltage noise or current noise takes these two parameters as its
characteristics. But the present noise measuring apparatus, such as QuanTech2173c/2181
and HP-4470 and so on, only can give out noise of several frequency points or of several
fixed frequency, no more give out two pat meters. Thus it can be seen that if one want to
understand all-sidelly the low-frequency noise performance of a semiconductor device, to
make researches on semiconductor noise mechanism and to apply low-frequency noise to
analyzing the inherent defect of a device and its reliability and so forth, one must make
study of the measurement of low-frequency noise spectrum and the computation of its
parameters. This important work is absolutely necessary to understand noise performance
of a device or a circuit and specially to develop low-noise devices.
In this part, the noise equivalent circuit of OCDs have been analyzed; then noise spectrum
measurement systems of OCDs based on FFT analyzer (CF-920, made in Japan) and virtual
instrument are presented, their measuring range is 0. 25Hz- l00kHz and accuracy is higher
than 4%. Moreover, the white noise level and corner frequency are computed by applying
weighed least square method.
3.1 The noise equivalent circuit of OCDs
Fig. 2 shows the schematic diagram of the OCDs circuit. The OCDs measured and analyzed
in this paper are GD315A, made in China. It is well known that if the input current I
0
of a
laser diode is less than the threshold current I
ph
, the noise equivalent circuit of a
Optoelectronics – Devices and Applications
410
semiconductor laser diode can also be used to explain the noise performance of an LED. Fig.
3 shows the noise equivalent circuit of OCDs. It is composed of LED and optotransistor
shown in the left portion and the right one, respectively. Where R
s
is the source resistance,
i
Rs
is the thermal noise of R
s
. The quantities in and v
n
are the intrinsic noise sources of LED,
the sources in and v
n
are partially correlated due to the coupled rates. Their noise spectral
densities are shown as follows:
Fig. 2. The schematic diagram of OCDs.
Fig. 3. The noise equivalent circuit of OCDs.
2
00
24
n
ivc
Sf qi qES
(4)
()
()
()()()
0
1
2
00
2
+
+
4
= SE
τβASn
mV
fS
vc
τ
s
T
v
ph
n
(5)
0
00
1
2
2
nn
T
vi
sph vc
mV
q
S
f
S
nAS E
(6)
The current i
f1
denotes the low frequency noise source in LED. The definition of all symbols
in Eqs. (4) - (6) and circuit parameters R, C, L, R
se
in the LED equivalent circuit in Fig. 3 can
be found in the references and another publication. In the noise equivalent circuit of the
phototransistor, i
b
is the base noise current, it is caused by the noise current i
L
in LED, hence
i
b
can be written as γ
iL
, where γ can be calculated by the current transfer ratio (CTR) of
OCDs. Since CTR is defined as I
c
/I
0
, in the low frequency region all capacitors in the OCDs
are omitted; from Fig. 3 we have
'
0
mLse bb be
c
se L ce
g
RR r r
I
CTR
IRRRR
(7)
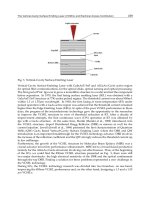
Then γ can be calculated by Eq. (7). In the high frequency region, CTR will decrease due to
the influence of circuit capacitance. The CTR of OCDs can be obtained by measurement of
OCDs (GD315A) as is shown in Fig. 4, where curve 1 is measured in the condition R
L
=1kΩ,
and curve 2 is R
L
=500Ω.
Low Frequency Noise as a Tool for OCDs Reliability Screening
411
Fig. 4. The CTR of OCDs versus frequency.
In the equivalent circuit of the phototransistor, i
f2
denotes the low frequency noise source in
it. r
b’b
, r
be
, g
m
, C
b’e
, C
bc
, C
ce
are the circuit parameters of phototransistor shown in Fig. 3.
3.2 Noise spectrum measurement systems
3.2.1 Noise measurement system based on FFT analyzer
Fig. 5 is the measurement system block scheme of low-frequency noise spectrum testing
system we have developed. In our experiments, a dual-channel low frequency amplifier
(LNA) chain and the CF-920 cross-spectrum estimator have been used to reduce the
background noise of measurement system; hence the noise in the amplifiers will not
contribute to the cross-spectrum measured by this system. Therefore, the output voltage
noise spectrum of OCDs can be written as
0
12
S
S
KK
(8)
Where S(ω) is the cross-spectrum measured by CF-920, K
1
and K
2
are the gains of the dual-
channel amplifiers LNA I and LNA II, respectively.
Fig. 5. The noise measurement system of OCDs using CF-920.
In the testing system, the cross-spectrum density estimation method was used to reduce the
noise contribution of two preamplifiers. The reason was that two sets of batteries were used
as the power supplies for the preamplifiers so that the noises in the two preamplifiers
Optoelectronics – Devices and Applications
412
themselves were uncorrelated. So, the measuring system can be used to measure a much
smaller signal than usual.
Thus it can be seen that amplifier’s self-measurement error has been eliminated basically
according to the measuring method in this system. And the measurement accuracy of noise
spectrum is mainly decided by CF-920. The measuring range of this system is 0. 25 Hz-100
KHz frequency wide and accuracy is higher than 4%. In the whole measurement process,
the measurement and the output of measuring results are controlled automatically by
computer.
3.2.2 Noise measurement system based on virtual instrument
Considering the large volume of CF-920 in the above system, which is inconvenient to carry,
we design a new measurement system with virtual instrument made by the company of
National Instrument and the system block diagram is shown in Fig. 6. It is well known that the
virtual instrument platform is widely used in the fields of measurement, auto-control, signal
processing and so on, and what the most important is the high precise and small volume.
Fig. 6. The noise measurement system of OCDs built on virtual instrument platform.
Where, PXI-4472E is a high-precision 24-bit data acquisition card which acquires the signal
from the preamplifiers. The noise signals could be processed for cross-spectral transform,
components of noise spectrum estimation and the noise spectrum analysis algorithm in a
software developed in LabVIEW. The equivalent input noise power spectrum as Eq. (9) can
be tested through low-frequency noise spectrum measurement system.
2
1
1( )
i
N
oi
i
oi
C
f
B
Sf A
f
f
f
(9)
Where
A, B and C
i
are amplitudes of white noise, 1/f noise and G-R noise respectively; α is a
constant 1;
f
oi
is the corner frequency of excess G-R noise; N is the number of G-R noise
sources in devices. As long as parameters
A, B and C
i
are estimated, the magnitude of each
type of noise in the device can be determined. A genetic algorithm which would be
discussed below was used to fit the parameters, so the coefficient of white noise, 1/f noise
and G-R noise were obtained quickly and accurately across the entire spectrum.
3.2.3 Noise analysis of OCDs
According to the noise equivalent circuit given in Fig.3, the noise curves are analyzed in
various frequency ranges.
Low Frequency Noise as a Tool for OCDs Reliability Screening
413
(1) Low frequency range (1 Hz < f <1 kHz): In this frequency range, the 1/f noise and
generation-recombination g-r noise are dominant. We measured the noise spectrum of 205
OCDs (GD315A made in China), the noise spectrum for four typical devices are shown in
Fig. 7. These devices exhibit various low frequency noises. Using the curve fitting method,
the analysis results of noise spectrum for four typical devices shown in Fig. 7 are given as
follows:
NO.4
10 10
13 2
0
2
0.85 10 0.014 10
S510
f
1(f15)
f
VHz
NO.45
10 10
13 2
0
2
410 0.0710
S210
f
1(f15)
f
VHz
NO.102
10 10
13 2
0
2
110 2.1310
S1.0510
f
1(f15)
f
VHz
NO.15
10 7
13 2
0
2
6.28 10 0.64 10
S810
f
1 (f 2500)
f
VHz
The noise analysis results show that OCD No. 4 exhibits a normal low frequency noise, No.
45 has excess 1/f noise, No. 102 has excess g-r noise (the corner frequency is 15 Hz), and No.
15 has excess 1/f noise and g-r noise with burst noise waveform. It means that OCDs No. 4
is a reliable device, No. 45, 102 and 15 coincide with various defects in OCDs, and i.e. their
quality is poor.
(2)
Medium frequency range (1 kHz < f <10 kHz): In this frequency range, the low frequency
noise current
i
f1
and i
f2
in the OCDs can be omitted; hence, the OCDs output noise is caused
by shot noise
i
c
(t), thermal noise i
Rs
(t) and the spontaneous emission noise i
n
and v
n
.
Omitting all capacitors in the OCDs, the output noise spectrum can be obtained:
2
22
0
2
() 2 ()
(() () ) ()
nnn
Rs n
viv
Lii Lic
se
se
SS
SRCTRS S RS
R
R
(10)
Where
S
iRs
=4kT/R
s
, S
ic
(ω)=2qI
c
. According to the Reference written by Harder C et al, the
noise current source
i
n
in parallel with the junction represents mainly the fluctuation in
electron population. The first term on the right-hand side of Eq. (4) is the usual shot noise
term 2
qI
0
of OCDs, the second term results from the fact that the noise is determined by the
sum of emission and absorption. The noise voltage source
v
n
results from the fluctuation of
the photon population.
Since the input current
I
0
of LED is less than the threshold current I
ph
, if we omit the second
term of in and
v
n
, Eq. (11) can be written as follows:
22 2
00 0
22
LL
SqICTRRqIR
(11)
Let
I
0
=10mA, CTR=1, R
L
=390Ω, R
s
=360Ω, I
c
=10mA, from Eq. (11) we obtain the output noise
voltage spectrum
S
0
(ω)=9.7×10
-16
V
2
/Hz. The effective value of S
0
(ω) equals 31.2 /nV Hz
which is smaller than the measurement result (287-488
/nV Hz ). It means that the second
term of
i
n
and v
n
caused by the spontaneous emission in LED cannot be omitted.