Evaporation Condensation and Heat transfer Part 13 potx
Bạn đang xem bản rút gọn của tài liệu. Xem và tải ngay bản đầy đủ của tài liệu tại đây (1.83 MB, 40 trang )
Evaporation, Condensation and Heat Transfer
470
0
10
20
30
40
50
0 102030405060708090100
Temperat ure[
℃
]
Surface tension[mN/m]
ethanol_55.0wt%
ethanol_45.0wt%
ethanol_35.0wt%
ethanol_25.0wt%
ethanol_15.0wt%
ethanol_7.15wt%
ethano l
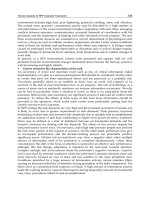
Fig. 7. Surface tension of ethanol aqueous solutions measured by the maximum bubble
pressure method.
Figure 7 shows results for ethanol aqueous solutions. All lines tend to decrease
monotonically as the temperature increases. However, surface tension remained constant
and increased slightly at temperatures above 75 °C. The authors believe that this could be
the result of instability caused by boiling because the boiling point of these solutions is
approximately 80 °C.
The maximum bubble pressure method found a milder nonlinearity for the surface tension
of butanol and pentanol aqueous solutions than Wilhelmy’s method, as shown in Fig. 5. The
authors believe that because the maximum bubble pressure method encloses the test fluid
and the vapour, the error caused by changes in concentration because of species evaporation
was greatly minimized. This condition is very different from that employed in Wilhelmy’s
method. The authors consider the maximum bubble pressure method and procedure used in
this study gave more reasonable and reliable values.
The solubility of butanol in pure water at room temperature is 7.15 wt% and that of
pentanol in pure water at room temperature is 2.0 wt%. The surface tension of pure water is
very sensitive to the addition of these alcohols. At solubility concentrations, the surface
tension of alcohol aqueous solutions approached that of pure alcohols at low temperature,
as shown in Fig. 6.
On the other hand, the ethanol aqueous solutions varied in their temperature dependence,
as shown in Fig. 7. The solubility concentration is not 55 wt%. If the concentration of ethanol
was increased further, the line would approach that of pure ethanol.
In summary, by performing these measurements, the authors themselves re-confirmed the
peculiar dependence of surface tension on temperature in high-carbon alcohol aqueous
solutions. The nonlinearity of the behaviour was milder than that expected from
measurements using the traditional Wilhelmy’s method. The maximum bubble pressure
method yielded very reasonable data. The authors then began flow boiling experiments
with those peculiar solutions and attempted to determine their advantages in terms of heat
transfer enhancement.
3. Simple application to flow boiling in a straight mini tube
As a simple application of the peculiar solutions, the authors attempted flow boiling
experiments in a single straight tube made of quartz and applied a high-carbon alcohol
aqueous solution as the working fluid (Ono et al., 2008a). Figure 8(a) shows the flow loop used
High-Carbon Alcohol Aqueous Solutions and
Their Application to Flow Boiling in Various Mini-Tube Systems
471
in the experimental examination of convective boiling in the mini tube. A diaphragm pump
was used to supply the fluid at a mass flux of 1–2 kg/m
2
s. A pressure tank was properly
installed to eliminate the pressure beat caused by the pump. Figure 8(b) shows the test section
in the experiment. A quartz glass tube was used as the test section. The tube was 1.0 mm in ID
and 2.0 mm in OD. To provide Joule heating, a mixture of indium tin oxide (ITO) and silver
was evenly sputtered on the outer surface of the tube. The film thickness was approximately
100 nm. Because the film is transparent, liquid motion inside the tube can be observed. Nine K-
type thermocouples of 25
μm in OD were attached to the outer surface of the quartz tube with
heat-resistant cement. The thermocouples were calibrated before performing the experiment
by using a standard thermometer; their accuracy was confirmed to be within +
0.2 K.
Simultaneously with temperature measurements, liquid motion was observed and recorded
by a CCD video camera system. In mini tubes, the liquid temperature in flow boiling is
strongly time dependent, as noted by other researchers (Thome, 2006; Cheng & Wu, 2006;
Kandlikar, 2004). Also, in the present experiment, the temperature at the outer surface of the
mini tube varied in a time dependent manner. The actual temperature data were very
complicated; to investigate them quantitatively, they were time-averaged for analysis later. In
this study, the flow rate was very small and was chosen so that dry-out phenomena could
occur near the midpoint of the length of the tube. Moreover, the small flow rate made it easier
to observe the liquid behaviour and liquid vaporisation. Temperature data were collected for
approximately 60 min to obtain time-averaged values. Test fluids were 1-butanol aqueous
solution (7.15 wt%), ethanol aqueous solution (7.15 wt%) and pure water. The solubility of 1-
butanol in water at room temperature is 7.15wt%. The same concentration was adopted for the
ethanol aqueous solution for comparison although the solubility of ethanol in water is much
higher. Experimental conditions are shown in Table 1. Different quartz tubes and
thermocouples were used in runs A and B.
Fig. 8a. Experimental apparatus for the D
in
= 1 mm channel.
Fig. 8b. Test section of D
in
= 1 mm.
Evaporation, Condensation and Heat Transfer
472
Inner diameter D
in
(mm)
Mass flow rate
(kg/s)
Mass flux
(kg/m
2
s)
Imposed heat flux
(W/m
2
)
Re
1.0 1.7 × 10
−6
2.2 3.4 × 10
6
2.1
Table 1. Experimental conditions.
Figures 9(a1), (a2), (b) and (c) show images of the liquid behaviour near the dry-out position.
Figures 10(a1), (a2), (b) and (c) show images from other experimental runs. In Figs. 9(a2) and
10(a2), curves are drawn to indicate the liquid–vapour interface because the position of the
interface was somewhat difficult to see owing to the image quality. The dry-out position
was approximately 240 mm away from the inlet, as estimated by a simple heat balance
estimation. The dry-out phenomenon was in fact observed near this position. Figures 9(b)
and 10(b) show results for pure water, and Figs. 9(c) and 10(c) show those for the ethanol
aqueous solution. Figures 9(a1), 9(a2), 10(a1) and 10(a2) show that the butanol aqueous
solution exhibited very peculiar liquid behaviour. The liquid film was elongated in the
outlet direction, squeezed and separated into several smaller drops, and then it disappeared
by vaporisation. This pattern of phenomena was sometimes repeated. In contrast, pure
water and the ethanol aqueous solution did not exhibit such movement; they simply formed
a relatively larger drop and disappeared by vaporisation.
Fig. 9.1a. Liquid behaviour of the butanol aqueous solution (7.15 wt%) (Run 1a).
Fig. 9.2a. Liquid behaviour of the butanol aqueous solution (7.15 wt%) (Run 1a).
Fig. 9b. Liquid behaviour of pure water (Run 1b).
Fig. 9c. Liquid behaviour of the ethanol aqueous solution (7.15 wt%) (Run 1c).
Fig. 10.1a. Liquid behaviour of the butanol aqueous solution (7.15 wt%) (Run 2a).
High-Carbon Alcohol Aqueous Solutions and
Their Application to Flow Boiling in Various Mini-Tube Systems
473
Fig. 10.2a. Liquid behaviour of the butanol aqueous solution (7.15 wt%) (Run 2a).
Fig. 10b. Liquid behaviour of pure water (Run 2b).
Fig. 10c. Liquid behaviour of the ethanol aqueous solution (7.15 wt%) (Run 2c).
0.0
20.0
40.0
60.0
80.0
100.0
120.0
140.0
160.0
180.0
0 0.05 0.1 0.15 0.2 0.25 0.3
Distance from the inlet-side electrode[m]
Temperature[
℃
]
Butanol aqueous solution(7.15wt%)
Ethanol aqueous solution(7.15wt%)
Pure water
Dryout point
Fig. 11. Time-averaged temperature distribution at the tube surface (D
in
= 1 mm).
The distribution of the time-averaged temperature at the outer surface of the tube is
shown in Fig. 11. The position of the dry-out point, indicated in the figure, was estimated
by a simple heat balance calculation ignoring surface tension phenomena. Observation
results indicated that the estimated position was reasonable. On the basis of Fig. 11, the
authors thought that under these experimental conditions, the butanol aqueous solution
exhibited no apparent difference from pure water and the ethanol solution in terms of
heat transfer. The butanol solution did exhibit peculiar movement of the evaporating
liquid layer but the time-averaged dry-out position was not delayed. One reason for this
could be the time span between the film elongation, shown in Fig. 9(a1), and the dry-out
phenomenon for the butanol solution. The butanol solution exhibited a longer time span
than pure water and the ethanol solution, and consequently, a larger temperature
fluctuation. Therefore, even if the film elongation delayed the dry out, the longer dry-out
Evaporation, Condensation and Heat Transfer
474
time span cancelled any advantage. Another reason could be the system design. In this
simple straight tube, the temperature gradient in the longitudinal direction can not be
increased much. The thermocapillary effect is generally enhanced by a larger temperature
gradient. Thus, heating area should be localized, i.e. it should cover only a small area of
the tube.
Next, the authors attempted an experiment in which the heated area was limited to only 10
mm in the longitudinal direction. It was assumed that the liquid would experience a higher
temperature gradient at the region where the flow enters the small heated area. Figure 12
shows the test section used for this experiment. The length of the heated area differs from
that in Fig. 8(b). The tube was the same quartz tube coated with the same mixture of ITO
and silver; its ID was 1 mm and OD was 2 mm. An electrodes was set at each end of the
heated length. As in the experiment in Fig. 8(b), nine thermocouples were glued to the outer
surface of the tube. Table 2 lists experimental conditions and Table 3 lists specifications of
test fluids.
The temperature of the outer surface at the midpoint of the heated region was measured to
determine the cooling ability of the working fluid when a constant power of 3.5 W was
applied to the heated area. The temperature was averaged from data taken over 30 min and
is plotted in Figs. 13(a) and 13(b). Figure 13(b) shows an enlarged plot of the heated area.
The temperature of the heated area was very high because the area became almost perfectly
dry in the process. As shown in Fig. 13(b), the temperature of the butanol and pentanol
aqueous solutions, which are nonlinear solutions, was approximately 70° lower than that of
pure water. The temperature of the ethanol solution was also lower than that of pure water
but the temperature difference was approximately 35°, and the cooling effect was weaker
than that for butanol and pentanol solutions. The hexanol aqueous solution showed a
weaker cooling effect than the ethanol solution although the hexanol solution is categorized
as nonlinear. This contradiction requires further investigation. The authors think that it
could be related to the high viscosity of the hexanol solution.
Fig. 12. Test section with the short heating length of D
in
= 1 mm.
Inner diameter D
in
(mm)
Mass flow rate
(kg/s)
Mass flux
(kg/m
2
s)
Imposed heat flux
(W/m
2
)
Re
1.0 2.8 × 10
−6
3.6 1.1 × 10
5
12
Table 2. Experimental conditions (short heating length experiment).
High-Carbon Alcohol Aqueous Solutions and
Their Application to Flow Boiling in Various Mini-Tube Systems
475
Fluid Concentration (wt%)
Butanol aq. sol. 7.15
Pentanol aq. sol. 2.0
Hexanol aq. sol. 0.58
Pure water -
Ethanol aq. sol. 55
Table 3. Test fluids (short heating length experiment).
When the heating length was as large as 300 mm, as shown in Fig. 8(b), the solution
switched to the vapour phase in a complicated manner through the entire length of the
heated region. However, in the experiment with the very short heated region shown in Fig.
12, the solution quickly changed to a liquid layer and then to vapour near the entrance to the
heated region. This made the observation rather simple and the dry out was readily
detected.
0
50
100
150
200
250
300
350
400
450
500
0 50 100 150 200 250 300
Distance from the inlet-side electrode[m m ]
T em p e rtu re [℃ ]
B utanol A q .
Sol. (7 .15wt%)
P entanol A q .
Sol. (2 w t% )
H exanol A q .
Sol. (0 .58wt%)
P ure w ater
Ethanol A q .
Sol. (55wt%)
Fig. 13a. Distribution of temperature at the outer surface of the tube.
380
390
400
410
420
430
440
450
460
470
140 142 144 146 148 150
H eating section[m m ]
T em p erture [℃ ]
B utanol A q .
Sol.
(7 .15w t%)
P entanol A q .
Sol. (2 w t% )
H exanol A q .
Sol.
(0 .58w t%)
P ure water
Ethanol A q .
Sol. (55wt%)
Fig. 13b. Distribution of temperature at the outer surface of the heated section.
Evaporation, Condensation and Heat Transfer
476
0
50
100
150
200
250
300
350
400
0 100 200 300 400 500 600 700
Time[s]
Tem perature[℃]
Fig. 14. Temperature fluctuation at the outer surface (butanol aqueous solution).
0.0E+00
1.0E+04
2.0E+04
3.0E+04
4.0E+04
5.0E+04
6.0E+04
7.0E+04
8.0E+04
9.0E+04
0 50 100 150 200 250
⊿Tsat[℃]
heat flux[W /m
2
]
B utanol A q .Sol.(7 .15w t%)
P entanol A q .Sol.(2 .0w t%)
H exanol A q .Sol.(0 .58w t%)
Pure water
Ethanol A q .Sol.(5 5 .0w t%)
Fig. 15. Boiling curves of all test fluids.
The authors investigated the onset of the dry out state by gradually increasing the applied
power. Figure 14 shows the temperature fluctuation before and after the onset of the dry out
for the butanol aqueous solution. Before the perfect dry out occurred, the temperature
fluctuated strongly. When the liquid layer evaporated, the temperature rapidly increased;
however, once the liquid further entered the heated region, the temperature quickly
decreased to a value approximately equal to the saturated temperature. However, when the
power increased, the liquid could no longer remain in the heated area and it evaporated as
soon as it entered the region. At this point, the temperature became extremely high, and the
inner surface of the tube became perfectly dry.
This dry-out pattern was very unusual because the flow rate was quite small and the
temperature of the dried wall was extremely high in this study. Thus, the detected dry-out
heat flux might not be readily comparable to the heat flux of conventional dry-out
phenomena, which should be noted when referring to other researchers’ data.
High-Carbon Alcohol Aqueous Solutions and
Their Application to Flow Boiling in Various Mini-Tube Systems
477
The authors investigated the heat flux at the unusual dry-out point described above by
changing the type of fluid. Figure 15 shows boiling curves obtained in those experiments.
The heat flux was corrected by reducing the heat loss to environmental air and to the
surrounding quartz region by heat conduction. The heat loss was estimated by performing a
preliminary experiment without flowing liquid whose details are omitted here. Note that
the heat flux was very small because the flow rate was quite small in these experiments. As
shown in Fig. 15, maximum heat fluxes obtainable with nonlinear solutions, namely the
butanol and pentanol aqueous solutions, were larger than those of other fluids. The authors
considered that those nonlinear solutions tended to wet the heated surface more than other
fluids owing to their peculiar characteristics, and that the dry-out state was delayed as a
result. This difference was made clear by adopting a short heating region. The large
temperature gradient that was realized near the entrance of the heated area could have
intensified the nonlinear thermocapillary effect.
In summary, the authors attempted a very special type of a situation for applying a very
large temperature gradient to a liquid layer of a nonlinear solution and succeeded in
obtaining more desirable characteristics of the solution. However, under this condition, the
heat flux at the dry-out point was too small for application in practical methods. Therefore,
further ideas and modifications, including changes to the flow pattern and heating system,
are needed to obtain a practical level of the heat flux. The authors began modifying the
experimental setup after experiments shown in Section 3.
4. Modified application to flow boiling in T-junction mini tube
In the previous section, the butanol aqueous solution was found to exhibit better heat
transfer characteristics as long as it experienced a large temperature gradient over a short
heating region. However, in previous experiments, the obtained heat flux was very small
and was not in the range of practical application. As a more practical experiment, the
authors set up new test sections of T-junction mini channels. In this flow pattern, the fluid
could impinge on the heated surface and flow away with boiling bubbles to the outlet.
Therefore, the temperature boundary layer can be thinned, and also, as shown in Fig. 16, the
temperature gradient around the boiling bubble located on the heated surface can be
increased. The thermocapillary effect is expected to work more strongly under this
temperature gradient.
Fig. 16. Impinging flow pattern with boiling when using a nonlinear solution.
Evaporation, Condensation and Heat Transfer
478
Here the authors attempted two types of test sections. One is a T-junction mini tube made of
transparent quartz for observation, and the other is a T-junction made of insulating polymer
material for localizing heat transfer at the heated surface to obtain precise heat flux values.
4.1 T-junction mini tube made of quartz glass
A schematic of the flow system is shown in Fig. 17. The T-junction channel was made of
quartz glass. The heated surface was the edge of a copper block that contained a rod heater
inside. DC power was applied to the rod heater. Figure 18 shows details of the T-junction
test section. The inside cross-sectional area of the channel was 2 mm × 2 mm and outer
dimensions of the cross section were 4 mm × 4 mm. The entire length was 150 mm. At the
middle of the upper surface of the horizontal channel, a slit of a cross-sectional area of 2 mm
× 10 mm was prepared for inserting the edge of the copper block. A vertical channel of 75
mm was added to form a T-junction channel. The geometry of the copper block is shown in
Fig. 19. The fluid contacted the left edge. The surface was polished by using #3000 emery
paper. Three K-type thermocouples were inserted near the edge of the copper block. The
thermocouples were located 3 mm, 7 mm and 11 mm from the contacting surface,
respectively. The temperature gradient and heat flux were deduced from the obtained
temperature data by applying the simple one-dimensional Fourier law. The surface
temperature at the edge was also calculated by extrapolation from the data. The motion of
the liquid and boiling bubbles was observed by using a video camera. Experimental
conditions are shown in Table 4. Test fluids were butanol aqueous solutions of 3.00 wt% and
7.15 wt% and pure water.
1: Test section; 2, 3: Tank; 4: Metering pump; 5: DC power supply; 6: Thermocouples; 7: Thermocouple
logger; 8: Video camera and 9: PC
Fig. 17. Experimental apparatus (T-junction mini tube made of quartz glass).
Fig. 18. Test section (T-junction mini tube made of quartz glass).
High-Carbon Alcohol Aqueous Solutions and
Their Application to Flow Boiling in Various Mini-Tube Systems
479
Fig. 19. Copper block used for heating.
Mass flow rate (kg/s) Mass flux
(kg/m
2
s)
Re Subcooling
(K)
1.4 × 10
−4
35 79 75
Table 4. Experimental conditions (T-junction mini tube made of quartz glass).
Figures 20(a), 20(b) and 20(c) show images of observations of the nucleate boiling state. The
images are not of high quality; therefore, large boiling bubbles are outlined in white. The
observed area included the heated surface and its periphery.
When butanol solutions were used, two types of boiling bubble were observed. One was
fine bubbles that cannot be seen in Figs. 20(a) and 20(b). The fine bubbles quickly detached
from the heated surface and moved away. The 3.00 wt% butanol solution produced more
bubbles of this type than the 7.15 wt% solution. The other type was relatively large bubbles
located on the heated surface, which are outlined in Fig. 20. They remained at the surface for
some time and then became detached. This type of bubble was smaller in the 7.15 wt%
solution than in the 3.00 wt% solution. In pure water, only large bubbles were observed and
no fine bubbles were detected.
Near the CHF (abbreviation of Critical Heat Flux) or the dry-out condition, the large bubbles
coalesced and formed an extended bubble that occasionally covered the heated surface.
However, when butanol solutions were used, the liquid layer seemingly covered the heated
surface again inside the bubble when such an extended large bubble appeared on the heated
surface. Numerous fine boiling bubbles were detected on the heated surface through the
extended bubble covering the heated area.
(a) Butanol aq.sol (3.00wt%)
(b) Butanol aq.sol (7.15wt%)
(c) Pure water
Fig. 20. Images of observed motion (T-junction mini tube made of quartz glass).
Evaporation, Condensation and Heat Transfer
480
Fig. 21. Boiling curves (T-junction mini tube made of quartz glass).
Boiling curves are shown in Fig. 21. Several well-known correlation lines are also shown for
reference: Rohsenow’s nucleate boiling relationship (Rohsenow, 1952), Zuber’s prediction of
CHF (Zuber, 1958) and Berenson’s film boiling relationship (Berenson, 1961). All of them are
detailed in standard textbooks (e.g. Carey, 1992) and their explanations are omitted here.
Rohsenow’s equation will be mentioned briefly in the next section.
CHF points or dry-out points are indicated for each fluid in Fig. 21. These points were
determined by finding the beginning of the decrease in the heat transfer coefficient when
viewed as a function of heat flux. After CHF points, the so-called post dry-out state was
detected. The CHF flux of the 7.15 wt% butanol solution was slightly lower than that of pure
water. This can be explained by the mechanism of the so-called degradation of the boiling
heat transfer of binary mixtures. A concentration of 7.15 wt% was considered large, and the
change in the saturated temperature, owing to alcohol evaporation, was large. On the other
hand, the CHF value of the 3.00 wt% butanol solution was approximately 30% higher than
that of pure water. The 3.00 wt% solution exhibited an interesting characteristic near the
CHF. Before reaching the CHF, heat transfer was remarkably enhanced, and the heat
transfer coefficient increased considerably, as shown in Fig. 21.
This characteristic is believed to be related to peculiar bubble behaviour near the dry-out
state, which requires further investigation. Note that the degradation of boiling heat transfer
did not occur strongly in the 3.00 wt% and 7.15 wt% butanol aqueous solutions. CHF values
of those solutions were approximately equal to those of pure water. However, that of the
3.00 wt% butanol solution was increased to some extent. The authors speculate that the
reason is that the combined thermocapillary and solutocapillary effects were active at
bubble surfaces.
4.2 T-junction mini tube made of polymer material
As mentioned in the previous section, the glass tube was useful for observing the overall
behaviour of boiling bubbles on the heated surface and detached and flowing bubbles in the
channel. However, in practical applications, fragile glass would be difficult to employ in real
High-Carbon Alcohol Aqueous Solutions and
Their Application to Flow Boiling in Various Mini-Tube Systems
481
systems. In most cases, a polymer material or metal would be used for small packaged
systems. Here, to simplify the heat transfer analysis, an insulating polymer material was
selected. Specifically, in studying the contribution of convective heat transfer, the insulating
wall can become a simple boundary condition. Figure 22 shows the test section made of
polyether ether ketone (PEEK) material, which has good heat resistance. A channel of a
cross-sectional area of 3 mm × 3 mm was made in the polymer plate. The channel was 100
mm long, and from its midpoint, a vertical channel that was 50 mm long was added for the
inlet flow. At the region in contact with the vertical inflow, a copper surface was installed.
The copper surface was the edge of a copper block having a similar structure to that
described in the previous section. Inside the copper block, a heater rod was inserted, and DC
power was applied to provide Joule heating. Near the edge, three thermocouples were
inserted to obtain the surface temperature, the temperature gradient and the heat flux, as in
the previous section. The heated surface that contacted the fluid was 3 mm × 10 mm in area.
Although bubble observation was not as simple as in the glass channel experiment, it was
enabled by incorporating a glass window near the heated surface, as shown in Fig. 22. A
video camera recorded images and transmitted data to a PC. At the inlet and outlet
positions of the test section, thermocouples were also installed to monitor the temperature.
Experimental conditions are shown in Table 5. Test fluids here were the 7.15 wt% butanol
aqueous solution and pure water.
Snapshots edited from the recorded video images are shown in Fig. 23. When pure water
was used, the heated surface was occasionally covered with a vapour blanket, as shown in
Fig. 23(b), and bubbles had a flattened shape. On the other hand, when the 7.15 wt% butanol
aqueous solution was used, boiling bubbles became much smaller and detached from the
heated surface smoothly, as shown in Fig. 23(a). The shape of bubbles in the butanol
solution was rather spherical and they moved smoothly on the heated surface before
detaching. The difference in shape was attributed partly to the difference in the contact
angle between the copper surface and the fluid. The contact angle between pure water and
the copper surface was 94
°, and that between the 7.15 wt% butanol aqueous solution and the
copper surface was 51
°, according to the authors’ measurements at 25 °C. Regarding the
bubble detachment and their movement in the butanol solution, the authors think that the
small contact angle and the Marangoni effect worked simultaneously.
Inlet
OutletOutlet
Glass
window
Inlet
OutletOutlet
Glass
window
Fig. 22. Test section (T-junction mini tube made of polymer material).
Evaporation, Condensation and Heat Transfer
482
Mass flow rate
(kg/s)
Mass flux
(kg/m
2
s)
Re
Subcooling
(K)
6.7 × 10
−5
7.4 78 20
Table 5. Experimental conditions (T-junction mini tube made of polymer material).
(a)Butanol aq.sol.(7.15wt%) (b)Pure water
Fig. 23. Behaviour of boiling bubbles (T-junction mini tube made of polymer material).
Figure 24 shows boiling curves; Rohsenow’s correlation line is shown for reference. Curve
obtained by Katto’s equation for single-phase convective heat transfer in two-dimensional
flow impingement (Katto, 1981) and that obtained by Hausen’s equation for single-phase
convective heat transfer in a simple tube (Hausen, 1943) are also shown.
Note that owing to technical difficulties with the experimental apparatus, these experiments
did not reach the dry-out condition. When the T-junction channel was used, the heat flux of
the butanol solution was approximately 1.2 times larger than that of pure water. This
difference was thought to be caused by the difference in bubble movement. The increase in
the heat flux when the butanol solution was used was not as dramatic in the experiment but
the degradation of the boiling heat transfer of binary mixtures was not observed, as in the
case of the T-junction mini tube made of quartz glass.
1.00E+04
1.00E+05
1.00E+06
1
.
00
E+
0
7
1.00E+00 1.00E+01 1.00E+02 1.00E+03
Straight (Pure water)
Straight (Butanol aq.sol.7.15wt%)
T-junction (Pure water)
T-junction (Butanol aq.sol.7.15wt%)
Rohsenow (Csf=0.013)
Katto
Hausen
Sup erheat[℃]
Heat flux[W/m
2
]
Fig. 24. Boiling curves (T-junction and straight mini tube made of polymer material).
As a comparison, the authors performed the same experiments with a straight channel.
These results are also shown in Fig. 24. It can be readily understood from the effect of the
impinging flow pattern that the heat flux in the straight channel was much lower than that
High-Carbon Alcohol Aqueous Solutions and
Their Application to Flow Boiling in Various Mini-Tube Systems
483
in the T-junction channel. Also, in the straight flow pattern, the heat flux in the butanol
solution was larger than that in pure water. Moreover, it is very interesting that the degree
of enhancement when the butanol solution was used was much greater in the straight
channel than in the T-junction channel. This suggests that the Marangoni effect influenced
boiling bubbles.
For comparison with well-known correlations, the authors plotted Rohsenow’s equation for
nucleate pool boiling, Katto’s equation for heat transfer with a single-phase impinging flow
and Hausen’s equation for convective heat transfer with a single-phase channel flow.
The authors adopted Rohsenow’s equation because the flow rate was very small in this
experiment, and thus, once strong nucleate boiling occurred, the boiling could be regarded
as nearly the same as pool boiling. Rohsenow’s equation is as follows.
1/0.33
0.67
0.7
Pr
ll sata
asf lll
kTl
h
lC L
ν
Δ
ρν
−
⎡⎤
⎛⎞
⎢⎥
=
⎜⎟
⎜⎟
⎢⎥
⎝⎠
⎣⎦
(3)
()
a
l
l
g
ν
σ
ρρ
=
−
(4)
Here,
h is the heat transfer coefficient, l
a
is the Laplace length, k
l
is the thermal conductivity
of the fluid and
ν
l
is its dynamic viscosity. L
lv
is the latent heat. Pr
l
is the Prandtl number of
the fluid,
g is the gravitational acceleration,
ρ
l
is the density of the liquid and
ρ
v
is that of the
vapour.
ΔT
sat
is the super heat of the wall. C
sf
is an empirical parameter describing the
combination of wall material and fluid. Here, the surface tension of the fluid,
σ is the value
of pure water at the saturated temperature and its temperature dependence is not included
so that we can represent properties of butanol solutions. A method of incorporating the
peculiar surface tension of butanol solutions remains to be studied in the future. The
resulting heat flux can be expressed as follows.
()
ws
q
hT T=−
(5)
Here,
q is the heat flux and h is the heat transfer coefficient. T
w
and T
s
are the wall
temperature and the saturated temperature, respectively. Katto’s equation is as follows.
()
0.4
0.570Pr
l
lwl
l
k
ux
q
TT
x
ν
∞
=− (6)
This equation applies only to two-dimensional flows. For reference, the deduced heat flux
was adopted only for comparison with the experimental data.
T
l
is the temperature of the
flow at the inlet,
∞
u
is the representative velocity of the flow and x is the distance from the
centre of the flow impingement. Hausen’s equation is as follows.
()
23
0.0668
3.66
10.04
zL l
wl
zL
Gk
q
TT
D
G
⎧⎫
⎪⎪
=+ −
⎨⎬
+
⎪⎪
⎩⎭
(7)
Originally, this equation is applied to round tubes. For application to the experiment in this
study, the deduced heat flux was adopted for comparison with the experimental data.
D is
Evaporation, Condensation and Heat Transfer
484
the effective diameter of the channel. G
zL
is the Graetz number, which can be defined as
follows.
Re Pr
zL D l
D
G
L
=
(8)
L is the length of the heated region. Re
D
is the Reynolds number, which is defined as follows.
Re
D
l
uD
ν
= (9)
Here,
u is the averaged velocity in the channel. As shown in Fig. 24, the measured heat flux
data were larger than values obtained by Katto’s and Hausen’s equations. This is because
experiments included boiling heat transfer as well as convective heat transfer. However, not
all the data seemed to obey Rohsenow’s curve although the observation apparently revealed
that weak nucleate boiling occurred. The authors think that the boiling in experiments was
so weak that the heat transfer caused by boiling did not contribute much to the entire heat
flux. New experiments in which the applied power can be increased to obtain both a strong
nucleate boiling and a dry out will be needed for further investigation. The authors are now
preparing such experiments to investigate the onset of the dry out and will report them in
the near future.
When the glass channel described in the previous section was used, the heat transfer
improved abruptly near the dry-out point, as shown in Fig. 21. The authors expect that
similar phenomena could occur in the polymer channel. Moreover, polymer material is
generally hydrophobic; therefore, bubbles are less likely to stick to the surface. Thus, once
boiling bubbles detach from the copper surface, they leave the copper surface smoothly and
maintain heat transfer caused by their motion. These issues must be examined in future
experiments.
Although the above limitation existed in the current data, the authors believe that
advantages of the butanol aqueous solution were clarified to some extent. In a prototype
system made of insulating polymer material, the butanol aqueous solution can be thought to
have the potential to enhance heat transfer in boiling with flow impingement inside mini
channels.
5. Conclusion
The authors have been performing various types of experiment to clarify and demonstrate
advantages of high-carbon alcohol aqueous solutions for boiling heat transfer inside mini
channels after confirming peculiar characteristics of the temperature dependence of surface
tension by their own measurements. Findings and conclusions to date can be summarized as
follows.
1.
To investigate the peculiar temperature dependence of the surface tension of butanol
and other high-carbon alcohol aqueous solutions, a static maximum bubble pressure
method was adopted, and measurements were performed. These measurements
revealed the nonlinearity of the surface tension of those solutions and provided more
reliable data than those obtained by Wilhelmy’s method.
2.
When a butanol solution was applied to a simple long mini tube of 1 mm in diameter,
the dry out was not delayed by using the solution. However, very unusual behaviour of
High-Carbon Alcohol Aqueous Solutions and
Their Application to Flow Boiling in Various Mini-Tube Systems
485
the liquid layer, namely an extending motion of the liquid layer to a hotter region, was
observed.
3.
When the heating region was localized in the mini tube to obtain a large temperature
gradient at the entrance of the region, the dry-out heat flux under a very small flow rate
was larger when the high-carbon alcohol aqueous solution was used. However, owing
to technical difficulties, this experiment had a heat flux of a very small order.
4.
A T-junction mini channel was studied because this flow pattern could increase the
temperature gradient around boiling bubbles remaining on the heated surface.
Experiments revealed that the use of butanol aqueous solutions increased the dry-out
heat flux somewhat in a T-junction channel made of glass. When a T-junction channel
made of polymer material was used, the heat flux before the onset of the dry out was
again somewhat increased by using these solutions.
As aforementioned, the authors are certain that high-carbon alcohol aqueous solutions can
induce peculiar motion in the liquid layer and boiling bubbles. However, the advantage in
heat transfer was not as dramatic and was limited to small values. On the other hand, some
examples of their good characteristics were reported in pool boiling and large heat pipes
(Abe, 2006a, 2006b). More modifications of flow conditions and flow patterns would be
needed for adaption to the small-scale environment of mini channels.
Another important issue requiring investigation is the mechanism of the Marangoni force
acting on boiling bubbles. As long as an alcohol aqueous solution is used, the
thermocapillary and solutocapillary forces will always coexist. In particular, when a butanol
solution is used, directions of the two forces are the same; therefore, it is not yet clear which
of the two forces is dominant in boiling bubbles. The authors began to observe the onset of
the Marangoni convection around a small air bubble in a butanol aqueous solution (Eda et
al., 2010). These results indicated a clear contribution of a peculiar thermocapillary force.
They now plan to clarify the contribution ratio of each capillary force in butanol aqueous
solutions.
6. Acknowledgements
The authors would like to thank Prof M. Shoji, Mr S. Nishiguchi, Dr T H. Yen, Dr F.
Takemura, Dr S. Matsumoto and Dr M. Tange for their helpful suggestions and aid in the
research. They are also grateful to Mr T. Yoshida, Mr T. Kaneko, Mr M. Otsuka, Mr Y.
Kumagai, Mr K. Kunimatsu, Mr K. Kawai, Mr T. Ueno and Mr Y. Nomura for their
assistance in the experiments and measurements. This research was partially supported by
the MEXT/JSPS, Grant-in-Aid for Scientific Research (C, No. 21560225).
7. References
Abe, Y. (2006a). Thermal management with self-rewetting fluids, J. Jpn. Soc. Microgravity
Appl.,
Vol. 23, No. 2 (2006), pp. 80–87.
Abe, Y. (2006b). Self-rewetting fluids,
Ann. N.Y. Acad. Sci. 1077 (2006), pp. 650–667.
Adamson, A.W. & Gast, A.P. (1997). Physical chemistry of surfaces, A Wiley-Interscience
publication (1997).
Azouni, M.A. & Petre, G. (1998).
J.Colloidal Int. Sci., 206 (1998), pp. 332–333.
Berenson, P. J. (1961). Film boiling heat transfer from a horizontal surface,
J. Heat Transfer,
Vol. 83, pp. 351, 1961.
Evaporation, Condensation and Heat Transfer
486
Carey, V. P. (1992). Liquid-Vapor Phase-Change Phenomena, (1992), Taylor and Francis.
Cheng, P. & Wu, H.Y. (2006). Phase-change heat transfer in Microsystems, 13th Inter-
national Heat Transfer Conference, Key Note-02, 13–18 August, Sydney, Australia.
Eda, Y., Kawai, K. & Ono, N. (2010). Observation of marangoni flow near the artificial air
bubble on heated surface in using alcohol aqueous solution, Seventh International
Conference on Flow Dynamics (1–3 November 2010, Sendai, Japan), Proceedings
pp. 448–449.
Hausen, H. (1943). VDI Z., No. 4, pp. 91, 1943, In: Heat transfer, Hallman, J.P., McGraw-Hill,
1976.
JSME Data Book: Thermophysical Properties of Fluids (1983), JSME (in Japanese).
Kandlikar, S.G. (2004). Heat transfer mechanisms during flow boiling in microchannels,
J.
Heat Transfer (Transactions ASME)
, 126 (2004), pp. 8–16.
Katto, Y. (1981). In: JSME Data Book: Heat Transfer, 5th Edition (2009), JSME (in Japanese),
pp. 33.
Legros, J.C. (1986).
Acta Astronautica, 13–11 December 1986, pp. 697–703.
Ono, N., Yoshida, T., Kaneko, T., Nishiguchi, S. & Shoji, M. (2009).
Journal of Thermal Science
and Technology
(JSME), Vol.4 (2009), No.2, pp.284-293.
Ono, N., Yoshida, T., Kaneko, T., Nishiguchi, S. & Shoji, M. (2008a).
Thermal Science and
Engineering
, Vol. 16, No.3 (2008), pp. 79–85.
Ono, N., Kaneko, T., Nishiguchi, S. & Shoji, M. (2008b).
Proceedings of IFHT2008, (2008),
Paper No. 200, CD-ROM.
Rohsenow, W.M. (1952). A method of correlating heat transfer data for surface boiling
liquids,
Trans. ASME, Vol. 74, pp.969, 1952.
Thome, J.R. (2006). Fundamentals of boiling and two-phase flows in microchannels, 13th
Inter-national Heat Transfer Conference, Key Note-14, 13–18 August, Sydney,
Australia.
Vochten, R. & Petre, G. (1973). Study of the heat of reversible adsorption at the air-solution
interface,
J.Colloidal Science, 42-2(1973), pp. 320–327.
Zuber, N. (1958). On the stability of boiling heat transfer,
Trans. ASME, Vol. 80, pp.711, 1958.
23
Heat Transfer and Hydraulic Resistance in
Rough Tubes Including
with Twisted Tape Inserts
Stanislav Tarasevich and Anatoly Yakovlev
Kazan State Technical University,
Russia
1. Introduction
The spiral and cross-section wire insertions, knurls of a various configuration, microfinning,
spherical, cylindrical, cone-shaped both other ledges and depressions, stamped surfaces etc.
refer to the heat transfer intensifiers allowing considerably to augment a heat transfer at
moderate or comparable growth of a pressure drop. The effect of a heat transfer
intensification on rough surfaces is attained due to the additional vortex generation leading
to raise of a turbulent diffusion in a conversion zone, to a turbulent kernel and due to
lowering of stability and width of a viscous boundary layer with molecular thermal
conduction at a surface. W. Nunner (1956) has determinated that in rough tubes at growth
of ledge height of a roughness the heat transfer factors it is more to 3 times than value in
smooth tubes. Intensifying agency of a roughness has been displayed in many subsequent
papers (Dipprey & Sabersky, 1963; Isachenko et al., 1965; Kolar, 1965; Sheriff et al., 1964;
Sheriff & Gumley, 1966; et al.).
Among artificially roughened surfaces there are surfaces with a continuous roughness (for
example, in the form of a thread) and with a discrete roughness (the roughness ledges pitch
considerably exceeds their absolute sizes). The discrete roughness is more often preferable
for heat transfer enhancement. However the continuous roughness of the outer and inner
surfaces of tubes also can be effective for raise of heat transfer, especially at boiling and
condensation (Berenson, 1962; Buznik et al., 1969; Danilova & Belsky, 1965; Ivanov et al.,
1988; Nishikawa et al., 1982; et al.).
The basic flow regularity in tubes with a continuous sand uniform granulous roughness has
been determined in the first half of 20th century (Nikuradze, 1933; Schlichting, 1979; et al.).
However the subsequent researches for tubes with a various uniform continuous "not sand"
roughness (organized by the single-start and multiple-start cross threads with triangular,
rectangular and rounded profiles, and also in the form of ring bores and spherical ledges
with passage and chess arrangement) have displayed considerable divergences with an
existing explanation of the action mechanism of a sand roughness and with theoretical
models of a boundary layer on a rough surface (Ibragimov et al., 1978; Isachenko et al., 1965;
et al.).
Thus intensity of a heat transfer and pressure drop in tubes with various aspects of
roughnesses is rather individually and also is defined by not only a relative height of
Evaporation, Condensation and Heat Transfer
488
elements of roughnesses, but their shape and disposing density on a surface. Therefore the
universal calculation dependences reflecting link of hydrodynamic and thermal flow
performances with geometrical parameters of a rough surface are absent while.
Along with rough surface intensifiers the one of effective ways of heat transfer enhancement
(especially at boiling) is a flow twisting which promotes liquid phase rejection to a heat
transfer surface. In this connection the hydrodynamics and heat transfer problems in
channels with a flow twisting together with rough surfaces call a great interest. Now the
combined affecting of a surface roughness and a flow twisting on a heat transfer is a little
examined.
2. Results of experimental investigations of heat transfer and hydraulic
resistance in rough tubes including those with twisted tape inserts
2.1 Heat transfer and hydraulic resistance in different rough tubes including those
with twisted tape inserts at water flow
2.1.1 Heat transfer and hydraulic resistance in different rough tubes at water flow
The experimental investigation of heat transfer was carried out into steel tubes with
continuous uniform roughness at water flow. Heat was supplied by passing electric current
directly through the tube wall. Distribution of wall temperatures on a tube surface was
defined by means of 28 thermocouples arranged on an outer surface of a tube.
The continuous transverse roughness of the tube was attained by threading with a different
depth of the thread in a stainless steel tube with the inner diameter d = 10.2 mm and length
L=500 mm, pitches of the thread t = 0.3…0.5 mm, and with the average height of the
protrusions Δ= 0.09…0.12 mm (photographs in Fig. 1). All the considered roughnesses had
deficient profile of thread and the shapes of ledges differed due to technological reasons
(Fig. 2).
Fig. 1. Photos of a tube with thread roughness (view in section)
Heat Transfer and Hydraulic Resistance in Rough Tubes Including with Twisted Tape Inserts
489
a b
c d
Fig. 2. Photos of the profiles of thread roughness: a) Δ=0,11 mm, t=0,3 mm; b) Δ=0,12 mm,
t=0,5 mm; c) Δ=0,09 mm, t=0,5 mm; d) Δ=0,17 mm, t=0,6 mm
On entry and exit of channel the rectilinear sections for flow stabilization have been installed
with inner diameter equal d and with relative length L/d=100.
Dependence of a dimensionless heat transfer of tubes with a various continuous roughness
on Reynolds number Re is presented on fig. 3 (Nu – Nusselt number, Pr
f
and Pr
w
- Prandtl
numbers at average temperature of flow and wall accordingly). Diameter of an equal
volume smooth tube was used as equivalent diameter d
e
in similarity numbers.
Experimental data have satisfactory qualitative conformity with experimental data of a
tubes with the full triangular profile thread roughness in observed range Re (Isachenko,
1965).
20000 40000 60000 80000 100000
50
100
150
200
250
300
350
Smooth tube (by calculation)
Δ=0.11 mm, t=0.3 mm (fig. 2, a)
Δ=0.12 mm, t=0.5 mm (fig. 2, b)
Δ=0.09 mm, t=0.5 mm (fig. 2, c)
Δ=0.17 mm, t=0.6 mm (fig. 2, d)
Nu/(Pr
f
0,43
(Pr
f
/Pr
w
)
0,25
Re
Fig. 3. Dependence of dimensionless heat transfer of rough tubes on Re
Evaporation, Condensation and Heat Transfer
490
As it has been noted the intensity of heat transfer and hydraulic resistance in tubes with
various aspects of roughness is rather individual and is defined not only a relative height
of roughness elements but their shape and disposing density on a surface. Therefore the
tube with rather smaller height of a roughness (with a profile shown in fig. 2, c) has a
higher heat transfer rate than a tube with higher roughness height (with the profile shown
in fig. 2, a). In a tube with relatively narrow dints between ledges (a profile photo in fig. 2,
a) the heat transfer growth in comparison with a smooth tube is manifested only at high
Reynolds numbers (at Re=80000 an increase in the heat transfer rate as compared to
smooth tube is 14 %). With increase of space between ledges the generation of vortexes is
augmented in each element, the penetration of a main stream into the gap between ledges
gain in strength as well as the interchanging of energy between vortexes and a main
stream (Ibragimov et al., 1978). Stability of vortexes in a gap is also downgraded, the
probability of their penetration into a flow kernel is augmented. At rather narrower and
deep dint between the ledges the vortex is inside the dint, while in another case the votex
structures leave a dint in a flow kernel, and the heat transfer is augmented. The heat
transfer rate in rough tube with the almost same ledge height but with a larger gap
between ledges (the profile photo in fig.2, b) is 1.7 times higher in comparison with a
smooth tube in all observed range of Re.
The experimental data presented in fig.3 can be described by the next relationship:
⎛⎞
⎜⎟
⎝⎠
n
0.25
f
0.43
f
w
Nu
= С ×Re
Pr
Pr
Pr
. (1)
The gained factors C and n are presented in table 1.
Roughness
Δ
, mm
t, mm n С
Fig.2, a 0.11 0.3 0.91 0.0067
Fig.2, b 0.12 0.5 0.8 0.035
Fig.2, c 0.09 0.5 0.84 0.021
Fig.2, d 0.17 0.6 0.94 0.0077
Table 1. Generalizing factors
Generalizing dependence has not been gained since the shapes of a roughness profile
essentially differ.
In tubes with the relatively narrow dints (with a profile in fig. 2, a and in fig.2, d) the extent
of agency of a Reynolds number (factor n) is more that is linked with various developing
process of a roughness with increase in number Re: the agency of roughness ledges with
narrow dints is poorly expressed at relatively small Reynolds number and augmented with
growth of Re.
In a tube with the large pitch between ledges the factor of hydraulic resistance ξ
(ξ=2ΔP/(ρV
2
)⋅d
e
/L, where ΔP - pressure drop, ρ - mass flow density, V - average flow
velocity, L/d
e
- relative length of the channel) is also appreciable higher (fig.4).
In this case, a comparable increase in the heat transfer rate and hydraulic resistance as
against a smooth tube (Nu
0
and ξ
0
) is observed at Re=10000…20000. With the further
increase of Re the hydraulic resistance grows livelier (fig. 5).
Heat Transfer and Hydraulic Resistance in Rough Tubes Including with Twisted Tape Inserts
491
10000 100000
0.02
0.03
0.04
0.05
0.06
0.07
0.08
Smooth tube (by calculation)
Δ=0.11 mm, t=0.3 mm (fig. 2, a)
Δ=0.12 mm, t=0.5 mm (fig. 2, b)
Δ=0.09 mm, t=0.5 mm (fig. 2, c)
Δ=0.17 mm, t=0.6 mm (fig. 2, d)
ξ
Re
Fig. 4. Dependence of hydraulic resistance factor of rough tubes on Re
10000 20000 30000 40000 50000 60000 70000 80000
0,4
0,5
0,6
0,7
0,8
0,9
1,0
Δ=0.11 mm, t=0.3 mm (fig. 2, a)
Δ=0.12 mm, t=0.5 mm (fig. 2, b)
Δ=0.09 mm, t=0.5 mm (fig. 2, c)
Δ=0.17 mm, t=0.6 mm (fig. 2, d)
(Nu/Nu
0
)/(ξ/ξ
0
)
Re
Fig. 5. Thermohydraulic efficiency of rough tubes
Evaporation, Condensation and Heat Transfer
492
2.1.2 Heat transfer and hydraulic resistance in different rough tubes with twisted tape
inserts at water flow
For a flow twisting in rough tubes with roughness profiles shown in fig. 2 the twisted tape
(width is 0.7 mm) was inserted into tube. The tapes have been covered by a high-
temperature varnish for creation of electric isolation with a channel wall. Relative pitches
of a tape twisting at turn on 180
0
was S/d=2.5 … 6 (a photo shown in fig. 6). Hereinafter
at machining of experimental data the similarity numbers paid off using equivalent
diameter of the equal volume smooth tube taking into account a tape insert (in a tube
cross-section).
Fig. 6. Tapes with a minimum (S/d = 2.5) and maximum (S/d = 6) relative pitches of twisting
Presence of the twisted tape insert in a tube with a uniform continuous roughness leads to
a heat transfer intensification (fig. 7, 8). In a tube with relatively large pitch between
ledges the twisting effect decreases with growth of Reynolds number Re (fig. 8), i.e. the
twisting a little suppresses the turbulent perturbations which oscillate by roughness
ledges.
6000 8000 20000 40000 60000 80000
50
100
150
200
250
300
Re
Nu/(Pr
0.43
(Pr
f
/Pr
w
)
0.25
)
without tape
S/d=6
S/d=3.5
S/d=2.5
Fig. 7. Heat transfer in a tube with uniform continuous roughness (Δ=0.11 mm, t=0.3 mm,
shown in fig. 2,а) and twisted tape inserts
Heat Transfer and Hydraulic Resistance in Rough Tubes Including with Twisted Tape Inserts
493
6000 8000 20000 40000 60000 80000
50
100
150
200
250
300
Re
Nu/(Pr
0.43
(Pr
f
/Pr
w
)
0.25
)
without tape
S/d=2.5
S/d=3.5
S/d=6
Fig. 8. Heat transfer in a tube with uniform continuous roughness (Δ=0.12 mm, t=0.5 mm,
shown in fig. 2, b) and twisted tape inserts
This is also confirmed by investigations of heat transfer in a tube with a discrete (by
knurling) roughness (the photo shown in Fig. 9) and with an inserted twisted tape (Fig. 10).
A negative effect of flow twisting on heat transfer in a discretely rough tube is noted. The
macro vortexes appearing in the channel with twistig suppress the mechanism of flow
turbulization in a discretely rough channel. It leads to a decrease in the heat-transfer rate.
Thus, the use of twisting to intensify heat transfer can be inadvisable at relatively high
ledges of roughness which considerably turbulize the flow area near the wall.
a) b)
Fig. 9. Photos of a discretely rough tube: a) outside view; b) sectional view
From the results of comparing the rate of heat transfer from rough and smooth tubes with
an identical twisted tape insert (fig. 11) the same specific features were noted as in tubes
without a tape (fig. 3): in a tube with a relatively large pitch between the ledges a
considerable increase in the heat transfer rate is observed in the entire range of Re; in a tube
with a small pitch an increase in the heat transfer rate is insignificant and manifests itself
only at high Re.