Nuclear Power System Simulations and Operation Part 10 pot
Bạn đang xem bản rút gọn của tài liệu. Xem và tải ngay bản đầy đủ của tài liệu tại đây (3.21 MB, 15 trang )
Nuclear Power - System Simulations and Operation
124
The release of fission products from fuel-clad gap into primary coolant involves clad failure.
A model describing pallet oxidation, subsequent enhancement of diffusivity and bubble
formation at grain boundaries, their interlinkage and release into open surfaces, was
developed by Koo et al [13]. This model is stochastic in nature and incorporates inherent
randomness of the underlying physical phenomenon using Monte Carlo method. While the
prediction based on this model are in good agreement with the corresponding experimental
measurements in the linear heating regime, strong under-predictions have been reported for
the remaining regime. The Ivanov’s model [14] gave good description of various processes
involved in the release of FPs from the porous ceramic fuel, its leakage from clad and
mixing with the primary coolant. Theoretical predictions based on this model have been
reported in good agreement with the corresponding experimental data.
Combined failures based model has been developed by Clink and Freeburn [15] which was
employed in an on-line coolant activity monitoring system. Such systems carryout estimation
of failed fuel fractions in non-destructive manner. Normally, these systems are designed for
constant power, steady state operational conditions. The Clinck and Freeburn model was
observed to under-predict failed fuel fractions even for steady-state operation [16].
A theoretical model has been developed by Tucker and white [17] for the estimation of FPs
from ceramic UO
2
fuel. In this model, first, the probabilities of leakages of FPs from fuel
interior through grain-edge tunnel pore to outer portions are figured out. These
probabilities strongly depend on the interconnectivity of pores in the ceramic fuel. A good
agreement has been reported between theoretical predictions made by using this model and
the corresponding experimental measurements.
2. FPA simulation codes
In view of the importance of the FPA for normal operation as well as for accidental
scenarios, various computer programs have been developed for its estimation. They fall into
two basic categories:
• Point depletion codes
• Fission Product Transport Codes
• Empirical
• Semi-Empirical
• Mechanistic
The point depletion codes carryout production, buildup, decay and depletion calculations
for a wide variety of radionuclides in the core region. As such, they provide reliable
estimates of radioisotope inventory in the reactor fuel. They typically ignore spatial details
while retaining spectral details of the neutron field. The widely used WIMS computer code
[18] for 1-D transport theory macroscopic group constant generation employs 69-group
library along with DSN or Stochastic methodology. It performs details buildup, depletion
and burnup calculations for 35 distinct fission products along with one pseudo, lumped
fission product. The WIMS code does not perform any further radionuclide transport
calculations. The CASMO-4 [19] and DRWIN [20] also belong to the same pin/cell based
macroscopic group constant generation codes as WIMS and as far as fission products are
concerned, they are limited to radionuclide inventory calculations for the fuel region.
The ORIGEN2 computer code [21] provides extensive radionuclide inventory calculations
for 950 fission products along with 120 actinides in point-wise buildup and depletion
manner. While one can manually remove or add radionuclides in refueling options, no
Recent Trends in Mathematical Modeling and Simulation of
Fission Product Transport From Fuel to Primary Coolant of PWRs
125
attempt is made in the code for the radionuclide transport calculations. An evolved version
called MONTEBURNS [22] incorporates spatial details in the depletion/buildup
calculations by coupling the ORIGEN2 code with the multipurpose radiation transport code
MCNP [23].
The radionuclide transport code category is comprised of three types of computer codes:
empirical, semi-empirical and mechanistic codes. In the empirical codes, various data fitting
techniques are used for development of empirical models from detailed experimental
observations. One advantage of this strategy is that no prior knowledge is required regarding
the details of the underlying physical processes involved. At the same time, it gives most
accurate results in the sense that they match the experimental results. Consequently, they
are extensively used in risk assessment and safety analysis. Lumping of parameters and
grouping of similar elements simplifies many features of these codes and adds to their
computational efficiency. The MELCOR [24] and CORSOR [25] codes belong to the empirical
radionuclide transport class of computer programs. While being highly efficient and reliable,
the empirical codes are valid only in a limited range of parameters.
The limitations of the empirical models are relaxed somewhat by incorporating detailed
modeling for a part of the simulation while the remaining part is attempted by using
empirical approach. The FIPREM [26] computer code attempts fission product transport
problem by using empirical Booth equivalent sphere model while detailed diffusion theory
based finite difference model is employed for fission product transport into gap region.
The VICTORIA [27] and ECART [28] computer codes, being mechanistic in nature, do not
face strict limits of validation. They carryout simulation of radionuclide transport in much
broader range of accidental scenarios starting from releases, to dispersion and subsequent
deposition. Since these computer programs were specifically designed for accident analysis,
therefore, they cannot be used in normal steady-state or in transient cases.
Most of the available computer programs for transport analysis of fission product activity
are focused on accidental analysis. For the analysis of fission product transport in the steady
state and in transient analysis FPCART-ST computer code has been developed. The details
regarding the mathematical modeling, computer implementation and results of simulations
carried out using this code are provided here.
3. Kinetic modeling
In these work, a 300 MW(e) PWR has been considered with design specifications as
provided in Table 1. The primary circuit of a typical PWR with various indicated essential
components is shown in Fig. 1. The reactor is taken with zero levels of FPA in the primary
circuit at the start ( 0t
=
). The FPA levels in Fuel/Gap/Coolant=F/G/C is governed by the
following set of ODEs:
For the fuel region:
[]
1
,
,,
1
i
Fi
ii
jj
F
j
ii i Fi
j
dN
FY P f N v N
dt
λλσφ
−
−
=+ −++
∑
, (1)
for the gap region:
[]
1
,
,, ,
1
i
Gi
iFi i
jj
G
j
iiiGi
j
dN
vN f N Dє N
dt
λλσφ
−
−
=+ −++
∑
(2)
Nuclear Power - System Simulations and Operation
126
and, for the coolant region:
1
,
,, ,
1
i
Ci
i
iGi i
jj
C
j
iiCi
j
dN
L
Dє NfNQ N
dt W W
η
λλ βτσφ
−
−
⎡⎤
=+ +++++
⎢⎥
⎣
⎦
∑
. (3)
where, ‘i’ indicates the isotope in the decay chain consisting of four isotopes:
1,2, ,4i = .
The values of various parameters used in these simulations are listed in Table 2.
In order to compute the saturation values of various radioisotopes in the fuel, gap and
coolant regions one can use the following analytical results:
For coolant region:
1
,, ,
1
i
sat sat sat
Ci i Gi ij j Cj i i i i
j
QL
NDє NfN
mm
λληβτσφ
−
−
⎡
⎤
⎡⎤
=+ ++++
⎢
⎥
⎢⎥
⎣⎦
⎣
⎦
∑
, (4)
For gap region,
[
]
1
,, ,
1
i
sat sat sat
Gi i F
j
i
jj
G
j
iii
j
NvN fN Dє
λ
λσφ
−
−
⎡
⎤
=+ ++
⎢⎥
⎣
⎦
∑
, (5)
and for fuel region:
[
]
1
,,
1
i
sat sat
Fi i i
jj
F
j
ii i
j
NFYP fN v
λ
λσφ
−
−
⎡
⎤
=+ ++
⎢⎥
⎣
⎦
∑
. (6)
Parameter Value
Specific power (MWth/Kg. U) 33
Number of fuel assemblies 194
In-let coolant temperature (
o
C) 293
Out-let coolant temperature (
o
C) 329
Power density (MWth/m
3
) 102
Fuel pins (rods) per assembly 264
Fuel material UO
2
Clad material Zilcoloy
Lattice pitch (mm) 12.6
Fuel pin outer diameter (mm) 9.5
Coolant pressure (MPa) 15.5
Coolant flow rate (Mg/s) 18.3
Linear heat rate (kW/m
3
) 17.5
Average enrichment (%) 3.0
Core height (m) 4.17
Core diameter (m) 3.37
Table 1. Design data of a typical pressurized water reactor [37]
Recent Trends in Mathematical Modeling and Simulation of
Fission Product Transport From Fuel to Primary Coolant of PWRs
127
Fig. 1. A three dimensional perspective view of a typical PWR primary system with the
pressure vessel, heat exchanger, primary pump and pressurizer indicated
Parameter Value
V (cm
3
)
1.485×10
9
L (g/s)
2.3
Q (g/s)
470
D
2.5×10
-3
W (g)
1.072×10
9
β
0.001
F (Fissions/W.s)
3.03×10
10
P
o
(MW
th
)
998
τ
0.056
Table 2. Values of different operational parameters used in simulations [37]
Nuclear Power - System Simulations and Operation
128
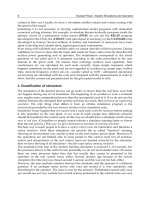
3.1 Deterministic computational methodology
Various step involved in the transport of fission products, starting from their release in the
fuel matrix, their transport from ceramic pores into the fuel-clad gap, their leakage from clad
into the primary coolant, and subsequent removal by leakages, by filters, by radioactive
decay etc., is depicted in Fig. 2. The FPA transport model has been implemented in the
computer program FPCART. It uses LEOPARD
[29] and ODMUG [30] programs as
subroutines. The cell averaged multigroup group constant generation is carried out by the
LEOPARD subroutine while the group fluxes are found by solution of one-dimensional
diffusion equation in the ODMUG subroutine. In the FPCART code, the system of
governing ODEs: Eqs. (1) upto (3) are solved numerically using Runge-Kutta (RK) method
in this program. The RK-numerical provides efficient time domain solution yielding static as
well as dynamic values of FPAs corresponding to about 50 different dominant fission
products.
Fig. 2. Block diagram of the fission products production and removal mechanism in the
primary circuit of a typical PWR
The computational cycle starts with initialization of the variables with 0
t
=
. The group
constants are generated by the LEOPARD while the group flux are found using ODMUG.
The values of FPAs in the fuel, gap and in primary coolant are initialized as zeros for the
Recent Trends in Mathematical Modeling and Simulation of
Fission Product Transport From Fuel to Primary Coolant of PWRs
129
cold clean core. In the time loop, the values of FPAs for about 50 different radionuclides are
calculated using RK-scheme for each next time step. The results are stored in separate data
files for each fission product chain and for each region. The program allows performing
these calculations for power as well as flow rate perturbations.
3.2 Power perturbation model
The FPCART computer code has built-in model for linear power perturbations. This model
uses a rate parameter
α representing the time rate of change of reactor power. Then, for a
time range
[
]
,
in m
tt the reactor power is calculated using:
0
() ()Pt Pf t= (7)
where,
[]
20
1,
() 1 ,
in
minm
m
tt
f
tttttt
ww tt
α
≤
⎧
⎪
=− − ≤≤
⎨
⎪
>
⎩
(8)
Where
α is slope of the linear change of reactor power;
t
in
is start of reactor power perturbation;
t
m
is end of the reactor power.
3.3 Flow-rate perturbation model
The flow rate perturbation involves primary pump modeling where the balance of angular
momentum with the frictional deceleration yields
[31] :
2
1
2
f
dv
lCv
dt
ρ
ρ
=−
, (9)
where, l is the total length of the loop;
ρ
is the fluid density; C
f
represents total pressure
loss coefficient; and v is the fluid speed. The Eq. (9) yields the corresponding solution as
flow rate w(t) is:
0
() 1
p
wt w tt
⎡
⎤
=−
⎣
⎦
, (10)
where,
0
w represents the steady state value of flow rate; and
(
)
0
2
pf
tlCv= which is
typically around 2000 h for transients without boiling crisis.
4. Stochastic release model
The release of fission products from fuel pins is essentially a random process as the time of
clad failure, the amount of release as well as the duration of fission product release cannot
be specified exactly beforehand. In order to model these aspects in more realistic manner,
Monte Carlo based stochastic approach has been used in these simulations. The modified
version FPCART-ST is primarily deterministic-stochastic hybrid code. The sampling of fuel
pin failure probability distribution function g(t) yields the fuel pin failure time sequence.
The intensity function
()t
ψ
is correspondingly:
Nuclear Power - System Simulations and Operation
130
() () ()tgtGt
ψ
=
, (14)
where, the cumulative probability distribution ()Gt :
(
)
0
() exp ()
t
Gt
g
sds=−
∫
, (15)
serves the normalization. According to the standard rejection technique [??] the probability
of accepting a fuel failure at t
k
after t
j
is found by using a random number ‘
η
’ and
comparing it with the ratio ‘q’:
()
()
k
j
gt
q
gt
=
, (16)
and, if
q
η
< , this step is repeated otherwise, t
k
is accepted as a fuel failure event time. The
fuel matrix to gap escape rate coefficient takes the form:
[
]
00 0 0
exp ( )
F
є D є tt Dє
ξ
=−−+ (17)
where,
0
є is the starting value of burst release rate from a punctured fuel rod;
ξ
represents
the characteristic decay constant for the escape rate ;
0
t is time at which the fuel rod fuel rod
failure starts;
F
D represents the current number of failed fuel rods while
0
1D = is flag for
the failure of the current fuel rod. Typical values of these parameters are:
51
7.2 10 s
ξ
−−
=×
81
0
10є s
−−
= ; 60D =
5. Results and discussion
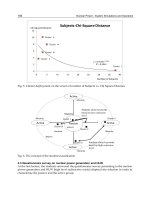
5.1 Buildup of fission products in steady-state
The FPCART computer code has been used for the simulation of fission product buildup to
steady state saturation values starting with a cold clean core. For a 300 MW(e) typical PWR,
the predictions of the FPCART program have been compared with the widely used
ORIGEN2 computer code and excellent agreement between the corresponding values has
been found. The observed small difference, of the order of a few percent only, can be
attributed to difference in the yield of the fission products. The results are shown in Fig. 3.
The results indicate dominance of
131
I,
134
Te,
133
I and
135
I in the saturation values of fission
product activity in the fuel matrix.
5.2
135
Xe activity under step and ramp power transients
With largest absorption cross section,
135
Xe acts as dominant poison in nuclear reactors. At
the start of operation, the
135
Xe levels are zero which climb to saturation levels with time
which depend on the power level and time behavior of reactor power during this period.
FPCART simulations have been carried out for the study of
135
Xe transients for step and
ramp power transients. The results are shown in
Fig. 4. The ramp power transients lead to
somewhat slower rise to saturation levels as compared with the step power changes. For
post-scram time periods, the
135
Xe levels rise to maximum values; which is followed by
gradual decrease.
Recent Trends in Mathematical Modeling and Simulation of
Fission Product Transport From Fuel to Primary Coolant of PWRs
131
Fig. 3. For steady state operation, FPCART predicted saturation values of activities of various
isotopes in PWR fuel with the corresponding computed data using the ORIGEN2 code [35]
Fig. 4. FPCART simulated variation of
135
Xe specific activity with time for step and ramp
power transients
Nuclear Power - System Simulations and Operation
132
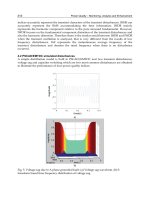
5.3 Fission product activity under pump coast-down
The pump-coast down belongs to general class of flow rate transients. During these
transients, the core residence time, and total circuit time along with the effective neutron
flux values are influenced by the change in flow rate. A decrease in flow rate leads to
increase in the fission product activity values. In this study, fifteen different radionuclides
belonging to fission products and their decay chains were selected and their approach
towards saturation levels was studied under constant power. The pump coast-down was
initiated when the levels reached sufficiently close to saturation levels. The corresponding
results are shown in
Fig. 5 where the isotope-wise as well as total activity variations are
shown after the pump coast-down. It is observed that
133
Xe is the main contributor having
over 40% of total activity. This is followed by
135
Xe,
131M
Xe and
129
Te contributing 12.9%, 11%
and 8.2% of the total activity respectively. During the pump coast-down period, the total
activity level raises well over 8.6% level before the loss-of-flow signals the reactor shutdown.
Fig. 5. FPCART simulated primary coolant total activity due to fission products of a 1000
MWth PWR for a 2000
p
th
=
pump coast-down flow rate transient [36]
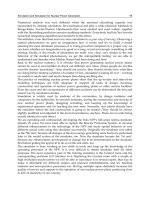
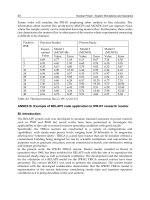
5.4 FPCART simulations of FPA under power transients
For validation of the three stage deterministic computational methodology of the FPCART
computer code, its predictions were compared against actual experimental data. In the case
of BEZNAU (Unit 1)
[32] , the FPCART computed time variation of
131
I for various power
variations during the first cycle have been compared with the corresponding experimental
measurements. It is clear from
Fig. 6 that FPCART predictions are in good agreement with
the experimental data throughout time range. A similar trend has been observed in the case
of
131
I activity in the ZORITA [32] power plant where again the FPCART predictions have
been found in good agreement with the corresponding experimental measurements as
shown in
Fig. 7.
Recent Trends in Mathematical Modeling and Simulation of
Fission Product Transport From Fuel to Primary Coolant of PWRs
133
Fig. 6. For power transients, FPCART predicted values of 131I specific activity variations with
time compared with the corresponding experimental data for the BEZNAU (Unit-1) power
plant
Fig. 7. For power transients, FPCART predicted values of
131
I specific activity variations with
time compared with the corresponding experimental data for the ZORITA power plant
Nuclear Power - System Simulations and Operation
134
5.5 Stochastic simulations of FPA
A typical PWR has large number of fuel pins arranged in fuel bundles. They can fail at any
time due to a wide variety of causes/ reasons. Their failure is essentially a random
phenomenon. Therefore, stochastic techniques are well suited for the failure modeling. In
this work, a time sequence of their failure has been generated by sampling time dependent
intensity function. The escape of fission product and their siblings have been modeled using
three step deterministic model of FPCART.
Fig. 8. For power transients, FPCART predicted values of
131
I specific activity variations with
time compared with the corresponding experimental data for the ANGRA-1 power plant [37]
The Westinghouse designed ANGRA-1
[33] (657 MWe) nuclear power plant was shut-down
prematurely in the 4
th
cycle due to abnormally high levels in the primary coolant. As
suspected, one sixth of its core had failed resulting in leakage of fission products and their
daughters into the primary coolant stream. The first 22 days of this event have been
simulated using the stochastic FPCART-ST computer code. For
131
I activity, the predicted
values for 70% power levels remain within 15% from the corresponding experimental
measurements. Keeping in view the complex nature of the event being simulated, the
predictions show good agreement. For larger variations in power level, deviations are found
in the predictions which may be attributed to variations in the flow rate that have not been
included in this model. The
131
I activity spikes found in experimental data remain smeared
in the predicted data requiring further investigation regarding couples flow-rate & power
transients.
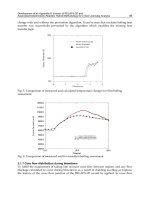
The EDITHMOX
[34] experiments, given in the OECD/NEA/IAEA IFPE database, were
considered for validation of the FPCART-ST computer code. These experiments are part of a
broad experimental program conducted a the France’s Siloe research reactor. The
EDITHMOX experiment was conducted at the Jet Pompe water loop. Release rates of
Recent Trends in Mathematical Modeling and Simulation of
Fission Product Transport From Fuel to Primary Coolant of PWRs
135
various fission products were studied for mixed-oxide fuel under various conditions of
burnup and operating power. The FPCART-ST predicted time variation of
85
Kr activity for
various power levels has been found in good agreement with the corresponding
experimental data available from the EDITHMOX experiment. As shown in
Fig. 9, the
agreement prevails over most of the measured time while some deviations are observed for
the first large power drop. This may be attributed to coupling of power transients with flow-
rate perturbations which has been ignored in these simulations.
Fig. 9. For power transients, FPCART predicted values of
89
Kr specific activity variations
with time compared with the corresponding experimental data for the EDITHMOX-1
(Unit-1) power plant
[37]
6. Conclusions
The normal operation as well as during the accidental situations, the fission products and
their daughters play a dominant role toward potentially imparting high levels of exposure
to radiation workers and general public. A review of research effort devoted to modeling
and simulation of fission product activity in the primary circuits of typical PWRs has been
presented in this work. While the mechanistic models have been found superior in the
context of the range of applicability against the empirical and semi-empirical models, the
available computer codes are limited to accidental release modeling generally.
Development of methodology for estimation of FPA levels in the primary loops of PWRs
during normal steady-state as well as transient conditions has been carried out in this work.
The aim of this effort is to model FPA releases into primary coolant in the steady state, as
well as in power and flow-rate transients. For this purpose multi-step model has been
presented in this work that tracks fission product transport from fuel to fuel-clad gap and
finally to the primary coolant. The influence of filters, ion-exchanges, leakages, decay etc.
Nuclear Power - System Simulations and Operation
136
has been incorporated in this model. For randomly failing fuel pins, stochastic modeling has
been carried out for burst releases. The coupled deterministic-stochastic hybrid approach
has been found effective for large scale fuel failure events.
The trends towards core life-time extensions and high burn-up cores, coupled with aging of
the existing fleet of nuclear reactors; it has become imperative to limit fission product
activity to much lower levels. This is required in order to keep PWRs economically feasible
against their competitors.
7. Nomenclature
Symbol Represents
,Xi
N
Number of i
th
radionuclide atoms in the region:
Fuel (X=F), Gap (X=G) and Coolant (X=C)
φ
Neutron flux (#/cm
2
.s)
i
η
Resin purification efficiency for the i
th
radionuclide
Q
Let-down flow rate (g/s)
i
v
Escape rate coefficient of the i
th
radionuclide
i
σ
Microscopic absorption cross section for the i
th
radionuclide
i
Y
Fission yield of the i
th
radionuclide
i
j
f
Branching ratio
(
)
i
j
→ in the i
th
chain
β
Bleed-out fraction of the primary coolant for boron chemical control
L
The coolant leakage rate (g/s)
W
The total primary coolant mass (g)
i
λ
Decay constant of the i
th
radionuclide (s
-1
)
F
Average fission rate (fissions/W.s)
P
Thermal power of reactor (W)
D
Failed fuel fraction (#)
τ
Core-to-circuit primary coolant resident time ratio (#)
D
F
Number of failed fuel rods
ξ
Characteristic decay constant for the escape rate (
1
s
−
)
8. References
[1] IAEA, Nuclear power reactors in the world, Reference Data Series No. 2, International
Atomic Energy Commission, IAEA-RDS-2/30, Vienna, 2010.
[2] S. Rippon, History of the PWR and its worldwide development, Energy Policy, 12(3),
(1984) 259-265.
[3] C. J. Wood, Recent developments in LWR radiation field control, Progress in Nuclear
Energy, 19(3), (1987), 241—266.
[4] G. C. Comley, The significance of corrosion products in water reactor coolant circuits,
Progress in Nuclear Energy, 16(1), (1985) 41—72.
Recent Trends in Mathematical Modeling and Simulation of
Fission Product Transport From Fuel to Primary Coolant of PWRs
137
[5] D. H. Lister, Corrosion-product release in Light Water Reactors, EPRI Report NP-3460,
March (1984).
[6] T. Moore, The challenge of nuclear fuel reliability, EPRI, J. (Fall) (2005).
[7] H. Zänker, H. Müller, R. Berndt, A complementary cesium coolant concentration ratio for
localizing defective PWR fuel rods during reactor operation, J. Radioanalytical and
Nuclear Chemistry, 152(1), (1991) 47—54.
[8] G. F. Huang, L. L. Tong, J. X. Li, X. W. Cao, Study on mitigation of in-vessel release of
fission products in severe accidents of PWR, Nuclear Engineering and Design,
240(11), (2010) 3888-3897.
[9] Y. Pontillon, G. Ducros, P. P. Malgouyres, Behaviour of fission products under severe
PWR accident conditions VERCORS experimental programme—Part 1: General
description of the programme, Nuclear Engineering and Design, 240(7) (2010) 1843-
1852.
[10] K. Y- Hyun, S. D- Seong, Y. Y- Ku, An analysis method for the rod gap inventory of
unstable fission products during steady-state operation, J. Nuclear Materials, 209(1)
(1994) 62-78.
[11] B. J. Lewis, A generalized model for fission product transport in the fuel-to-sheath gap
of defective fuel elements, J. Nucl. Materials, 175(3) (1990) 218-226.
[12] M. Barrachin, R. Dubourg, M. P. Kissane, V. Ozrin, Progress in understanding fission-
product behavior in coated uranium-dioxide fuel particles, J. Nucl. Materials, 385(2)
(2009) 372-386.
[13] Y. H. Koo, D. S. Sohn, Y. K. Yoon, Release of unstable fission products from defective
fuel rods to the coolant of a PWR, J. Nuclear Materials, 209(3), (1994) 248—258.
[14] A. S. Avanov, The model of the fission gas release out of porous fuel, Annals of Nuclear
Energy, 25(15), (1998) 1275—1280.
[15] L. Clink, H. Freeburn, Estimation of PWR fuel rod failure throughout a cycle, Trans.
Am. Nucl. Soc., 54(1), (1987), 13.
[16] J. D. B. Lambert, K. C. Gross, E. V. Depiante, Adaptation of gas tagging for failed fuel
identification in light water reactors, Proc. ASME 4
th
Intl. Conf. Nuclear
Engineering. CONF-960306-25, (1996).
[17] M. O. Tucker, R. J. White, The release of fission products from UO
2
during irradiation, J.
Nuclear Materials, 87(1), (1979) 1—10.
[18] M. J. Halsall, A summary of WIMSD4 input options, Atomic Energy Establishment,
Winfrith, Dorchester AEEW-M-1327, (1980).
[19] D. Knott, B. H. Forssén, M. Edenius, CASMO-4, A fuel assemblyburn-up program
methodology, STUDSVK/SOA-95/2, (1995).
[20] A. Tsilanizara, DARWIM: An evolution code system for a large range of applications, J.
Nucl. Sci. Technol, 37, (2000) 845—849.
[21] A. G. Groff, ORIGEN2: A versatile computer code for calculating the nuclide
compositions and characteristics of nuclear materials, Nucl. Technol., 62 (1983)
335—352.
[22] W. S. Charlton, R. T. Perry, B. L. Fearey, T. A. Parish, Calculated actinide and fission
product concentration ratios for gaseous effluent monitoring using MONTEBURNS
3.01, Nucl. Technol., 131 (2000) 210—227.
[23] J. F. Briesmeister, (ed.), MCNP—A general Monte Carlo N-particle transport code,
User’s manual: Los Alamos National Laboratory, LA–13709–M, (2000).
Nuclear Power - System Simulations and Operation
138
[24] R.M. Summers, et al., MELCOR 1.8.0: A Computer Code for Nuclear Reactor Severe
Accident Source Term and Risk Assessment Analyses, NUREG/CR-5531, SAND90-
0363 (1991).
[25] M. R. Kuhlmann, D. J. Lehmicke, R. O. Meyer, CORSOR user’s manual, Battelle
Columbus Labs. USNRC Report NUREG/CR-4173, (1985).
[26] C. Ronchi and C. T. Walker, Determination of Xenon Concentration in Nuclear Fuels by
Electron Microbe Analysis, J. Phys. D: Applied Physics, 13, (1980) 2175.
[27] T. J. Haemes, D. A. Williams, N. E. Bixler, A. J. Grimley, C. J. Wheatley, N. A. Johns,
N. M. Chown, VICTORIA: A mechanistic model of radionuclide behavior in the
reactor coolant system under severe accident conditions, Sandia National
Laboratory, Albuqurque, NM 87185, NUREG/CR-5545, (1990).
[28] F. Parozzi, "Computer Models on Fission Product and Aerosol Behavior in the LWR
Primary System, Part II," Commission of the European Communities, EUR Report #
14676 EN, (1992).
[29] R. F. Barry, LEOPARD: A Spectrum Dependent Non-Spatial Depletion Code for IBM-
7094, WCAP-3269-26, Westinghouse Electric Corporation (1963).
[30] Thomas, J. R., Edlund, H. C., Reactor Statics Module - Multigroup Criticality
Calculations, Proc. Conf. ICTP, Trieste (1980).
[31] E. E. Lewis,
Nuclear power reactor safety, John Wiley & Sons, (1977).
[32] WEC, Source term data for Westinghouse Pressurized Water Reactors, Westinghouse
Electric Corporation, Pittsburg, Pennsylvania WCAP-8253, May (1974).
[33] IAEA, Fuel failure in water reactors: Causes and Mitigation, IAEA-TECDOC-1345, June
(2002).
[34] C. Baud, D. Parrat, CEA-DMECN, Complete rendu DTP/SECC No. 41/93, Center
d’Etudes Nucleaires de Grenoble, (1982).
[35] M. J. Iqbal, N. M. Mirza, S. M. Mirza, Kinetic simulation of fission product activity in
primary coolant of typical PWRs under power perturbations, Nuclear Engineering
and Design 237(2), (2006) 199—205.
[36] S. M. Mirza, M. J. Iqbal, N. M. Mirza, Effect of flow rate transients on fission product
activity in primary coolant of PWRs, Progress in Nuclear Energy, 49 (2007) 120—
129.
[37] M. J. Iqbal, N. M. Mirza, S. M. Mirza, Stochastic simulation of fission product activity in
primary coolant due to fuel rod failures in typical PWRs under power transients, J.
Nuclear Materials, 372 (2008) 132—140.