Deploying RFID Challenges Solutions and Open Issues Part 3 pdf
Bạn đang xem bản rút gọn của tài liệu. Xem và tải ngay bản đầy đủ của tài liệu tại đây (4.43 MB, 30 trang )
RFID Components, Applications and System Integration with Healthcare Perspective
47
15. RFID connecting model
It has been investigated in section 9 and 10 that as technology evolves each time, tags and
hardware increase their performance for better RFID use. Although it is recommended in
figure 14, that the vendor can minimize the complexity at the technological level with
consistent technological upgrades. However, there is no single standardization is available
at technical level and it is very difficult to achieve standardization at technical level too. Due
to lack of standardization it is difficult to rely on one technological solution. In that case,
future technological upgrade may affect application (see section 13 & 14) usability and
application may not compatible with new technological upgrades. However, adoption of
new advancement in technology is also good for better performance. So, it is better to adapt
middle level approach, in which RFID solutions should not stop adaption of new
technological advancement and also does not affect application interface. Especially in the
case of healthcare application interfaces because healthcare applications their interfaces and
integration are really complex. Moreover healthcare applications are significantly big and
need major investment. However, it improves overall organisational performance with
resource optimization significantly.
This research uses RFID for context management and support practitioners knowledge in
real-time environment. Practitioners need constant support with appropriate level of
knowledge management interface. Section 14 discusses the various application need to use
RFID hardware for constant update of equipment, notes and other stuff within healthcare
for better overall healthcare management which is necessary for patient processes. In this
connection, a RFID connecting model for healthcare applications is developed, it supports
RFID application interface should not affect if RFID solution adapts RFID technology
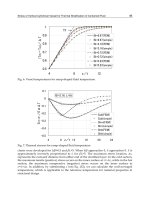
change or upgrade. Figure 17 shows this model, it provide the flexibility to RFID
applications to adopt future technology advancements without changing frontend.
Fig. 17. Hospital RFID application model
It is feasible for staff and healthcare processes to work through the same interface layer. The
interface layer should not need changing due to the integration layer which is based on
patient centred application and healthcare services, and use RFID engine. The foundation of
Deploying RFID – Challenges, Solutions, and Open Issues
48
engine interface is based on RFID plug-ins and component integrator. In component layer
each management scheme utilizes various types of tags, readers and hardware. Each
component such as drugs management, theatre equipment management can use the same or
different implementation logic. However, it provides feasibility and flexibility for
interaction with healthcare interface through variable set of plug-ins and component
integrator (technical procedures). This model further provide the feasibility to integrate all
management schemes appropriately for better patients process management which can
minimize the error and improvement the performance with resource optimization.
16. Conclusion
This chapter considered the RFID components with its potential alternatives and possible
healthcare applications. The present research defines and analyses the most important RFID
components (tag and reader) with its’ alternatives and its use in various situations. It is
conceived that RFID is very important for resource optimisation, increasing efficiency
within organisational processes, providing enhanced service, and making organisational
staff overall experience better. The research observed various cases in healthcare settings
and analyses the complexity of healthcare processes. However, it is pragmatic to put RFID
for healthcare objects’ (e.g. notes, equipments and drugs etc.) tracking for improved
healthcare service with optimised use of resources.
The first part of this chapter has explained and described the RFID technology and its
components, and the second part has discussed the main considerations of RFID technology
in terms of advantages and study model. The last part explores RFID technology
applications. This chapter considers RFID technology as a means to provide new capabilities
and efficient methods for several applications. For example, in healthcare, access control,
analyzing inventory information, and business processes. RFID technology needs to develop
its capability to be used with computing devices. This allows businesses to get real potential
benefits of RFID technology. This study facilitates adoption of location deduction
technology (RFID) in a healthcare environment and shows the importance of the technology
in a real scenario and application in connection with resource optimization and improving
effectiveness. However, there is no doubt in the future that many companies and
organisations will benefit from RFID technology especially healthcare.
17. Acknowledgment
We would like to thank the hospital management and NHS Trust chair for allowing us
access to the hospital for our research. We are grateful to all the hospital staff: managers,
surgeons, doctors, IT managers, IT developers, nurses and ward staff for their support and
time in providing us with information about patients’ movements for medical treatment
within the hospital. The resulting knowledge and analysis has provided a useful foundation
for our research in exploiting the RFID usability for healthcare.
18. References
Application Notes CAENRFID, (2008), Introduction to RFID Technology, CAENRFID: The
Art of Identification
RFID Components, Applications and System Integration with Healthcare Perspective
49
Bharadwaj, V., Raman, R., Reddy, R. & Reddy, S., (2001), Empowering mobile healthcare
providers via a patient benefits authorization service, WET ICE 2001. Proceedings.
Tenth IEEE International Workshops on Enabling Technologies: Infrastructure for
Collaborative Enterprises, IEEE.
Bohn, J., (2008), Prototypical implementation of location-aware services based on a
middleware architecture for super-distributed RFID tag infrastructures, Personal
Ubiquitous Computing, ACM, 12 (2):155-166.
Connecting for health,
/nhsmail/using [access: 11th October, 2009].
Connecting for health, [access: 18th August,
2010].
DHS (Department of Homeland Security) , (2006), Enhanced Security Controls needed for
US-Visit’s System using RFID Technology, U.S. Department of Homeland Security
(Office of Inspector General), available at: www.dhs.gov/xoig/assets/mgmtrpts
/OIG_06-39_Jun06.pdf, OIG-06-39.
DH-UK, [access: 30th September, 2009].
Frank, T., Brad, H., Anand, M., Hersh, B., Anita, C. & John, K., (2006), RFID Security, ISBN:
1-59749-047-4.
GAO (Government Accountability Office), (2005), Information Security: Radio Frequency
Identification Technology in the Federal Government, Report to Congressional
Requesters, US. Government Accountability Office, available at:
www.gao.gov/new.items/d05551.pdf, GAO-05-551.
Garfinkel, S. & Rosenberg, B., (2005), RFID Application, Security, and Privacy, ISBN: 0-321-
29096-8.
Glover, B. & Bhatt, H., (2006) RFID Essentials, O’Reilly Media, Inc, Sebastopol, ISBN 0-596-
00944-5.
Intermec, (2009), ABCs of RFID: Understanding and using radio frequency identification,
White Paper, Intermec Technologies Corporation, available at:
ermec. com/eps_files/eps_wp/ABCsofRFID_wp_web.pdf
[access: 3rd January, 2010].
Meiller, Y. & Bureau, S. (2009), Logistics Projects: How to Assess the Right System? The Case
of RFID Solutions in Healthcare, Americas Conference on Information Systems
(AMCIS) 2009 Proceedings, Association for Information Systems.
Narayanan, A., Singh, S. & Somasekharan, M., (2005), Implementing RFID in Library:
Methodologies, Advantages and Disadvantages, Scientific Information Resource
Division, IGCAR, Kalpakkam, Government of India, available at:
. in/readit-2005/conpro/lgw/s5-8.pdf [access: 15th
February, 2010].
NHS-UK, px [access: 11th October, 2009].
Parks, R., Yao, W. & Chu, C. H., (2009), RFID Privacy Concerns: A Conceptual Analysis in
the Healthcare Sector, Americas Conference on Information Systems (AMCIS) 2009
Proceedings, Association for Information Systems.
Sandip, L., (2005), RFID Sourcebook, IBM Press, ISBN: 0-13-185137-3.
Schwieren1, J. & Vossen, G., (2009), A Design and Development Methodology for Mobile
RFID Applications based on the ID-Services Middleware Architecture, Tenth
Deploying RFID – Challenges, Solutions, and Open Issues
50
International Conference on Mobile Data Management: Systems, Service and Middleware,
IEEE Computer Society.
Shepard, S., (2005), RFID Radio Frequency Identification, McGraw-Hill, ISBN:0-07-144299-5.
Srivastava, L., (2005), RFID: Technology, Applications and Policy Implications, Spectrum
Management Workshop, International Telecommunication Union, available at:
Watson, M., (2006), Mobile healthcare applications: a study of access control, Proceedings of
the 2006 International Conference on Privacy, Security and Trust: Bridge the Gap
Between PST Technologies and Business Services, ACM, article no. 77, DOI:
Zeisel, E. & Sabella, R. (2006), RFID+ Exam Cram, Pearson, Series 2, ISBN: 0-7897-3504-0.
3
Development of a Neonatal Interactive
Simulator by Using an RFID Module
for Healthcare Professionals Training
Loreana Arrighi, Jenny Cifuentes, Daniel Fonseca,
Luis Méndez, Flavio Prieto and Jhon J. Ramírez
Universidad Nacional de Colombia
Colombia
1. Introduction
This chapter of the book presents the experience and achievements attained in a project
carried out by the National University of Colombia which is intended to design and
implement tools for training students in medical and nursing techniques applied on
neonatal patients. The main result to be shown in this chapter is a virtual and physical tool –
based on RFID technologies – that simulates pathologies in neonates in order to teach
students the correct use of medications by means of umbilical vein catheterization based on
the medical interpretation of the patient’s symptoms. In addition, professor’s and student’s
testimonies are shown referencing their experience with the tool in the generation of
different medical scenarios of diagnosis and in the application of dosification techniques.
This chapter is organized as follows: the project justification is presented in Section 2 along
with other projects already carried out in this line of research; in Section 3, the design and
the implementation is presented; next, in Section 4, the results are exposed and finally the
conclusions and recommendations are stated by the authors.
2. Justification and background
2.1 Justification and problem definition
Around 100 million babies are born every year worldwide and approximately 10% of them
need some assistance to start breathing; 1% of the total requires intensive resuscitation
efforts such as endotracheal intubation and thoracic massages (Murphy & Halamek, 2005).
In neonatology, undesirable events that emerge from medical practice can have a negative
impact on the neonate’s formation and growth. Hence, medical and nursery personnel
training and learning processes with real patients carried out before become a decisive
factor when saving lives and guaranteeing adequate prognosis.
The traditional learning method has two stages: the theoretical knowledge and clinic
experience. The limitations of those stages are illustrated in Table 1: the class environment is
characterized by being extremely theoretical and by the lack of realism and the clinical
setting is where at some point apprentices refine his or her abilities with live patients but
associated with a high risk for their health. In addition, clinics are compelled to ensure
Deploying RFID – Challenges, Solutions, and Open Issues
52
optimal treatment for their patients from the very first moment they are admitted (Hayes,
1994; Lynöe et al, 1998).
Class Environment
It is characterized by being passive in its learning opportunities
It is focused on teaching instead of learning
Lack of realistic signals, distractions or pressure
Incapable of preparing the apprentice adequately for a real environment
Clinical Environment
Exposes patients to some degree of risk
Learning opportunities are random
Learning is limited by the swiftness of the moment, pressure and high inherent cost
Table 1. Limitations of traditional methods (Halamek, 2008)
Tools that have led to a new way to teach and learn based on Medical Simulation (Murphy
& Halamek, 2005 ); Ostergaard et al, 2004 ; Ziv et al, 2006
) by using computational tools and
mannequins are being used to avoid experimenting with real patients and overcome the
limitations of conventional medical training
Simulation with training equipment allows saving lives and improving quality of life since
medicine students can acquire skills and key competences such as the appropriation of new
knowledge, making fast and safe decisions, and the acquisition of clinical experience in
environments similar to those that take place in real emergencies.
Nevertheless, one of the greatest challenges of the simulation and the use of mannequins is
that the condition of a real patient changes throughout time depending on the quality and
swiftness of the diagnostic and the treatment; in contrast mannequins are stable and the
pathology evolution is left to the imagination of the doctor or nurse because the symptoms
are difficult to simulate in the dummy.
Even though the quality of simulators that can be acquired in the market is excellent, there
are some disadvantages such as their high costs and that the controllers which allow
practicing the development of pathologies cannot be used because they differ from the
Colombian health sector conditions. The medicine faculty of the National University of
Colombia has developed its own philosophies, methodologies and technical approaches to
diagnose and to follow schemes under adverse conditions like those found in healthcare
centers in any region in Colombia. Nevertheless there is an important barrier to teach and
learn because commercial simulators do not allow the presentation of these philosophies,
methods and techniques developed in this institution. (Currea, 2004)
On top of that, many of the commercial simulators have limited communication
infrastructures among the different elements of such simulators; such is the case of wired
connections to exchange data between the controllers and mannequins that can be replaced
by radio frequency technologies and radio identification (RFID).
Due to the importance of the topic and the mentioned limitations, a variety of tools for medical
simulation have been developed in the present project by members of the Master in Industrial
Automation of the National University of Colombia using dynamic models that allow the
generation of diverse biomedical signals of a neonate in order to work with a more real
perception. In addition, a virtual and a physical tool for the simulation of neonatal pathologies
has been created based on RFID technology in order to teach students the correct way to
Development of a Neonatal Interactive Simulator by
Using an RFID Module for Healthcare Professionals Training
53
administrate medications through the umbilical cord based on the medical interpretation of
the patient’s symptoms which are recreated by virtual reality using animated graphics.
2.2 The medical simulation: context and background
A simulator is an artificial representation of the real world giving the enough fidelity to
achieve a specific goal in the learning process (Halamek et al, 2000 ; Ostergaard et al, 2004;
Rall & Dieckmann, 2005) .
Medical Simulation is also defined as the imitation of a real thing, situation or medical
process for the practicing of skills and resolution problems (Halamek, 2008). It is a recent
method for learning among healthcare areas, and it reduces the gap between cognitive skills
and clinical experience.
In general, medical simulation has been structured into 5 categories; see Table 2, according
to the method proposed by David Gaba (Small et al, 1999) : verbal, standardized patients,
body parts trainers, computerized patients and electronic patients.
Category Characteristics
Verbal Simulation
It is based on knowledge communication by using role
plays.
Standardized Patients
Actors that perform and evaluation, for instance, on the
way to obtain clinical data, the necessary skills to carry
out physical checkups as well as communication and
professionalism.
body parts trainers
Anatomical models of body parts showing a normal
state or representing any illness or problem.
Computerized patients
Interactive patients that can be either software-based or
part of an internet-based world.
Electronic Patients
These are software applications that operate over a
virtual reality or a mannequin and the clinical
environment mimicked is integral.
Table 2. Schemes of medical simulation
The main advantages of simulators are (Halamek, 2008 ; Murphy & Halamek, 2005 ;
Ziv et
al, 2006
) :
• It does not generate any risk to the patients due to it reduces the error probability or
undesirable events in human beings.
• It allows practice without interferences and interruptions.
• It facilitates feedback from both the professor and training environment to the student.
• Simulations can be organized in convenient moments for both trainees and trainers.
• It can be scalable in intensity in order to know the needs of apprentices in all levels of
experience.
• It allows the practice of unusual routines and situations.
• It promotes the integration of cognitive, technical and behavioral skills.
• It facilitates the training of students into multidisciplinary teams.
• It promotes the use of multiple learning strategies.
• It facilitates an objective evaluation for each student.
Deploying RFID – Challenges, Solutions, and Open Issues
54
Simulation has been formally used in medical training in the last decades. Nevertheless,
representation of signs and symptoms referenced in the literature or in the theater can be
actually considered as the predecessors of non-technical simulation. Application of this tool
was delayed because of high costs and lack of rigorous testing which generated skepticism
as well as resistance to change (Ziv et al, 2006) . Some of the most relevant predecessors of
simulators for medical training are presented in the following sections.
2.2.1 Computerized simulators
Computerized simulation in the medical area started in 1960 with a graphic communication
system (Khalifa et al, 2006). Computers facilitated the mathematical description of the
human physiology and pharmacology as well as the worldwide communication and the
design of virtual worlds (Smith & Daniel, 2000). This resulted in the development of a
virtual reality prototype for medical training in which the user was represented by an avatar
which was capable of handling its virtual instruments and carrying out medical procedures.
This platform allowed several users and multiple modules of simulation that allowed the
creation of a shared virtual environment (Stanfield et al, 1998); in this latter aspect, N T and
Smith and the colleges from California University used their experience in cardiovascular
physiology and anesthetics to develop “Sleeper” which was the precursor of the current
BodySim® designed for practicing resuscitation (Cooper & Taqueti, 2004). Years later,
MicroSim® would be released to the market; a CD-ROM of Laerdal intended to provide
structured training in medical emergencies (Perkins, 2007).
Currently, all the branches of surgery including general surgery (McCloy & Stone, 2001),
urology (Hoznek et al, 2003), neurosurgery (Spicer & Apuzzo, 2003), gynecology (Letterie,
2003), and orthopedic surgery (Tsai et al, 2001) have made use of virtual reality in one way
or another. In addition, anesthesiology and other medicine subspecialties oriented to
procedures such as gastroenterology, lung science and cardiology that have been included
in the area of virtual reality (Gillies & Williams, 1987).
2.2.2 Physical simulators
Mannequins to teach obstetric skills and reduce high mortality in infants were patented in
1960 (Buck, 1991). In particular, Resusci Annie®, Laerdal’s emblematic product; is one of the
first landmarks in the history of medical simulation because even when it was initially
designed for mouth to mouth respiration, it subsequently evolved by integrating a spring in
its chest to allow cardiopulmonary resuscitation.
The first patient simulator at human scale was called Sim 1® and it was built by the
University of California. Some features of this simulator include pupils that can dilate, jaw
that can open, eyes that can blink, respiratory movements and heart beat synchronized with
temporal and carotid pulse (Cooper & Taqueti, 2004).
Gaba built the Comprehensive Anesthesia Simulation Environment (CASE) prototype in
1986 en Stanford. Similar to other innovations, its high cost limited the acquisition of the
mannequins to a reduced quantity in medical centers. Several European centers developed
their own computerized mannequins for simulation. ACCESS®, Sophus® and Leiden® are
three examples of inexpensive simulators developed worldwide (Chopra et al, 1994). After,
the KISMET® simulator (1993) introduced distant-surgery, which initially had low realism
in quirurgic simulations but was quickly improved parallel to the progress in technical
elements and computer power. The partial mannequin Simulator-K was developed to assess
cardiac abilities (1990) (Takashina et al, 1990).
Development of a Neonatal Interactive Simulator by
Using an RFID Module for Healthcare Professionals Training
55
At the same time, UltraSim® reproduced the relevant abdominal pathology in obstetrics and
gynecology; then, the ophthalmic training system evolved into virtual reality with EYESI®
produced by VRMagic; this one was initially designed as a simulator of vitreoretinal surgery
and then it became the learning tool of a deeper ophthalmic quirurgic procedure (Khalifa et
al, 2006).
The first training program based on simulation of neonatal resuscitation was developed in
Standford University by the mid 90’s (Halamek et al, 2000); then, Gaumard Scientific
Company produced a mannequin of a neonate capable of simulate cyanosis.
2.2.3 Electronic simulator
A computer application was developed by the end of the 90’s which enabled remote
observation and control of the most relevant signals for the neonates monitoring (cardiac
frequency and skin color), and also, a virtual model of the patient was implemented in
which the vital signals could be controlled by an external Java application (Korosec
et al, 2000).
In the year 2000, Laerdal presented SimMan®; it was the first human-scaled portable
mannequin designed to train the skills and performance on resuscitation scenarios. This
model also generates heart bits, mimics respiration and blood pressure and allows the
trainer to develop and to edit his or her own scenarios or reuse preset scenarios (Perkins,
2007).
Then, SIMA adopted a new approach and introduced a personal computer, software, a
monitor and 8 training scenarios. Currently, SimBaby® is the simulator used for training
neonatal resuscitation which includes the software and a technologically advanced and
interactive mannequin.
These commercial simulators have excellent quality but present some disadvantages; among
them are the high cost (Halamek, 2008) and the fact that there are special training centers
needed that at the same time require instruments, monitors, mannequins and technical
personnel to control and supervise training (Korosec et al, 2000).
3. Proposed design for the neonatal pathologies simulator
Taking into account the characteristics of the models presented in Section 2, and in order to
build a tool for both Medicine and Nursery students to acquire skills in diagnosing neonatal
patients, an interactive simulator has been designed. This device consists of a screen that
allows the instructor to program the health status of a patient by modifying its vital signs to
create different pathologic and non-pathologic scenarios; then students are asked to define
what they believe should be the appropriate treatment.
The vital signs are simulated because they are the main indicators that reflect the
physiological status of vital organs (brain, heart and lungs) which immediately express the
functional changes in the organism. The vital signs are the measure of different variables:
cardiac frequency, pulse, respiratory frequency, blood pressure (systolic, diastolic and
average) and temperature. Nevertheless, literature also recommends complementing these
parameters with other useful measurements such as Pulse-Oximetry.
Acquiring the ability to interpret in an adequate and opportune way those physiological
parameters (vital signs) is essential in medical training as it helps healthcare professionals
and first aid personnel in selecting an appropriate treatment among the different choices.
Determining and analyzing vital signs is very important during an emergency where many
Deploying RFID – Challenges, Solutions, and Open Issues
56
patients arrive with a huge variety of clinical conditions, especially for neonatal patients
whose symptomathology cannot be described thoroughly. Healthcare students must learn
how to choose the correct medicine and dose according to the patient’s particular
symptoms. The minimum increase of a dose or the wrong medicament injection can be very
prejudicial for an infant, it also can cause dead in extreme cases. Hence, a mannequin has
been adapted to identify some medicines that trainees apply via umbilical vein
catheterization and to show the health status after the treatment.
Figure 1 shows the graphic scheme of the neonatal pathologies simulator its main elements
are: a graphic interface that shows the vital signs and allows selecting the medication, an RFID
medicines programmer, a syringe applicator, a mannequin that identifies medications and a tool to
acquire data.
Fig. 1. Graphic of a virtual and physical simulator of a neonatal patient
In a training scenario, students and instructors must do the following: the instructor changes
the vital signs of the patient (frequency and maximum and minimum values) through the
graphic interface that shows the vital signs such as: ECG, pulse, pulmonary pressure and CO2
and O2 levels. In this way, the instructor can modify the health status in order to generate
diverse medical scenarios. Subsequently, the student has to choose the applying medication
and its dose once the diagnostic has been carried out through the same graphic interface.
The data of the medication and its dose chosen by the student for treating the patient are
sent by an RFID programmer connected to the computer to the fields of an RFID Tag that is
attached to the syringe (see Figure 1). In addition, the mannequin has an RFID reader
embedded in its abdomen to receive the data stored in the Tag when the syringe is
approached to the identifier by the student.
Once the described process is carried out, the vital signs of the patient are automatically
modified by the software in the mannequin according to the chosen treatment. In this way, a
new health condition is presented to the student as a feedback indicating whether the choice
of medication and dose has been the correct one or not. The neonate’s condition is reported
continuously to the computer by using an acquisition tool implemented with wireless
Development of a Neonatal Interactive Simulator by
Using an RFID Module for Healthcare Professionals Training
57
communication between the emitting module in the mannequin and the receptor in the
computer. In this way the patient’s health is constantly monitored not only by watching the
mannequin but also it can be seen in the graphic interface.
The mannequin produces cardiac sounds. It also recreates the skin flushing and, by an LCD
screen, it is possible to see its rectal temperature and cardiac frequency.
4. Theoretical foundations
In this chapter is presented the previous investigation made about the vital signs which are
relevant to accurately make a diagnostic over a newborn’s health as it would happen in real
life. Numeral 4.1 summarizes the main medical signals that were simulated: ECG, cardiac
frequency, pulse, respiratory frequency, arterial pressure and levels of CO2 and O2, among
others.
The selected medicines to be used in the system are shown in numeral 4.2 as well as some
parameters such as the supply method and affected variables. These medicines can change
the health status of the newborn which will be immediately reported to the computer where
the instructor can evidence the decision made by the trainee considering the changes in vital
signs and appearance.
4.1 Variable monitoring
Intensive care units were created due to the need of exhaustive and strict monitoring of
patients with high risk pathologies. The current status of a patient is assessed by watching
and continuously recording the physiological and pathophysiological parameters and then
their evolution as result of the therapeutic applied by watching the hemodynamics.
Nowadays, monitoring patients is an important part of all medical care due to it allows
watching the progress of a patient and guarantees an early detection of adverse events or
late recovering.
In Figure 2 the variables that were simulated in this project are presented.
Fig. 2. Diagram of the virtual simulator of a neonate patient (Software)
Deploying RFID – Challenges, Solutions, and Open Issues
58
4.1.1 ECG Signal y cardiac frequency
Signal morphology
The heart is the central structure of the cardiovascular system. Contraction of any muscle is
associated with electrical changes called “depolarization”; those changes can be detected by
electrodes located on the body surface. Although the heart has four chambers, from the
electric point of view it has only two as the two auricles contract together with the two
ventricles (Hampton, 2008).
The muscular mass of the auricle is smaller than the one of the ventricles and in thus, the
electrical change produced by the contraction of the auricles is also small. The contraction
of the auricle is associated with the “P” wave of the ECG signal. The ventricular mass is
large which generates a high deflection of the ECG signal when the ventricles are
depolarized; that wave is called the QRS complex. The “T” wave of the ECG signal is
associated to the returning of the ventricular mass to its electrical state – repolarization
(See Figure 3.a).
The diagnostic of the diverse pathologies is done based on the analysis of the following
characteristics of the ECG signal (see Figure 3.b) (Resiner & Clifford, 2006):
• Cardiac frequency (Heart Rate): the number of heart bits or pulsations is commonly the
ventricular frequency. The normal range for an adult is between 60-120 bpm; for a
newborn it fluctuates between 100 to 160 bpm.
• Regularity: R-R and P-P intervals are analyzed in search for anomalies.
• P Waves: Size, shape and position are analyzed.
• QRS waves (complex): Size, shape and position are analyzed.
• T Waves: Size, shape and position are analyzed.
• PR, QRS and QT intervals: These are analyzed and compared to standard ranges.
• U Waves: These waves are normally invisible, that is, their presence is symptom of
anomaly.
The implemented mathematical model
In order to generate the synthetic signal, the dynamic model adapted from MsSharry
(MsSharry et al, 2003) was used; this model generates a trajectory in a tridimensional space
(3D) with (x, y, z) coordinates. The quasi-periodicity of the ECG signal is shown by the
movement of the trajectory along a limit cycle of unitary radius in the (x, y) plane. Each
revolution of this cycle corresponds to a heartbeat.
The different points in the ECG (P, Q, R, S and T) are described as attractors or repulsors,
positive or negative in the z direction; these are placed with fixed angles along the unitary
circle given by: P , Q, R, S and T (MsSharry et al, 2003). The Dynamic equations of
movement are given by a set of ordinary differential equations (Equations 1, 2, 3).
xxy=α −ω
(1)
y
yx=α −ω
(2)
2
2
2
0
{,,,,}
()
i
i
b
ii
iPQRST
zaezz
Δθ
−
∈=
=− Δθ − −
(3)
Development of a Neonatal Interactive Simulator by
Using an RFID Module for Healthcare Professionals Training
59
Fig. 3. a) Heart depolarization and repolarization (Jones, 2005), b) Characteristics of the ECG
signal (Resiner & Clifford, 2006)
Deploying RFID – Challenges, Solutions, and Open Issues
60
Where:
22
1 x
y
α= − + (4)
()
()mod2
ii
Δθ = θ − θ π (5)
()
arctan ,
y
xθ=
(6)
Yω is the angular frequency of the trajectory; time, angles, a and b values for a normal child
can be found in (MsSharry et al, 2003).
Angular speed is obtained from the power spectrum of the signal given by the sum of
Gaussian distributions described in the Equation 7.
22
12
22
12
22
12
22
12
() ()
22
22
()
ff ff
cc
cc
Sf e e
−−
σσ
ππ
=+ (7)
With
1
0,1f = ,
2
0,25f = and standard deviations
1
0,01c = y
2
0,01c = (MsSharry et al,
2003).
The synthetic signal was obtained in LabView ®, as can be observed in the Figure 4.
Fig. 4. Synthetic ECG signal
4.1.2 Pulse signal
Signal morphology
When the heart beats, it generates a pulse wave caused by expansion of the arteries by the
circulating blood. This signal has a rounded initial peak that smoothly decreases to a sharp
Development of a Neonatal Interactive Simulator by
Using an RFID Module for Healthcare Professionals Training
61
depression called "dicrotic notch" that occurs as a result of abrupt closure the aortic valve,
finally descending to the diastole (see Figure 5.a). This particular waveform is due to the
overlapping between a pressure wave, which starts from the heart to the periphery and the
other, reflected at the bifurcation of the descending aorta (see Figure 5.b).
Fig. 5. a) Morphology of the pulse signal (Jones, 2005), b) Composition of the pulse signal
(Vanetta & Gomez)
The Elasticity and status of arterial walls determine the size and shape of those waves. The
pulse wave measures the speed at which blood travels throughout the vascular system. A
slow or obstructed movement of the blood flow means slow transference of nutrients to the
cell. This condition might result, among other things, in high blood pressure, lack of energy,
low metabolism, loss of memory and can affect negatively the immune system.
In general, the following can be identified by analyzing the characteristics of the pulse signal:
•
Premature levels of ageing and stress of the vascular system
•
Efficiency of heart pumping
•
Arterial elasticity and obstruction levels of large and small arteries
•
Early signs of cardiac stress
The implemented mathematical model
In order to generate the synthetic signal a mathematical model was used, this model
generates a trajectory in a tridimensional space (3D) with (x, y, z) coordinates. Each
revolution of this cycle corresponds to a heartbeat. The waves that compose the signal are
Deploying RFID – Challenges, Solutions, and Open Issues
62
described as attractors or repulsors, positive or negative in the z direction; these are placed
with fixed angles along the unitary circle The Dynamic equations of movement are given by
a set of ordinary differential equations (Equations 8, 9, 10).
xxy=α −ω
(8)
y
yx=α −ω
(9)
2
2
2
0
{,}
()
i
i
b
ii
iRI
zaezz
Δθ
−
∈=
=− Δθ − −
(10)
Where:
22
1 x
y
α= − + (11)
()
()mod2
ii
Δθ = θ − θ π (12)
()
arctan ,
y
xθ=
(13)
The synthetic signal obtained can be observed in Figure 6
Fig. 6. Synthetic Pulse signal
4.1.3 Arterial pressure
Morphology of the signal
Blood pressure is the force that blood exerts against the arteries’ walls. This variable
depends on the volume of blood in the vessels and the distensibility of the walls. If the
Development of a Neonatal Interactive Simulator by
Using an RFID Module for Healthcare Professionals Training
63
volume of blood that enters the arteries equals the exiting volume in a period of time, the
arterial pressure remains constant. Nevertheless, during the ventricular systole (contractions
of the ventricles) a high volume of blood enters the arteries while only a third is expelled
towards the arterioles. During diastole (heart relaxing after a contraction) there is no blood
entering the arteries although there is a continuous amount of blood going out caused by
the elastic recoil of the blood vessel walls. The maximum pressure exert on the arteries
while the blood is expelled during systole is called “systolic pressure”. The minimum
pressure on arteries when the blood is drained to the rest of vessels during diastole is called
“diastolic pressure”. The pulse pressure is the difference between the systolic pressure and
the diastolic pressure; finally, the mean pressure is the average of the pressure during the
whole cardiac cycle (Sherwood, 2010) (see Figure 7).
Fig. 7. Components of the arterial pressure wave (Sherwood, 2010)
In practice, arterial pressure is expressed as the systolic pressure over diastolic pressure.
Values produced by those measurements and their limits (meaning hyper or hypotension)
are relative and depend on each patient and their inherent factors; nevertheless, it is
established that a normal reading for an adult patient could reach up to 135/90 mmHg.
In contrast between 140/90 mmHg and 160/110 mmHg there would be mild
hypertension. If the result is above these values, it would indicate a severe hypertension.
On the contrary, values under 100/60 mmHg would represent hypotension or low arterial
pressure. Values of arterial pressures in newborns vary significantly compared to those of
the adults and are defined by variables such as gestational age, weight and postnatal age,
among others.
The implemented mathematical model
In order to obtain the blood pressure signal, the linearized and improved cardiovascular
physiology model presented by Beneken has been used (Beneken, 1965). This hydraulic
model of 10 compartments describes:
systemic and pulmonary circulation (see Figure 8).
The model accepts changes in blood volume and intrathoracic pressures as inputs, and
generates the pulmonary and systemic pressures as outputs. Blood pressure is calculated for
the model of each compartment (Equation 14), the input flow (Equation 15) and the volume
Deploying RFID – Challenges, Solutions, and Open Issues
64
changes (Equation 16). Equations of the compartments adjust with each other as the input
flow of one compartment depends on the pressure of the previous one and the changes in
volume depend on the input and output flows. The expressions use elastance, resistance and
volume variables.
() (() )
p
tEvtUV=− (14)
() ()
()
in
p
tpt
ft
R
−
=
(15)
()
() ()
out
dv t
f
tft
dt
=−
(16)
Fig. 8. Physiology Cardiovascular Model (Beneken, 1965).
The inertial behavior of the blood in the arteries is defined by the differential equation (see
Equation 17).
() () () ()
etha itha etha etha
df t p t PTH RETHAf t p t
dt LETHA
+− −
=
(17)
Where PTH represents the average intrathoracic pressure, RETHA is the resistance of the
extra-thoracic arteries and LETHA represents the inertia of the blood flow in the arteries.
Data of the constants of a newborn patient were obtained from (Beneken, 1965). The
synthetic signal obtained to represent the pressure is presented in Figure 9.
Development of a Neonatal Interactive Simulator by
Using an RFID Module for Healthcare Professionals Training
65
Fig. 9. Synthetic pressure signal
4.1.4 CO
2
Levels and respiratory frequency
Morphology of the signal
The concentration of CO
2
in expired gases has a close relationship with tissue metabolism,
systemic circulation and ventilation. Capnography is the graphic record of instant
concentration of CO
2
in gases expired during a respiratory cycle (Bhavani-Shankar et al,
1992). A capnogram is divided into four fundamental phases (see Figure 10).
The first Phase (A-B) represents the initial stage of breathing. In this phase, the gas occupies
unused space, normally containing CO
2
. In point B, a strong movement is shown in the
capnogram which is the Phase (B-C). The slope of this movement is determined by the
uniformity in the alveolar ventilation and in the respiratory emptying. In point D, the CO
2
concentration shows its highest value at the end of the respiratory cycle. When a patient
initiates the inspiration, fresh gas enters and there is a significant drop of the baseline.
Unless there is a re-inhalation of CO
2
the baseline approximates to zero (Barash et al, 2009).
Fig. 10. Normal Capnogram (Barash et al, 2009)
The frequency of the figure above is known as the respiratory frequency or respiratory rate
and corresponds to the number of respirations (inhalation and exhalation) within a period of
time.
Deploying RFID – Challenges, Solutions, and Open Issues
66
The implemented mathematical model
The capnogram is divided into four fundamental phases (see Figure 10). This wave shape
can be described by decreasing exponentials that model the aspiratory and expiratory
processes. The frequency of this signal is related with the respiratory frequency.
The dynamic model used describes 2 first degree differential equations; the first expression
describes de aspiration (see Equation 18) and the second describes all the cycle, expiration
and aspiration (see Equation 19).
1
()
df
f
dt
=−+Φ
τ
(18)
2
2
2
1
( ( ( )))
CO
CO
dN
N
f
tD
dt
=− +α −
τ
(19)
τ y τ
2
define the time constants of the exponentials that represent the inspiration and the
expiration respectively. Besides, φ and
α
define the baseline and the maximum CO
2
of a
respiratory cycle. Finally, D is defined as the time in which the respiratory process takes
place. In the Figure 11 synthetic signal obtained is shown.
Fig. 11. Synthetic capnogram
4.1.5 Other variables
Temperature
Human beings along with birds and mammals are categorized as warm-blooded animals or
homeothermic beings; that is, that despite of being exposed to a variety of temperatures,
homeothermic organisms keep their temperature steady. Cells in the body perform
optimally within a temperature range between 35 to 38 centigrade degrees.
Development of a Neonatal Interactive Simulator by
Using an RFID Module for Healthcare Professionals Training
67
The center of temperature regulation of humans is the hypothalamus; this is an area in the
brain above the pituitary gland that acts as a thermostat to maintain the body’s internal
temperature within a range between 36,1 – 37,7 centigrade degrees.
Regarding to this measured values, if the oral temperature is above 38 ºC, it can be said that
the individual has a fever. On the other hand, rectal temperature is always higher than the
oral one by 0,6 ºC whereas axillary temperature is lower than internal temperature by 1 ºC.
A failure in the thermoregulatory system with temperatures equal to or greater than 41 ºC
would lead to a malign hyperthermia, which is characterized by a failure in the mechanisms
of heat loss.
Hyperpyrexia takes place when the body temperature is 41 ºC, taken as an isolated reading,
or if there is an increase of 1 ºC every 2 hours. This could be originated by fever or
hyperthermia. On the contrary, hypothermia is the decrease in central body temperature
(rectal reading) below 35º C. The most common cause is the accidental exposition to
extremely low temperatures which may take place during winter, accidents in mountains
and immersion in cold water.
Cardiac output
Cardiac output is composed by two main factors: the “ejected volume”, which is the blood
volume expelled by the heart in each heartbeat and the “cardiac frequency”. The
multiplication of both factors expresses the cardiac volume per minute or, what has been
called “cardiac output”.
Cardiac output normally decreases during normal sleep as well as under general anesthesia.
Some anesthetics such as the halothane can reduce the cardiac output excessively as it
reduces the sympathetic discharge in the cardio vascular system. In particular, a strong
circulatory insufficiency is characterized by an abnormally low cardiac output. In chronic
cardiac insufficiency, the cardiac output can be limited only during intense physical activity;
nevertheless, after certain time, the reduction also takes place even during rest limiting the
physical capacity .
During physical exercise, incremental cardiac output takes place; likewise, cardiac output
can be greater than 50% by the end of pregnancy as well as under certain pathological
conditions such as hyperthyroidism or arteriovenous fistula.
Oxygen saturation
Oxygen saturation is defined as the relationship between the amount of oxygen combined
with hemoglobin present in a particular location and the maximum amount of oxygen that
could be combined with the hemoglobin in the same setting. In this way, oxygen saturation
indicates the amount of oxygen that is being transported by the plasma.
Under controlled conditions and constant monitoring, the saturation needed to reach and
keep proper blood oxygenation can reach levels of 97% in infants; similarly, at altitudes such
as that of Bogota, saturation can fluctuate between 88 to 92 % with a maximum range
between 85% and 95%.
4.2 Selecting medication and dose
Once vital signs of newborns have been simulated to create different scenarios, the
medicines that will be used by the simulator have to be selected in order to stabilize vital
signs in case the trainee finds a pathological scenario. The following substances that are of
common use in neonates were initially considered (Taketomo, Hodding, 2010):
Deploying RFID – Challenges, Solutions, and Open Issues
68
• Cardiovascular: Adenosine, Digoxin , Dobutamine, Dopamine, Indomethacin,
Terbutaline.
•
Respiratory System: Aminophylline, Dexamethasone, Salbutamol.
• Central and peripheral nervous system: Phenobarbital, Phenytoin, Fentanyl,
Midazolam.
•
Miscellneous: Adrenaline, Atropine, Human albumin 20%, Atropine, Sodium
Bicarbonate, Furosemide, Calcium Gluconate 10%, Cristalline Insulin, Physiological
Serum 0,9%, Pulmonary Surfactant, Vitam K1, Vecuronium.
From the previous list some medicines that are administered via intravenous route were
selected. Similarly, those that can be administered via umbilical vein were chosen since
this is one of the most common ways used during the neonatal period and also because
this is the place in where the identifier will be located (See Figure 1). According to these
parameters, the selected medications are: Adenosine, Adrenaline, Atropine and
Terbutaline. Each of them has a different purpose but physically they have a similar effect
in the patient. Table 3 summarizes the selected medications with their corresponding uses
and their side effects.
Medication Use Side effects
Adenosine
Convert tachycardia in to
a sinus rhythm
Arrhythmias
Redness - Flushing
Bradycardia
Hypotension
Apnea
Adrenaline -
Epinephrine
Increase heart rate
Tachycardia
Cardiac arrhythmia
Sudden death
Hypertension
Atropine
Sinus bradycardia
Arrhythmia
Fever
Flushing
Tachycardia
Terbutaline
Increase heart rate
bradycardia
Tachycardia
Arrhythmias
Flushing
Hypertension
Table 3. Table of medicines, their uses and side effects.
It was also important to determine the proper dose for each of the selected prescriptions. In
order to find this information, the following guidelines have to be taken into account:
•
Concentration in Vaccine Bottle: it is the ratio between the amount of solute (mg) and
the amount of solvent (mL). It has to be specified how many milligrams of the vaccine
bottle need to be administrated to the neonate according to his/her weight.
•
Necessary dilutions: Dilution is the process by which the concentration of a solution is
reduced by adding a solvent. Vaccine bottles containing pure medication or initial
concentrations are not used in newborns due to their cardiovascular, respiratory and
immune systems would not tolerate them.
Development of a Neonatal Interactive Simulator by
Using an RFID Module for Healthcare Professionals Training
69
• Neonate’s weight: This parameter is relevant to know the dose to be administered by
taking into account the weight in kilograms (Kg); along with this information, the
proper dose to be given to the newborn can be determined. The proper dose has to be
calculated accurately since in case of administering a wrong amount the newborn can
suffer undesired side effects.
In Section 5.1.2 the appropriate dose is presented for each medicament according to the
newborns’ weight.
5. Implementation of the system
All the information referenced in the previous section was considered when implementing
the virtual and physical interactive simulator. Vital signs simulated in a virtual way allow
the instructor to recreate different medical scenarios; medications allow trainee to choose the
treatment that will be applied. The mannequin reflects the health condition of the neonate
which indicates the student whether the right medicament and dose have been selected.
Taking these mentioned elements into account and in order to design and implement the
simulator, the main system blocks and the data flow are shown in Figure 12. Each of these
system blocks will be explained in this chapter along with the implementations obtained in
each of them.
Fig. 12. System block diagram of the neonatal virtual and physical simulator
5.1 Implementing the graphic interface
Observing the vital signs on a screen is very important for both doctors and nurses during
their training process because specific problems can be found through their traces, shapes,
curves and their numeric values. Usually these specific problems cannot be found only by
hearing the heart beats, checking the temperature or by chest auscultation. In the software
application developed, different vital signs can be read and the patient can be treated
according to the diagnosed pathology.
Deploying RFID – Challenges, Solutions, and Open Issues
70
5.1.1 Simulating the health condition of a neonate in LabView ®
The models explained in the previous section are implemented and visualized in a graphic
interface developed in LabView®. The result of this process can be seen in Figure 13.
The interface allows the modification of the different parameters in order to obtain a wide
diversity of medical scenarios; nevertheless, the feedback variables from the mannequin are:
the cardiac frequency, the respiratory frequency, the rectal temperature and skin flushing. The
interface is used, mainly, to train students of the healthcare area for acquiring diagnostic skills.
Fig. 13. Graphic interface developed in LabView ®
5.1.2 Selection of the medication in LabView ®
The correct dose is calculated for each medicament according to the drug main information.
Table 4 shows the concentration of each vaccine bottle, the dilution and the dosage
according to the neonate’s weight. These 4 medications are available in the graphic interface
of the computer according to the pathological scenario that also includes the neonate’s
weight that is also selected on screen. The interface of the medication programmer can be
seen in Figure 14. (Young & Magnum, 2008)
Concentration
(mg/mL)
Drug
Dilution
Dosage mL by weight
1 Kg 2 Kg 3 Kg 4Kg
Adenosine 3 1:9 0,17 0,33 0,5 0,67
Adrenaline 1 1:9 0,1 0,2 0,3 0,4
Atropine 1 1:9 0,2 0,4 0,6 0,8
Terbutaline 0,5 or 1 1:9 0,1 or 0,05 0,2 or 0,1 0,3 or 0,15 0,4 or 0,2
Table 4. Correct dosage according to the neonate’s weight
Development of a Neonatal Interactive Simulator by
Using an RFID Module for Healthcare Professionals Training
71
As shown in Table 4, the scenarios that can be generated by the instructor are created in the
virtual interface where the neonate’s weight and medication are selected throughout a
dropdown menu for each item; for weight selection purposes there are four options: 1Kg,
2Kg, 3Kg and 4Kg. The medications implemented are: Adenosine, Adrenaline, Atropine and
Terbutaline. The selection of the dose is detailed below.
Fig. 14. Snapshot of the interface to select medication and neonate’s weight
5.2 Implementation of the syringe applicator and selection of the dosage
The dosage is selected by the trainee when he or she takes the syringe or applicator and
makes the load up movement. To determine the dose, a Hall Effect sensor (UGN3503) is
strategically located in the rubber plunger tip while a magnet is placed in the bottom of the
syringe barrel in order to measure the magnetic flux density changes while the load up
movement is simulated. The sensor is a transducer that varies its output voltage when
detecting a change in the magnetic field. An ATmega8 microcontroller is in charge of
converting the data from analogue to digital and then codification is made. Data are sent
wirelessly to the data acquisition module in the computer by using the serial
communication transmitter TLP434 connected to the ATmega8 microcontroller.
The wireless communication is unidirectional. The transmitter operates in a frequency of
433,92MHz which belongs to the Ultra High Frequency (UHF) band. The receiver RLP434 is
connected to an ATmega8 microcontroller that is in charge of the signal decoding. The
decoded byte is sent to the Data Acquisition card of LabView ® (ADQ Labview®) (See
Figure 15).
Once the data are in the computer, the information is processed and the amount of
medication is shown in the screen. Dose may fluctuate between 0 mL to 1 mL with a
resolution of 0,02 mL. Once the medication and the neonate’s weight have been selected and
the trainee has loaded up the medicament in the syringe, the information is programmed in
the Tag that is attached to the syringe.