Integrated Waste Management Volume II Part 14 pdf
Bạn đang xem bản rút gọn của tài liệu. Xem và tải ngay bản đầy đủ của tài liệu tại đây (545.88 KB, 27 trang )
Sustained Carbon Emissions Reductions through
Zero Waste Strategies for South African Municipalities
447
biogenic wastes. The availability and applicability of the models were the limiting factors for
their use and thus an ad hoc GHG quantification tool called the Waste Resource
Optimisation Scenario Evaluation (WROSE) was developed as part of this study using
emissions factors derived by the United States Environmental Agency (US EPA) for landfill
disposal, landfill gas recovery, recycling and composting. The emissions factors used in
WROSE are those derived by the United States Environmental Protection Agency using
IPCC guidelines and were used as the most ‘transparent’ approach to modelling the GHG
emissions or reductions. A streamlined LCA approach was used for the derivation of these
factors – GHG impacts are considered from the point at which the waste is discarded by the
waste generator, to the point at which it is disposed, treated, or recycled into new products
(US EPA, 2006). The emissions factor for the anaerobic digestion of biogenic MSW was
developed using the same streamlined LCA approach (on a wet weight basis) and
considered the following emissions and reductions:
i. Direct emissions: Direct process emissions were determined using the IPCC greenhouse
gas inventory guidelines (2006). The tier 1 approach was adopted, as this is the
methodology for countries where national data and statistics are not available. The
emissions factor for the biological treatment of biogenic MSW as listed by the guidelines
is 1g CH
4
/kg of wet waste. Nitrous oxide emissions are assumed to be negligible and
an assumed 95% of methane is recovered for energy generation. Total direct emissions
amounted to 0.00105 MTCO
2
eq/ton.
ii. Transportation emissions from the collection and transportation of MSW:
Transportation emissions were calculated using a similar methodology to that used in
the 2009 study by Møller et al, 2009. The fuel efficiency of waste collection trucks over a
20mile distance was determined, assuming a typical value of 0.03L/ton/km. A 20mile
distance to the AD facility was assumed to maintain consistency with the US EPA
emissions factors. Total emissions from transportation of waste amount to
approximately +0.0029794 MTCO
2
eq/ton.
iii. Energy emissions/reductions: Energy emissions consist of emissions from the
combustion of methane to produce energy; emission reductions from electricity
generation and energy emissions from energy consumption. Energy reductions from
substitution of fossil fuel energy due to energy recovery and electricity generation from
waste. Total emissions from combustion amounted to 0.0024 MTCO
2
eq/ton of wet
waste. A typical emissions factor for combustion was chosen for the average yield of
biogas from Møller et al. (2009). An average biogas yield of 110Nm
3
/ton of waste
digested and calorific value of 23 MJ/m
3
was used to calculate the total energy
produced from combustion – with a 40% energy recovery rate (Møller et al, 2009).
Approximately 18% of the total energy generated is assumed as the energy requirement
for the anaerobic digestion process and operations on site. An average emissions factor
of 1.015 kg CO
2
/kWh was used for the electricity generated in South Africa by
electricity provider ESKOM as derived by the University of Cape Town Energy
Research Centre (2009). This factor is significantly higher than the average range of
between 0.4 and 0.9 kg CO
2
/kWh. This is likely due to the highly carbon intensive
electricity grid in South Africa comprising of approximately 91.7% coal generated
electricity (SA-Department of Energy, 2010). Emission reductions from the substitution
of electricity amounted to -0.23397 MTCO
2
eq/ton, thus producing an overall energy
emissions factor of -0.23157 MTCO
2
eq/ton of wet waste.
Integrated Waste Management – Volume II
448
iv. Digestate Emissions: from digestate application and reductions from substitution of
inorganic chemical fertiliser by compost produced from digestate. These emissions
were approximated on the basis of European data (Boldrin et al, 2009; Møller et al,
2009) as no such data for the production of fertilisers is available for South Africa. A
conservative value for fertiliser substitution was adopted as the nutrient composition of
the digestate produced is variable and largely depends on the quality of input
feedstock. The emissions from digestate amount to approximately -0.0443
MTCO
2
eq/ton.
The resultant anaerobic digestion emission factor calculated was approximately -0.2718
MTCO
2
eq/ton of wet waste, which is high due to the recovery of methane and production
of electricity and substitution of fossil fuel energy in South Africa’s carbon intensive energy
supply. This factor has been calculated on a wet weight basis and therefore the WROSE
model requires the amount of wet waste to be entered into the input screen under ‘biogenic
food waste’. For the modelling process, it was assumed 0.6 m
3
of water is added per ton of
biogenic input feedstock.
2.4 Landfill space savings
The estimation of landfill space savings from waste diversion is largely an empirical
calculation, as the unique conditions and operational activities on site, specifically,
compaction of waste into landfill cells, influence the actual airspace saved. Actual landfill
space savings (LSS) will therefore depend on the degree of compaction employed and the
efficiency to which it is conducted. The calculation of LSS was based on three different
methodologies to produce both a range of expected landfill space savings and an average
LSS value for each scenario. The first methodology was used by Matete and Trois (2008) to
calculate LSS for various zero waste scenarios. The total amount of waste in tons is divided
by the average of compacted of MSW to yield the total landfill space savings. The value for
the compacted density of MSW was assumed to be 1200kg/m
3
(1.2 tons/m
3
) in accordance
with the eThekwini Integrated Waste Management Plan (SKC Engineers, 2004). Landfill
density factors of various waste fractions calculated by the United States Environmental
Protection Agency (1995) and the Department of Environment and Conservation of Western
Australia were used to produce further estimates, as these factors constitute a wide range of
waste materials and specific fractions that can be diverted from landfill disposal.
2.5 Economic analysis
The parameters and assumptions used for estimating both capital and operational costs, and
the potential income derived from the sale of recyclables, electricity, certified emissions
reductions (CERs), and compost are based on research reports, journal publications,
feasibility studies for local projects, and international projects where local data was
unavailable. A full cost-benefit analysis should be undertaken to determine the costs and
benefits over the duration of the design life for waste treatment and disposal facilities.
Annual operating costs of landfill disposal amount to ZAR138 (approx. US$ 20) per ton of
waste landfilled (Moodley, 2010). The capital cost of the eThekwini landfill gas to energy
project for Mariannhill (0.5MW) was used as an estimate for the analysis.
A total throughput MRF capacity of 100,000 tons per year (385 tons per day) was assumed
for the mechanical pre-treatment phase of the Mechanical Biological Treatment (MBT)
scenarios for both landfill waste streams. The total fractions of biogenic and recyclable
Sustained Carbon Emissions Reductions through
Zero Waste Strategies for South African Municipalities
449
fractions from each waste stream amount to between 80,000-90,000 tons. It is assumed that
waste loads from areas where the composition of recyclables and biogenic waste is
insignificant are immediately diverted to landfill disposal. Operational and capital costs
were approximated using a 2005 study by Chang et al., which approximated a linear
relationship between capital and operating costs and design capacity. The total capital cost
for mechanical pre-treatment and materials recovery therefore amounts to approximately
US$ 33.8 million while the total annual operational cost is US$ 9.9 million/year. Recycling
prices have been sourced from two local studies: The Waste Characterisation Study Report
(Strachan, 2010) and the City of Cape Town IWMP (2004). It should be noted, however, that
recycling prices vary in accordance with market conditions. Depending on the price of
virgin materials, and other commodities such as oil, it may be cheaper to produce products
from virgin materials, rather then through recycling. This reduces the demand for
recyclables, and therefore directly affects prices (Stromberg, 2004; Lavee et al, 2009).
A study by Tsilemou et al. (2006) evaluated the capital and operating costs of 16 anaerobic
digestion plants. A study reviewing anaerobic digestion as a treatment technology for
biogenic MSW used this data to produce cost curves by Rapport et al (2008). The total
biogenic fraction of the Mariannhill and New England Landfill waste streams amount to
approximately 49,153 and 37,000 tons/annum respectively and therefore the chosen
capacity for each anaerobic digestion plant was 50,000 and 40,000 tons/annum respectively.
Using the cost curves, capital costs for anaerobic digestion plants for both the Mariannhill
waste and New England waste streams amount to US$ 15.24 and US$ 13.46 million
respectively, while operating costs amount to US$ 28.2 and US$ 32.4 per ton of waste
respectively. The capital and operating expenses for the implementation of DAT composting
plants have been determined at local level as ton and US$ 22/ton of input waste (Douglas,
2007). A degradation factor is used to estimate the yield of compost obtained from the
process, and consequently the resulting income from the sale of compost. A DAT
composting facility processing 180 tpd requires a capital investment of US$ 350k (Douglas,
2007). This approximation was used to estimate the capital costs for DAT composting
facilities for the Mariannhill waste stream (230tpd) and New England waste stream (150tpd).
3. Results
3.1 Case study
3.1.1 eThekwini municipality – Mariannhill landfill
The eThekwini municipality is located on the eastern coastline of South Africa in the
province of KwaZulu-Natal. Sub-tropical climate conditions are pre-dominant in the coastal
areas of eThekwini. The municipality covers a total area of 2297 km
2
and has an
approximate population of 3.16 million people. Areas of eThekwini vary in socio-economic
climate from well developed urban areas of the metropolitan to newly integrated rural/peri-
urban areas with little service coverage and infrastructure. Waste generation rates for the
formal sector range from 0.4 - 0.8kg per capita per day, and 0.18kg per capita for the
informal sector whilst the total waste landfilled per annum is approximately 1.15 million
tons (SKC Engineers, 2004). There are currently three engineered landfills being operated by
Durban Solid Waste in the eThekwini municipality: the Bisasar Road, Mariannhill and
Buffelsdraai landfill sites. The Mariannhill landfill was selected for the study as a leachate
treatment plant, landfill gas recovery and energy generation system and MRF are located on
site. The landfill is therefore representative of an integrated waste management approach,
Integrated Waste Management – Volume II
450
which will be compared with other possible zero waste strategies. The landfill site has been
operational since 1997, and has an approximate incoming waste stream of 550-700 tons per
day. The landfill is expected to close in 2022 (Couth et al, 2010). The site incorporates
environmentally sustainable engineering design and operational methods, and has been
registered as a national conservancy site. The MRF was implemented in 2007 and recovers
between 9-13% of recyclables from the waste stream (DSW, 2010). The MRF facility has since
been upgraded, with the addition of mechanical sorting equipment and the extension of the
pre-sorting line. The MRF has exceeded its potential in terms of initial greenhouse gas
savings, has created jobs and resulted in landfill space savings, however problems have
been experienced with regard to contamination of recyclable wastes by garden refuse.
3.1.2 uMgungundlovu municipality: New England road landfill
uMgungundlovu District Municipality (UMDM) is one of 11 district municipalities in
KwaZulu-Natal (KZN) province and is situated within the KZN Midlands. uMgungundlovu
District Municipality has a total of 234,781 households and a total population of 927,845
people (Statistics South Africa, 2005). The UMDM covers approximately 8,943 km
2
and
encompasses areas of varying socio-economic conditions – from urban residential and
commercial/industrial areas, to informal areas and rural, traditional areas. Waste generation
rates range between 0.35-0.61 kg/capita/day for urban areas and between 0.1-0.61
kg/capita/day for rural areas (UMDM Review, 2009). An estimated 200,000 tons of waste is
generated annually in the UMDM (Jogiat et al, 2010). The majority of municipal landfill sites
in the UMDM does not have permits, or infrastructure such as weighbridges. This is
characteristic of South African municipalities and highlights the need for improved
infrastructure and waste reporting. Most of these landfill sites have been prioritised in
integrated development plans. Consequently, weighbridge data is only available for the
New England Road Landfill Site in uMsunduzi. The New England landfill was opened in
1950 as an open dumpsite, and was upgraded to an engineered landfill site in the 1980’s, in
accordance with the National Environment Act. The landfill receives an average of 183,531
tons of waste annually, which is equivalent to approximately 700 of tons of waste per day.
Approximately 250,000 m
3
of compacted waste is landfilled every year (UMDM, 2009).
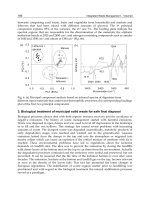
3.2 Carbon emissions/reductions assessment
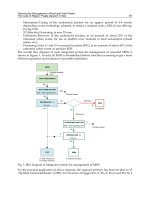
A summary of the results obtained from the Carbon Emissions/Reductions assessment
using the WROSE model is illustrated graphically in Figure 3 and 4.
The results of the carbon emissions/reduction assessment confirm that the scenario 1 (landfill
disposal of all MSW) produces the greatest GHG emissions, and is therefore the least
favourable waste management strategy in terms of environmental benefit. This is largely due
to the degradation of biogenic wastes (food waste and garden refuse), contributing to
approximately 70% and 65% of total emissions for the eThekwini Municipality and UMDM
respectively as shown in Table 4. The methane produced from anaerobic conditions prevailing
in landfill cells is considered in the analysis as this methane is produced through
anthropogenic activity of landfilling of waste. The second greatest contributor to GHG
emissions is the paper fraction of the waste stream, comprising common mixed waste and the
K4 cardboard and scrap boxes (27-32% in total). This is due to the degradable carbon fraction
of these materials, which ranges from 30-50% and degrades under aerobic conditions.
Although the carbon in both biogenic and paper fractions degrades under aerobic conditions,
Sustained Carbon Emissions Reductions through
Zero Waste Strategies for South African Municipalities
451
some of the carbon that does not degrade is stored, causing a carbon sink. For example the
degradation of lignin and cellulose varies depending on landfill conditions, and often, these
compounds do not decompose to the full extent, and are stored within the landfill (landfill
sequestration) (US EPA, 2006). This does not apply to other materials such as plastics, as the
carbon present in plastic is obtained from fossil fuel sources and thus the carbon is considered
to be transferred from one source to another (storage in the earth, to storage in a landfill). The
emissions produced from landfill disposal of plastic, metal and glass fractions therefore
comprise of emissions from transportation and the operation of vehicles and machinery on site.
Fig. 3. CERs Assessment of the Mariannhill Landfill waste stream
Fig. 4. CER Assessment of the New England Road Landfill waste stream
Integrated Waste Management – Volume II
452
Table 4. Waste Fraction % contribution to GHG emissions from landfill disposal
The recovery of landfill gas at a 75% recovery rate through Scenario 2 produces a 110%
and 105% decrease in emissions for the UMDM and the eThekwini Municipality
respectively. These results highlight the value of landfill gas recovery for the reduction of
GHG emission impacts from waste management and at the very least, landfill gas
recovery systems should be employed at landfill sites. Landfill gas pumping trials would
obviously be required to assess the actual yield of gas being produced as compared with
the theoretical yield used in the model. The recovery of methane and generation of
electricity results in GHG savings of 5,758 and 8,331 MTCO
2
eq/annum from the
eThekwini Municipality and uMgungundlovu DM respectively. Published carbon
emission reductions for the Mariannhill landfill gas to energy project amounted to
approximately 16,000 MTCO
2
eq/annum (Couth et al, 2010). The difference between this
data and the value calculated from the CER assessment differ by almost 10,000
MTCO
2
eq/annum. This variation can be attributed to the nature of landfill gas
production, which varies in composition and generation rate depending on the phase of
degradation (Smith et al, 2001). Ritchie and Smith (2009) list factors such as waste
composition, pH, moisture content, temperature and nutrient availability affect landfill
gas generation. The amount of gas actually being generated and recovered could therefore
differ from the calculated value depending on how these factors are taken into account.
The parameters and assumptions used in the development of the US EPA emissions
factors for landfill gas generation and recovery are based on experimental values; and
have been identified as an area where more research is required (US EPA, 2006). The
factors have also been based on the United States energy grid, which is less carbon
intensive than the South African grid, and therefore a possible source of variation
(underestimation of potential GHG savings) when considering the substitution of fossil
fuel energy with electricity generated from landfill gas.
Sustained Carbon Emissions Reductions through
Zero Waste Strategies for South African Municipalities
453
Recycling, which is implemented in Scenarios 3, 4 and 5, as expected produced significantly
higher GHG emission reductions in comparison to all other strategies. This is largely due to
substitution of recycled materials for virgin materials in production processes, and
displaced energy emissions produced through the acquisition of raw materials. The status
quo of waste management for the Mariannhill landfill site produces approximately 18,122
MTCO
2
eq/annum. The current MRF recycling recovery rate produces approximately 13,000
MTCO
2
eq/annum whilst an increase in the recovery rate to 40% produces 53,000
MTCO
2
eq/annum. An MRF recycling facility recovering 40% of recyclables present in the
New England waste stream together with landfill gas recovery would reduce emissions
from the current status quo by approximately 160%. These savings (47,103 MTCO
2
eq) could
in reality be higher, as recyclables in the waste stream were found to be relatively clean and
uncontaminated, as waste is not transferred, mixed and compacted at transfer stations as is
the case in the eThekwini Municipality.
In terms of the treatment of the biogenic fraction of the waste, the energy generation
capabilities of anaerobic digestion produce greater GHG reductions for the Mariannhill and
New England waste streams: approximately 21,379 and 15,922 MTCO
2
eq/annum
respectively, and far outweigh the environmental benefits of both composting and landfill
gas recovery therefore making it the most preferable strategy in terms of GHG impacts.
Anaerobic digestion allows for the production of methane from the degradation of wastes to
occur in a controlled environment and be captured efficiently (greater capture/collection
efficiency in comparison to landfill gas recovery). The gas is produced, captured and
converted into energy at a faster rate than the naturally occurring anaerobic processes in
landfill cells (Ostrem, 2004). The environmental benefits of anaerobic digestion are clear;
however they need to be weighed against the costs, in comparison with a less capital
intensive and carbon neutral strategy such as composting. Scenarios four and five produce
the greatest GHG emission reductions as they allow for integrated waste management
where several strategies are implemented to target the biogenic, recyclable and residual
waste fractions (Figure 5).
Fig. 5. Comparison of anaerobic digestion and composting
Integrated Waste Management – Volume II
454
3.3 Landfill space savings analysis
The results from the landfill space savings estimate for the Mariannhill and New England
Road Landfill waste streams are presented in Table 5.
Table 5. Average landfill space savings
In both case studies Scenario five (MRF recycling and composting) results in the greatest
average landfill space savings, with an annual saving of 103,302 m
3
for the Mariannhill
landfill, and 74,100 m
3
for the New England Road landfill, as the scenario allows for the
greatest amount of waste to be diverted from landfill disposal. It should be noted however
that the greatest landfill space savings result from the diversion of recyclables (at a 40%
recovery rate) which account for approximately 50% of the savings for both landfills if
scenario five is implemented. The remaining airspace for the Mariannhill Landfill Site as at
June 2002 was estimated to be 3.8 million m
3
(eThekwini Municipality, 2010). The expected
date for closure of the site is in 2022 (Couth et al, 2010). Assuming 190 000 m
3
of waste is
landfilled every year (3.8 million m
3
over a 20 year period), the current remaining landfill
airspace amounts to 2.28 million m
3
. This assumption is valid as currently 550-700 tons of
waste is landfilled daily at the Mariannhill Landfill Site (Couth et al, 2010) which is
equivalent to approximately 190 000 m
3
of MSW landfilled annually. The predicted landfill
airspace capacity trends as illustrated by Figure 6 show that if Scenario 3 were to be
achieved (40% recovery rate of recyclables) a further 4 years could be added to the landfill
lifespan. The diversion of the recyclable and biogenic fraction to either composting or
anaerobic digestion would extend the lifespan by 12-14 years.
Fig. 6. Predicted airspace capacity trends: Mariannhill Landfill Site
Sustained Carbon Emissions Reductions through
Zero Waste Strategies for South African Municipalities
455
An evaluation of landfill airspace of the New England Road Landfill estimated a remaining
lifespan of six to nine years, provided that. 250, 000 m
3
of municipal solid waste is disposed
of annually (Jogiat et al., 2010). Assuming a remaining average lifespan of eight years
(expectant closure in 2016/2017 – a further six years landfill space currently remaining), the
New England Road landfill currently has capacity for 1,500,000 m
3
of municipal solid waste.
The predicted landfill airspace trends are illustrated in Figure 7. If Scenario 3 was
implemented, the landfill lifespan would be extended by a year, while if Scenario 4 or 5
were applied the lifespan would be extended by approximately two and half years.
Fig. 7. Predicted airspace capacity trends: New England Road Landfill Site
3.4 Cost analysis
Table 6 presents the results of the economic analysis.
3.4.1 Landfill gas recovery
Landfill disposal with landfill gas recovery is the least capital intensive for the scale of
application on both landfill sites. This highlights the previous recommendations that landfill
gas recovery (at the very least) should be implemented at landfills planned in the UMDM.
The actual operating costs for landfill gas recovery amount to 0.018$/kWh which equates to
R 866,758/annum. The majority of operating costs stem from landfill disposal of waste (R13-
14 million). Certified emissions reductions produce between R550, 458 and R796, 448 per
annum. Income from the sale of electricity at the current tariff (0.047$/kWh) earns
approximately R2.2 million per annum. This potential income could increase with the
implementation if the Renewable Energy Feed in Tariff (REFIT), currently being developed
by the government to provide incentives for investment in renewable energy sources. REFIT
allows suppliers of renewable energy to sell electricity at a set price that covers generation
costs and ensures a significant profit argue that both CDM and REFIT mechanisms should
apply to landfill gas recovery projects, as long as it can be shown that such projects are
only economically feasible with the implementation of both schemes (Couth et al, 2010).
Integrated Waste Management – Volume II
456
Table 6. Economic Analysis for all scenarios
3.4.2 Materials recycling facility
The implementation of an MRF processing 100,000 tons per annum requires significant
capital investment of approximately R34 million (US$ 5m) however the greatest income and
savings is achieved (approximately R19 million and R15 million (US$ 2.1m) for Mariannhill
and New England Road waste streams per annum). Although price volatility in the
recycling market is of concern, the MRF is still a requirement for mechanical pre-treatment
phase of MBT strategies, as source separation is not implemented.
3.4.3 Anaerobic digestion and composting
A full scale anaerobic digestion plant with capacity of 40,000 and 60,000 tons for the New
England Road and Mariannhill waste streams requires the greatest capital investment (R90-
100 million – US$ 12.8-14.3m), with an estimated net profit of R 3 million (US$ 428k) for the
NER waste stream and R 5 million (US$ 710k) for the MH waste stream. When compared to
the ‘carbon neutral’ biological treatment of waste through composting plants, the capital
expenditure required for an AD plant of this magnitude does not seem viable. A DAT
composting plant produces a net profit per annum of R2 million and R3 million for a
required capital expenditure of R2 million (US$ 285k) and R3 million (US$ 428k) for the
NER and MH waste streams respectively, however this profit depends greatly on the
establishment of a market for compost. Producers of compost often have to upgrade the
nutrient content of composts, through blending with other nutrient rich organic sources,
Sustained Carbon Emissions Reductions through
Zero Waste Strategies for South African Municipalities
457
and these costs are not accounted for. In this respect anaerobic digestion plants have a
definite advantage over composting, as the major potential income sourced are through the
sale of electricity, and certified emission reductions, which account for approximately 50%
of the total net profit for both waste streams.
4. Conclusion and recommendations
The results of the study clearly show that all waste management strategies would produce
some level of environmental benefit, either in terms of greenhouse gas emission reduction
and/or landfill space savings. An MBT scenario with mechanical pre-treatment and
separation of the wet and dry fractions through an MRF; the consequent recycling of
recyclable fractions; anaerobic digestion of biogenic waste with energy generation, and
landfill disposal of all residual wastes would produce the greatest GHG reductions in both
municipalities. This said there are many challenges associated with implementing new
technology and waste treatment methods. The main areas to consider are costs, public
perception and participation, and legislation, regulations and incentives needed to establish
markets for the products yielded from landfill gas recovery, materials recovery, aerobic
composting and in particular anaerobic digestion.
The capital costs for implementing waste diversion/zero waste strategies, in particular
anaerobic digestion (R90-100 million) and MRF recycling (R34 million) remain the greatest
challenge toward implementation on a large scale for the treatment of biogenic and
recyclable fractions of MSW. The capital costs and investment required raises the issue of
the relevance of these waste management strategies/technologies to a country like South
Africa, where basic needs are not being met, waste management budgets are insufficient
and municipalities are not able to deliver waste service coverage to all areas. Possible
rationale for implementing an expensive technology such as AD is the investment in
infrastructure that promotes growth and in the form of job creation and skills development.
The most pressing point in evaluating the applicability of such a technology is that of
environmental benefit. South Africa is the greatest producer of GHG emissions on the
African continent and therefore has a responsibility to reduce carbon emissions.
Creating a market for the products of anaerobic digestion, composting and recycling –
chiefly energy, compost and recycled products is vital in ensuring long-term economic
viability. The UK government has created the Renewable Obligations Scotland (ROS) Policy,
which requires conventional electricity suppliers to distribute a proportion of the total
electricity demand from renewable energy sources, and therefore effectively guarantees a
market for biogas electricity. Energy providers then purchase electricity from these
renewable energy producers to satisfy these legislative requirements (Baker, 2010). Similar
schemes are in the process of development in South Africa such as the Renewable Energy
Feed in Tariff. Commitment from the government and initiatives such as these are required
to make biogas energy an attractive and financially viable waste management option.
Legislation governing the anaerobic digestion plants will also have to be developed. There
are also significant challenges with regard to the implementation of recycling chiefly,
improving stability within the recycling market. Subsidizing recycling initiatives would
assist in keeping recycling prices constant (Nahman, 2009). The formulation of specific
legislation that governs and regulates recycling, provides incentives, identifies targets for
the recycling industry and provides a framework that consolidates all recycling efforts on
Integrated Waste Management – Volume II
458
both municipal and provincial levels into one concerted effort is necessary as currently
recycling is governed by municipality specific by-laws.
This study evaluated the environmental impacts of various waste management strategies
through the simulation of a zero waste management scenarios for local municipalities. The
study focused on two landfill sites: the eThekwini Mariannhill landfill and UMDM New
England landfill. The principal environmental impacts evaluated were GHG impacts. GHG
emissions were quantified by developing the WROSE model, which primarily uses
emissions factors developed by the United States Environmental Protection Agency. Herein
lies the limitation of this research in that these factors are based on North American data
and parameters, that may not be representative of actual emissions/reductions resulting
from the implementation of these scenarios in South Africa. Despite this limitation, the
research is intended to provide information and data for municipal waste managers and
municipalities that will assist in assessing the alternatives to landfill disposal and derive the
economic and environmental benefits of the MSW stream. The scenarios assessed are
compared on the basis of theses benefits, and it is on this comparative premise that the
results of the study are applicable for the purpose of assisting South African municipalities
in evaluating sustainable and efficient waste management methods that promote both
principles of waste diversion and GHG mitigation. The primary conclusion that can be
drawn from this research is that Mechanical Biological Treatment (MBT) results in the
greatest environmental benefit in terms of GHG reductions. The MBT strategy included
mechanical pre-treatment of unsorted, untreated MSW which comprises sorting and
separation of recyclables and biogenic wastes; recycling of the recyclable fractions and
biological treatment of the biogenic fraction either through anaerobic digestion or
composting. The study concluded that capital and operational costs of some technologies
are the main barrier for implementation in developing countries, and the environmental and
social benefits should also be evaluated further to truly gauge the costs/benefits involved.
5. Acknowledgments
The authors would like to thank Lindsay Strachan (GreenEng), John Parkin and Logan
Moodley (eThekwini Municipality-Durban Solid Waste), Riaz Jogiat (uMgungundlovu
Municipality), Bob Couth (SLR Consulting UK) and Elena Friedrich (University of kwaZulu-
Natal) for their assistance during the course of this study.
6. References
Baker, P., (2010). Opportunities Abound in Anaerobic Digestion. Available at:
. Accessed 12 April 2010.
Bogner, J., Pipatti, R., Hashimoto, S., Diaz, C., Mareckova, K., Diaz, L., Kjeldson, P., Monni,
S., Faaij, A., Gao, Q., Zhang, T., Mohamed, A.A., Sutamijardja, R.T.M., Gregory, R.
2008. Mitigation of global greenhouse gas emissions from waste: Conclusions from
the Intergovernmental Panel on Climate Change (IPCC) Fourth Assessment Report.
Waste Management & Research, volume 26, pp 11-32.
Boldrin, A., Anderson, J.K., Christensen. 2009. Composting and composting utilisation:
accounting of greenhouse gases and global warming contributions. Waste
Management & Research, volume 27, pp 800-812.
Sustained Carbon Emissions Reductions through
Zero Waste Strategies for South African Municipalities
459
Chang, N.B., Davila, E., Dyson B. & Brown, R. (2005). Optimal design for Sustainable
Development of a Material Recovery Facility in a fast growing urban setting. Waste
Management. Volume 25, pp 833-846.
City of Cape Town (2004) IWMP Integrated Waste Management Plan Report.
www.cityofcapetown.co.za
Couth, R. & Trois, C. (2010) Carbon emissions reduction strategies in Africa from improved
waste management: A review. Waste Management. Volume 30 (11), pp 2336-2346.
Couth, R. & Trois, C. (2011) Waste management activities and carbon emissions in Africa.
Waste Management. Volume 31 (1), pp 131-137.
Couth, R., Trois, C., Parkin, J., Strachan, L.J., Gilder, A. & Wright, M. (2010). Delivery and
viability of landfill gas CDM projects in Africa—A South African experience.
Renewable and Sustainable Energy Reviews. Volume 15 (1). pp 392-403.
Department of Energy. 2009. Digest of South African Energy Statistics. Department of Energy.
Pretoria.
Department of Environmental Affairs and Tourism (DEAT). 2009. National Inventory Report:
1990 – 2000. Government Gazette (No 32490).
Rapport, J., Jenkins, B.M., Williams, R.B., Zhang, R. (2008). Current Anaerobic Technologies
Used for Treatment of Municipal Organic Solid Waste. California: California
Environmental Protection Agency Report.
Jogiat, R. Sheard, H., Lombard, J., Bulman, R., Nadar, V., Manqele, M. (2010). Overcoming
the Challenges of Developing an Integrated Waste Management Plan at Local
Government Level – A Case Study of the uMgungundlovu District Municipality.
Proceedings of the 20
th
Wastecon Conference. 4
th
-8
th
October, Institute for Waste
Management Southern Africa, Gauteng, pp. 8-16.
Lavee, D., Regev, U., Zemel, A. (2009). The effect of Recycling Price Uncertainty on
Municipal Waste Management Choices. Journal of Environmental Management.
Volume 90, Pg 3599-3606.
Matete, N. & Trois, C. (2008). Towards Zero Waste in Emerging Countries – A South African
Experience. Waste Management. Volume 28 (8), pp. 1480-1492.
Møller, J., Boldrin, A., Christensen, T.H. 2009. Anaerobic digestion and digestate use:
accounting of GHG and global warming contribution. Waste Management &
Research, volume 27, pp 813-824.
Monnet, F. (2003). An Introduction to Aerobic Digestion of Organic Wastes. [online].
Remade Scotland. Available at:
www.biogasmax.co.uk/ /introanaerobicdigestion__073323000_1011_24042007.pdf
Accessed: 6 April 2010.
Naman, A. (2009). Extended Producer Responsibility for Packaging Waste in South Africa:
Current Approaches and Lessons Learned. Stellenbosch: Council for Scientific and
Industrial Research.
Purnell, G. (2009). National Waste Quantification and Waste Information System. [online].
/>WIS.pdf. Accessed: 21 April 2010.
Reinhart, D., & McCauley-Bell, P. (1996). Methodology for Conducting Composition Study
for Discarded Solid Waste. Centre for Solid and Hazardous Waste Management.
Florida.
Integrated Waste Management – Volume II
460
Ritchie, N. & Smith, C. (2009). Comparison of Greenhouse Gas Emissions from Waste to
Energy Facilities in Vancouver. CH2M Hill Canada Limited. Vancouver.
SKC Engineers. (2004). Integrated Waste Management Plan for eThekwini Municipality.
Document 2214/DO147.
Smith, A., Brown, K., Ogilvie, S., Rushton, K.& Bates, J. (2001). Waste Management Options
and Climate Change: Final report to the European Commission. [online], Available
from: .
Accessed August 2009.
Strachan (2010) Waste Characterisation Study for the uMgungundlovu Municipality.
GreenEng Report. www.greeneng.co.za
Stromberg, P. (2004). Market Imperfections in Recycling Markets: Conceptual and Study of
Price Volatility in Plastics. Resources Conservation and Recycling. Volume 4, pp 339-
364.
Tchobanoglous, G., Theisen, H., Vigil, S. 1993. Integrated solid waste management: engineering
principles & management issues (2
nd
edition). McGraw Hill Inc. New York.
Trois, C., Griffith, M., Brummack, J & Mollekopf, N. (2007). Introducing Mechanical
Biological Waste Treatment in South Africa: A Comparative Study. Waste
Management. Volume 27 (11), pp 1706-1714.
Trois, C. & Simelane, O.T. (2010). Implementing separate waste collection and mechanical
biological waste treatment in South Africa: A comparison with Austria and
England. Waste Management. Volume. 30, no. 8-9, Pg 1457-1463.
Tsilemou, K. and Panagiotakopolous. 2006. Approximate Cost Functions for Solid Waste
Treatment Facilities. Waste Management & Research. Volume 24, Pg 310-322.
uMgungundlovu District Municipality. 2009. Advanced Integrated Solid Waste Management
System. Terms of Reference. uMgungundlovu District Municipality
uMungundlovu District Municipality Corporate Profile n.d. [online]. Available at:
Accessed: 26 June 2010.
United States Environmental Protection Agency (US EPA). 1994. Characterisation of Municipal
Solid Waste in the United States: 1994 Update. [online]. Available at:
Accessed: October 25 2010.
United States Environmental Protection Agency (US EPA). 2006. Solid Waste Management
and Greenhouse Gases: A Life-cycle Assessment of Emissions and Sinks. [online].
Available at: . Accessed: August 2009.
23
Greenhouse Gas Emission from
Solid Waste Disposal Sites in Asia
Tomonori Ishigaki et al.
*
National Institute for Environmental Studies
Japan
1. Introduction
1.1 Difficulties in estimating GHG emission from solid waste disposal sites (SWDSs)
in Asian countries
From the viewpoint of sustainable development, appropriate waste management is crucial for
conserving the local and global environments. Improvement of waste management in
developing countries is directly related to preventing environmental pollution and expanding
public health services. Appropriate waste management contributes to reducing not only the
emission of water/atmospheric pollutants and odors, but also the emission of greenhouse
gases (GHGs). Those involved in international cooperation via technology transfer should take
into consideration the potential for shared benefits in terms of “co-benefit” of waste
management and climate change. The recent framework of Nationally Appropriate Mitigation
Actions (NAMAs) indicated in the Bali Action Plan requires measurability, reportability, and
verifiability of emission reduction in mitigation action. Therefore, researchers in the waste
management field have focused on finding precise and practical methods for estimating GHG
emissions. Solid waste disposal sites (SWDSs) that include both managed landfills and
unmanaged dump sites were recognized as major GHG emission sources in developing
countries. Although the Intergovernmental Panel on Climate Change (IPCC) released
guidelines for estimating GHG emissions, there is still considerable uncertainty regarding
emissions from SWDSs in Asian countries, because of the lack of data about the precise
emission behavior and waste degradation kinetics, especially at waste disposal sites. In this
chapter, authors are going to describe the current situation of the GHG emission estimation
and mitigation action in the waste management field in Asia.
1.2 Current situation of emission estimation methodology
The continuous compilation of each country’s national GHG inventory is very important for
understanding the status of the emissions appropriately and considering mitigation actions.
However, most Non-Annex I parties cannot compile a national GHG inventory
continuously. Therefore, the Greenhouse Gas Inventory Office of Japan (GIO) at the
*Osamu Hirata
2
, Takefumi Oda
1
, Komsilp Wangyao
3
, Chart Chiemchaisri
4
,
Sirintornthep Towprayoon
3
,Dong-Hoon Lee
5
and Masato Yamada
1
1
National Institute for Environmental Studies, Japan,
2
Fukuoka University, Japan,
3
King Mongkut’s University
of Technology, Thonburi, Thailand,
4
Kasetsart University, Thailand,
5
The University of Seoul, Korea
Integrated Waste Management – Volume II
462
National Institute for Environmental Studies (NIES) has held a workshop annually since
2003 (WGIA; the participating countries are Cambodia, China, India, Indonesia, Japan,
Korea, Laos, Malaysia, Mongolia, Myanmar, Philippines, Singapore, Thailand, and
Vietnam), in collaboration with the activity of the workshop on improvement of solid waste
management and reduction of GHG emission in Asia (SWGA), to build the capacity for the
compilation of inventories in NA I countries in Asia.
At the 8th workshop of WGIA, held in July 2010, the secretariat conducted a survey by
questionnaire to assess the current status of waste sector inventory in each country, and the
results were shared in the waste sector working group session [Proceedings of the 8th
Workshop on Greenhouse Gas Inventories in Asia (WGIA8), 2010]. Based on the survey
results, we report the current status of inventory compilation for SWDS.
1.2.1 Documentation
The establishment of a common set of categories by emission source is very helpful for the
comparison of countries’ emissions by activity. Most of the countries estimate the GHG
emissions for the categories in line with IPCC Guidelines. Most of the countries estimate the
emissions using a consistent methodology and prepare the documentation describing their
estimation methodology in the form of technical reports in the mother tongue and /or
English, which is important to maintain its transparency.
In the estimation of GHG emissions, the Common Reporting Format (CRF) tables are a very
helpful means for comparing GHG emissions and methodology by source among countries
all over the world, and they are also a useful tool for verifying the completeness of
emissions estimation. For that reason, several countries have generated CRF tables for their
inventories, although there are no obligations to prepare these tables for the NA I countries.
Instead of the CRF tables, or in parallel with them, several countries estimate emissions with
the UNFCCC software for NA I countries.
1.2.2 Methodology
The level of estimation methodologies differs among the parties; for some countries, a
simple method is used, and for some countries, a high-tier methodology with country-
specific parameters is employed.
Cambodia, Indonesia, Malaysia, Mongolia, and Vietnam estimated potential emissions with
the simple mass balance method (Tier 1) of IPCC methodology. China, Japan, Philippines,
and Thailand employed the first-order decay (FOD) model to estimate emissions. Korea was
attempting to employ the FOD model at the current situation.
In addition to the subcategory “Managed Disposal Site” or “Unmanaged Disposal Site”
used by all of the countries, Indonesia added the country-specific subcategory “EFB solid
waste – CPO mills” as another subcategory.
1.2.3 Activity data
Only a few parties completed sufficient time series analysis of the amount of final disposal
to estimate emissions using the FOD method. Korea has maintained waste statistics since
1990, China has maintained statistics since 2000, and China has estimate activity data prior
to 2000 using several drivers.
In many cases, there are insufficient data about the amount of final disposal to estimate
emissions from SWDSs, especially from unmanaged disposal sites. Due to the lack of data
Greenhouse Gas Emission from Solid Waste Disposal Sites in Asia
463
for unmanaged disposal site, for some parties, emission estimates from this category are
incomplete.
To resolve such problems of data collection, the all parties have been in the process of
conducting a study to look for solutions. As an example of ensuring time series consistency
for the amount of waste disposal, they are planning on referring to population statistics and
waste generation ratio per person.
Sharing the experience, information, and knowledge regarding data collection methodology
at workshops, such as those given by SWGA and WGIA, Asian countries have to make an
effort to improve the inventory compilation.
1.3 Preparation of a GHG inventory and national communications
The participating countries have finished the waste sector inventory compilation included in
the National Communications (NC), and most countries have completed the Second NC
(SNC) to be submitted to the UNFCCC secretariat by the end of 2010. Myanmar will submit
their NC for the first time. Korea already submitted the SNC in 2003.
Compilation of inventory requires the completion of many processes, such as data
collection, verification of the methodology, coordination among relevant agencies,
conducting surveys, and so forth. Therefore, it requires the establishment of well-resourced
inventory compiling and/or a confirmation agency and the participation of specialized
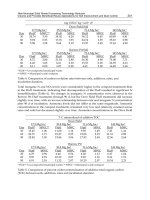
agencies in the inventory compilation processes by category. In each participating country, a
specific agency, such as a government agency, university, research institute, and/or
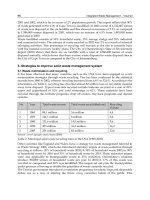
temporal project team took charge of inventory compilation in the waste sector (Table 1).
Also, each participating country has established a compilation system to support inventory
confirmation.
For the current status of national systems, Japan, Korea, Malaysia, Philippines, and Thailand
expressed that they would continuously prepare their inventories. Mongolia and Vietnam
reported that temporary project teams had compiled SNCs. The remaining countries
responded negatively because of the following problems:
- No legal obligation to compile inventories
- Lack of human resources
- Lack of budget
- Lack of an inventory calculation system
- Lack of time
2. Specific parameters for emission estimation from SWDSs in Asia
2.1 First-order decay (FOD) model and the waste degradation rate constant (k)
The main problem of modelling landfill gas (LFG) generation is not only forecasting the
amount of LFG that will be produced, but also the rate and the duration of the production
[Augenstein and Pacey, 2001]. Recently, some models have been introduced to estimate the
LFG generation rate of landfills. Among them, the FOD model is generally recognized as
being the most widely used approach, as it was recommended by the IPCC in the 2006 IPCC
Waste Model and by the U.S. Environmental Protection Agency in the LandGEM Model for
calculating methane emissions from landfills [IPCC, 2006; USEPA, 1998].
The k value determines the degradation rate of refuse in the landfill. The higher the value of
k, the faster the total methane generation at a landfill increases (as long as the landfill is still
receiving waste) and then declines over time after the landfill closes. The value of k is a
Integrated Waste Management – Volume II
464
Countries
Responsible Organization or Agency
Compilation
system
Government or
relevant agency
University or
research
institute
Temporary
project team
Cambodia ○ ○
China ○ ○
India NA NA NA NA
Indonesia ○
Japan ○ ○
Korea ○ ○
Laos NA NA NA NA
Malaysia ○ ○
Mongolia ○ ○ ○
Myanmar NA NA NA NA
Philippines ○ ○
Singapore NA NA NA NA
Thailand ○ ○ ○
Vietnam ○ ○ ○
Table 1. Responsible agency
function of the following factors: (1) refuse moisture content, (2) availability of nutrients for
methane-generating bacteria, (3) pH, (4) temperature, (5) composition of waste, (6) climatic
conditions at the site where the disposal site is located, (7) structure of the SWDS, and (8)
waste disposal practices [IPCC, 2006; Pierce, 2005].
In the U.S., regulations under the Clean Air Act suggest a default k value of 0.05 yr
-1
for
conventional MSW landfills, except for landfills in dry areas where the recommended
default k is 0.02 yr
-1
. An additional set of default values is provided based on emission
factors in the U.S. EPA’s AP-42, which are a k value of 0.04 yr
-1
for developing estimates for
emission inventories that are considered more representative of MSW landfills where no
leachate recirculation is practiced [USEPA, 1997; Thorneloe, 1999]. However, in the case of
wet landfill or bioreactor landfill, where leachate recirculation is applied, Faour et al. [2007]
analyzed the available recovered landfill gas from wet landfills in order to estimate the gas
emission parameters for wet landfills. They found that conservative LandGEM parameters
for gas collection at wet landfills suggested a k value of 0.3 yr
-1
. In Southeast Asia, there
were some studies investigating the k value by using the pumping test and the surface flux
measurement. The pumping test from a landfill gas recovery project in Thailand showed
that the k value was 0.32 yr
-1
, which was close to the obtained k value from the surface flux
measurement (0.33 yr
-1
) [Wang-Yao et al, 2004; 2010]. In Vietnam, by using surface flux
measurement, it was found that the k value was 0.51 yr
-1
[Ishigaki et al., 2008]. The high
content of rapidly degradable organic carbon combined with high leachate levels in the
waste body might be the main reason for the specifically high degradation rate in these
reports [Wangyao et al., 2008].
Greenhouse Gas Emission from Solid Waste Disposal Sites in Asia
465
2.2 Gasification ratio (DOC
f
)
The gasification ratio is defined as a fraction of the biodegradable carbon to be gasified. At
the first stage of degradation, biodegradable carbon in waste should be converted through
biological degradation, and normally it will be sequestrated or solubilized. Solubilized
carbon will be converted to gas, or discharged from the landfill as leachate. The current
default DOC
f
was determined to be half (50%) of the biodegradable carbon that will be
gasified. The remaining half of the biodegradable carbon is considered to be stored in the
SWDS for long term as lignin or humus. For more accurate estimation, separate DOC
f
values should be defined for specific waste types [IPCC, 2006]; for instance DOC
f
of wood
would be different from that of food. Since the former default DOC
f
was 66%, the DOC
f
value is still under scientific discussion and will likely need revision to reduce the
uncertainty. In regions with higher precipitation, anaerobic sanitary landfills should
discharge larger amounts of carbons. Matsufuji et al. [1996] reported that SWDSs with a
high penetration rate have been found by lysimeter study to leach sometimes more than
10 percent of the carbon in the SWDS. This suggests that DOC
f
in countries with higher
precipitation should account for both the carbon storage in the SWDSs and the carbon
discharge through leachate.
2.3 Methane oxidation (OX)
Up to 50% of emission reduction of the methane oxidation observed at a landfill surface was
achieved with an engineered cover soil structure [Bogner & Matthews, 2003]. Literature
survey conducted by Chanton and Powelson [2009] revealed fraction of methane oxidized
ranged from 11 to 89% with a mean value of 35%. However, the IPCC guidelines
recommended a 10% emission reduction of methane oxidation for managed landfills and a
negligible amount for unmanaged SWDSs [IPCC, 2006]. Since most Asian countries lack
sufficient scientific proofs for setting country-specific OX values, 0-10% oxidation as a
default value was widely adopted.
Tropical rainfall will affect the methane oxidation by the decrease of gas permeability, and
higher temperature will enhance the activity of methanotrophs. Inherently, the percentage
of methane oxidation, i.e., OX, will be determined by the balance of the metabolic rate of
methanotrophs, methane generation, and oxygen supply into the surface layer of SWDSs. In
other words, OX might be partially related to the change of amount of methane emission.
This is why it is difficult to set the appropriate OX and is one of the limitations to applying
the IPCC Waste Model to Asian SWDSs.
Recent research indicated that nitrous oxide, which is a well-known GHG, must be
generated by the activity of methane oxidizing bacteria [Zhang et al., 2009]. Although
nitrous oxide generation should be independent from the estimation of methane emission,
the total reduction capacity of GHGs should be taken into consideration when introducing
methane oxidation technology.
2.4 The methane correction factor (MCF) and manner of degradation
The original concept of the MCF was the expression of inhibition of anaerobic waste
degradation by the structure and management of waste landfills. Well-managed sanitary
landfills were considered to exist under anaerobic conditions, and unmanaged disposal sites
were assumed to be partially aerobic because of their lack of covers and/or compaction.
In the IPCC guidelines, SWDSs possessing deep layers or high water table were assigned
to 20% inhibition of anaerobic degradation, that is, 20% aerobic degradation. SWDSs with
Integrated Waste Management – Volume II
466
shallow layers were assigned to 40% inhibition of anaerobic degradation, since the ratio
of surface area to total volume of waste is higher in these SWDSs than in other categories
of landfill.
Under current practices, semi-aerobical management of landfills will promote aerobic
degradation of waste partially thorough passive ventilation. This provided 50% of inhibition
of anaerobic degradation, based on the experimental results reported by Matsufuji et al
[1996]. This is an overall estimation of methane emission in semi-aerobic condition
compared to that in anaerobic conditions, though the estimation methodology was
developed based on anaerobic waste degradation.
Semi-aerobic landfill management was developed in Japan in the 1970s, and many Asian
countries have adopted this management concept for their landfills. At unmanaged disposal
sites and semi-aerobic landfills, both aerobic and anaerobic degradation will occur
simultaneously in a SWDS and should exhibit a specific degradation manner different from
that of anaerobic-only degradation. At this moment there is no other good model to express
this complicated waste degradation manner. This is a fundamental problem in current
emission estimation from the SWDSs in Asia. Further detailed information on semi-aerobic
landfill management can be found in later sections.
3. Emission estimation in new waste management schemes
3.1 3R activity
Usually, the reduction, reuse, and recycling (3R) activity in the MSW management treats
valuable materials, such as cans, bottles, papers, and plastic packages, in developed
countries. However, recycling of these materials by private sectors has already been
established in societies in most developing countries, including those in Asia [Wilson, 2009].
Therefore, the target material for 3R in such countries will be garbage or food waste. The
first incentive of 3R activity is the reduction of waste disposed in landfill sites. The resource
saving and the pollution reduction are the preferred results from 3R activity. The 3R activity
of food waste will also result in the reduction of landfilled waste, especially in Asia, where
providing enough food to guests is a polite service and/or a symbol of wealth. Since the
reduction of landfilled food waste will decrease the degradable organic carbon in landfills,
this activity will be a methodology for GHG reduction and also be a part of projects of Clean
Development Mechanism (CDM) [Bogner, 2007].
As noted above, 3R activity consists of reduction, reuse, and recycling. Key technologies for
the recycling of food waste are composting (or aerobic digestion) and biogas production (or
anaerobic digestion). The latter requires a substantial investment to build up the system,
including facilities for implementing biogas production. The former, composting, will be the
first choice for 3R activities in most Asian countries. However, it should be noted that some
GHGs (methane and nitrous oxide) will be emitted from the process of composting and
from farmlands applying the compost [IPCC, 2006].
In all types of waste, recycling is tied to the demand for products. The compost made from
food waste should have a quality that meets requests by farmers. A key quality factor for the
waste compost will be mixed trashes, such as plastics, metals, glasses, and the like. These
materials don't alter the effect of the compost when it is used as fertilizer; however, farmers
dislike spreading waste onto their farm land. When the quality of compost produced by
food waste does not meet the requests of farmers, it will become waste, be relegated to the
landfill, and emit GHGs from the residual biodegradable carbon in the compost. Separation
Greenhouse Gas Emission from Solid Waste Disposal Sites in Asia
467
of trashes from the food waste is a key technology for the quality control of food waste and
compost. In addition to the mechanical biological treatment (MBT) in Europe [Pan, 2007],
the segregation of food waste at the source (or home) is a key part of this process. For
example, Hanoi city, Vietnam, has been introducing the segregation of food waste at the
home into their waste management system to reduce landfilled waste.
The reduction of food waste before generation is the most important of the 3R activities, as
well as other waste. This is challenging, however, because it means asking citizens to make
drastic changes in their lifestyle, including changing habits performed historically as part of
their culture. In conclusion, determining ways to raise public awareness about the
importance of “saving food for the environment” remains an unsolved problem and is the
ultimate question that must be answered for the establishment of a sustainable society and
GHG reduction.
3.2 Leachate charge to water body through landfill gas to energy (LFGTE)
Landfill gas (LFG) is formed as a natural by-product of the anaerobic decomposition of
wastes in landfills. Typically, LFG is composed of about 50% methane, 45% carbon dioxide,
and 5% other gases, including hydrogen sulfides and volatile organic compounds. LFG is
thought to be released from six months to two years after waste is placed in the landfill [U.S.
Environmental Protection Agency, 1997]. Methane is a potent GHG, with 21 times the global
warming potential of carbon dioxide. LFG can contribute to malodor and present health and
safety hazards if it is not well controlled. Many landfill sites have installed LFG recovery
and utilization systems or landfill gas to energy (LFGTE) systems to recover the energy
value of LFG and to minimize its pollutant effects.
The two common ways to recover LFG are vertical extraction wells and horizontal
collectors. The standard and most commonly used is the vertical extraction well. The wells
are drilled into the landfill at spacing typically ranging from 45 to 90 m. Pipes 2 to 8 inches
in diameter (typically PVC or HDPE) are placed in the holes, which are backfilled with 1-
inch-diameter, or larger, stones. The pipe is perforated in the lower section where the LFG is
collected. Horizontal extraction collectors or trenches may be installed instead of or in
combination with vertical wells to collect LFG. They consist of excavated trenches (similar to
a pipeline trench) that are backfilled with permeable gravel. Perforated, slotted, or
alternating diameters of pipe are installed in the trench. Horizontal extraction collectors are
less expensive than vertical extraction wells and are particularly suitable for installation in
active filling areas. The advantages of a horizontal extraction collector are low effects from
the high leachate level problem in landfill, less obstruction for landfill operations caused by
collector headers, and easy installation. The disadvantages of a horizontal extraction
collector are high effects from waste settlement and a low recovery efficiency rate per well
[The World Bank, 2004].
In tropical countries, the LFG collection system should be used in concert with good
leachate management practices. Leachate accumulation within the refuse can dramatically
impact the rate of LFG recovery, because liquid in the extraction well and collection trenches
effectively restricts their ability to collect and convey LFG [The World Bank, 2004]. In
Thailand, field experiences indicate that horizontal extraction collectors are more suitable
compared to vertical extraction wells [Eam-O-Ppas and Panpradit, 2003]. The main purpose
of using the horizontal extraction well is the very high leachate level in tropical landfills.
According to the results of geophysics surveys using the electrical resistivity tomography
technique in Thai landfills, the moisture content of waste inside tropical landfills was very
Integrated Waste Management – Volume II
468
high. The distributions of high moisture content were found in all parts of the mass of
waste, even in areas where the waste had been deposited 3 years previously. The level of
leachate was found in the range of 3 to 5 m beneath the final cover (5 to 7 m above ground
level) [Wangyao et al., 2008].
The high level of rapidly degradable organic carbon in the waste stream combined with the
high moisture content in the waste body in tropical landfills can stimulate the anaerobic
degradation and produce more LFG in a shorter time after the wastes have been deposited.
This means that the methane generation rate constant (k) in tropical/wet landfill must be
higher than that in dry landfill, which directly affects the LFGTE. Many studies in Asian
countries have shown that the k values are about 0.32 to 0.51 yr
-1
[Wang-Yao et al., 2004;
Wangyao et al., 2010; Ishigaki et al., 2008]. The high k value also means that the projected
period for LFGTE will be shorter than the period for conventional landfills in Europe and
the U.S. Moreover, the LFGTE projects in small and medium scale landfills in Asian
countries may not be cost effective.
3.3 Semiaerobic landfill management
Semiaerobic landfill systems were developed more than 30 years ago and have since then
been introduced all over Japan. Nowadays, the characteristics of waste have been changed
by the economical situation in many countries and also the technical situation
of pretreatment systems of municipal solid waste such as incinerators, mechanical
shredders, and so on. However, semiaerobic landfill systems are still being installed in new
landfill sites as fundamental technology [Tachifuji, et al., 2009], and are again attracting
attention due to the reduction of GHG emissions from lanfill sites in recent years [Matsufuji,
et al., 2007].
The main structure of the semiaerobic landfill system is the leachate collection pipe, which is
placed on and wrapped by pebbles on the bottom layer. These pipes are linked, with a wide
cross-section of pipe ends opened to the air. The most important functions of this pipe are
the leachate drainage from the waste layer, and to bring air into the waste layer. The
biodegradation process of organic waste can produce heat energy and increase the
temperature (50 °C to 70 °C) of the waste layer. As part of this phenomenon, the air can
enter the landfill body naturally by heat recirculation. Both aerobic and anaerobic conditions
can be created by the leachate collection pipe in the landfill, and thus both nitrification and
denitrification from the leachate can occur.
This system has many advantages, as follows:
1. Cheaper construction and maintenance fee.
2. Less influence on the surrounding environment due the leachate treatment effect.
3. Acceleration of the waste decomposing process by biodegradation due to the increased
aerobic bacterial activity.
4. Reduction of water pressure on the bottom liner and prevention of seepage because of
rapid draining out of the leachate.
5. Reduction of GHG emissions because of the promotion of aerobic bacterial activity by
the expansion of aerobic conditions inside the landfill site.
Recently many countries have started to install this type of landfill system, especially in
Asia. This system is a candidate mitigation method for the CDM project, and the new
methodology for estimating the emission reduction in semiaerobic landfill projects is
waiting for approval by CDM Executive Board of IPCC.
Greenhouse Gas Emission from Solid Waste Disposal Sites in Asia
469
GHG emissions from semi-aerobic landfill are described by using the structure coefficient,
with the MCF estimated as being half as much as that in anaerobic landfills. This effect on
the reduction of GHG emissions by semiaerobic landfills is greatly influenced by the
amount of passive air introduction into the waste layer. Researchers are currently
investigating which parameters have a strong relation to the air inflow rates for improving
the aerobic condition in landfill sites. We hope this examination will provide valuable
information that will lead to wide acceptance of the CDM project for semiaerobic landfill
management.
3.4 Future trends in national communication and NAMAs
On a global scale, the waste management sector makes a relatively minor contribution to
GHG emissions, estimated at approximately 3-5% of total anthropogenic emissions in 2005
[Bogner et al., 2007]. The waste sector is considered to be in a unique position to move from
being a minor source of global emissions to becoming a major sink of emissions [UNEP,
2010]. While the prevention and recovery of wastes is aimed at avoiding emissions in all
other sectors of the economy, the GHG emissions of developing nations are anticipated to
increase significantly as better waste management practices lead to more anaerobic,
methane-producing conditions in landfills. Therefore, nationally appropriate mitigation
actions (NAMAs) have been planned under the specific circumstances of nations. In the
present framework under the Kyoto Protocol, CDM had gained initial concerns about
mitigating GHG emission. CDM activity in the waste sector has been mainly concentrated
on landfill gas capture (where gas is flared or used to generate energy) due to the reduction
in methane emissions that can be achieved.
However, it was recognized that under the LFGTE process, fugitive methane leaks from the
system also contribute to total GHG emissions from landfills. The climate benefit of this
energy generation is attractive in the initial stages though the duration of electricity supply
is limited. Furthermore, since most LFGTE projects cannot provide the estimated emission
reduction, Asian nations realized the limited possibility of mitigation effect on GHG
reduction by insufficient capacity and resources [Ministry of Natural Resources and
Environment [MONRE], 2010].
Although the country-specific situation will affect the choice of mitigation option and
technologies, the energy production was attracted as the most perspective options on
waste-related mitigation as using rice husks to electricity and using biogas to heat and/or
electricity [MONRE, 2010; Office of Natural Resources and Environmental Policy and
Planning, 2011]. Substitution of raw material by the utilization of industrial or agricultural
waste should also be considered, such as using molasses urea to feed dairy cattle [MONRE,
2010]. These mitigation options are focused on the main/important industries in each
nation; however, the ripple effect in scale of these mitigations cannot be expected. In
contrast, direct measures to improve the waste management should be the fundamental
solution to achieve the co-benefit philosophy [Jochem & Madlener, 2003], such as
prohibition of open dumping by 2013 in Indonesia [Hilman, 2010] and solidified fuel
production from the refuse [Ministry of Nature, Environment and Tourism, 2010]. In
addition, waste management provided also socioeconomic and environmental co-benefit in
term of employments and imcomes as well as raising the environmental awareness and
standard. In many developing countries proper waste managements the campaign to
reduce GHG. In Singapore, limitation of disposal land drove to reduce the waste volume by
incineration, simultaneously producing energy (Waste to Energy; WtE). Currently a total of
Integrated Waste Management – Volume II
470
four WtE plants in Singapore contribute 3-4% of the country’s electricity supply [National
Environmental Agency, 2010].
Mitigation options in the waste sector must be determined based on each country’s situation
and development policies. The future planning of a nation’s energy, primary industry, and
manufacturing industry will be key factors when selecting the mitigation actions. The plans
must be appropriate, and the technical support by developed countries must also be
appropriate with regard to the nation’s and world’s future.
4. Conclusion – needs for specific estimation methodology for Asian nations
Disposal of organic waste is a major source of GHG emissions from the waste sector in Asia.
Current estimation schemes for GHG emissions and mitigation at SWDSs were developed in
and for Western countries with temperate climates and lower precipitation zones. There are
several barriers to applying these to Asian countries with tropical climates and higher
precipitation zones. In particular, the basic design of the IPCC Waste Model doesn’t fit the
unmanaged and managed SWDSs in Asia with their higher water flux, permeable cover,
and semi-aerobic configuration. Available measures for the GHG mitigations at SWDSs,
including LFGTE and WtE, have also emerged from Western countries, where the social and
economic background is quite different from that in Asia. For example, in Asia the higher
moisture content of waste, mainly caused by food waste, makes the separation and
processing of food waste difficult, and the higher k value leads to failures of CDM projects
of LFGTE. It is need for the Asian countries to establish appropriate estimation schemes for
GHG emissions and mitigation that reflect their own situations. CDM and other
mechanisms for GHG reduction actively promote several researches, development and
projects for GHG mitigation in the waste sector of Asia. These projects, if successful, will
release Asia from situations of being “unable to comply because of insufficient information”
and reveal measures that are specific and appropriate in Asia. Naturally, appropriate
mitigation of GHG emission from organic waste will achieve local environmental protection
and 3R, that is expressing as the “co-benefit”.
5. Acknowledgment
The authors thank the Ministry of the Environment, Japan for the financial support through
the Global Environmental Research Fund (B-071) and the Environmental Research &
Technology Development Fund (A1001).
6. References
Augenstein, D. & Pacey, J. (1991) Modeling landfill methane generation, Proceedings of the
Sardinia 91, Third International Landfill Symposium, Sardinia, Italy.
Bogner, J.; Abdelrafie Ahmed M.; Diaz, C.; Faaij, A.; Gao, Q.; Hashimoto, S.; Mareckova, K.;
Pipatti, R.; Zhang, T. (2007) Waste Management, In Climate Change 2007: Mitigation.
Contribution of Working Group III to the Fourth Assessment Report of the
Intergovernmental Panel on Climate Change [B. Metz, O.R. Davidson, P.R. Bosch, R.
Dave, L.A. Meyer (eds)], Cambridge University Press, Cambridge, United
Kingdom and New York, NY, USA.