Integrated Waste Management Volume I Part 8 doc
Bạn đang xem bản rút gọn của tài liệu. Xem và tải ngay bản đầy đủ của tài liệu tại đây (4.35 MB, 35 trang )
Integrated Waste Management – Volume I
236
Mougeot L. J. A., (2005). Agropolis: The Social, Political and Environmental Dimensions of Urban
Agriculture. London, Earthscan
MNCR (Movimento Nacional de Catadores de Materiais Recicláveis) (2010). Available from
www.mncr.org.br/
Ongondoa, F. O., Williams, I.D. and Cherrett, T.J. (2011). How are WEEE doing? A global
review of the management of electrical and electronic wastes. Waste Management,
Vol.31, No.4, pp. 714-730
Persson, A. (2006). Characterizing the Policy Instrument Mixes for Municipal Waste in
Sweden and England. European Environment, Vol.16, pp. 213–231
Pinto, T. de P. & González, J. L. R. (2008). Elementos para a organização da coleta seletiva e
projeto dos galpões de triagem. Ministerio das Cidades & Ministerio do Meio
Ambiente. Brasilia
Rocha, G., (2009). Diagnosis of Waste Electric and Electronic Equipment Generation in the
State of Minas Gerais. Fundacao Estadual do Meio Ambiente (FEAM), Governo
Minas, Minas Gerais, Brazil, Available from
<o/Rocha_2009>
Sjöström, M. and Östblom, G. (2010). Decoupling waste generation from economic growth
— A CGE analysis of the Swedish case. Ecological Economics, Vol.69, No.7, pp. 1545-
1552
Suzuki Lima, R. (2007). Resíduos sólidos domiciliares. Um programa de coleta seletiva com inclusão
social. Brasília, Programa de Modernização do Setor Saneamento, Secretaria
Nacional de Saneamento Ambiental, Ministério das Cidades, Governo Federal
Talyan, V., Dahiya, R. P., & Sreekrishnan, T. R. (2008). State of Municipal solid waste
management in Delhi, the capital of India. Waste Management, Vol.28, pp. 1276-1287
Turan, N. G., Coruh, S., Akdemir, A., & Ergun, O. N. (2009). Municipal solid waste
management strategies in Turkey. Waste Management, Vol.29, No.1, pp. 465-469
Vyhnak, C. (2008). Durham region approves huge garbage incinerator. The Toronto Star, Jan.
24, 2008, p. A15
Yates, J. S. & Gutberlet, J. (2011a). Enhancing livelihoods and the urban environment: The
local political framework for integrated organic waste management in Diadema,
Brazil. Journal of Development Studies, Vol.47, No.4, pp. 1-18
Yates, J. S. & Gutberlet, J. (2011b). Re-claiming and re-circulating urban natures: Integrated
organic waste management in Diadema, Brazil. Environment and Planning A,
(accepted 11.03.2011)
Part 3
Industrial Solid Waste
13
Solid Waste Utilization in Foundries
and Metallurgical Plants
Jan Jezierski and Krzysztof Janerka
Department of Foundry, Silesian University of Technology
Poland
1. Introduction
The issue of waste management and utilization in foundries and metallurgical plants covers
a lot of completely different materials in various forms (solid, liquid or gaseous). In this
chapter, solid waste utilization is described based on the experiments and industrial
experiences of Department of Foundry, Silesian University of Technology. The first part of
the chapter introduces the readers into the subject of pneumatic powder injection into liquid
metal process. It is a method widely used to utilize solid wastes in foundries and steel plants
giving good technological and economic results. The casting production process is
inseparably connected with pollutants emission into the environment, that is into air, water,
soil and also noise emission. The fumes and gases from coke-fired furnaces are deposited in
the air as well as other pollutants created when metal is molten in electric furnaces. Their
amount can be limited by use of the modern high efficiency filters but the amount of dusts
to deposit on waste dumps consequently increases. The water contaminations are caused by
open melting furnaces cooling systems. The solid wastes from various production stages
(moulding mass de-dusting, furnace de-dusting, blast cleaners de-dusting, slag etc.) are
deposited on waste dumps. The latter can be utilized after granulation process as a road
building material whereas furnace dusts are treated in recirculation into furnace systems
decreasing their final quantity and improving utilization of some important elements,
mainly iron (Fiore et al., 2008; Lee & Song, 2007; Salihoglu et al., 2007; Fu & Zhang, 2008).
2. Powder pneumatic injection into liquid metal
Materials introduction into foundry furnaces where there is a solid charge at the beginning
and liquid alloy at the end of the melting process, can be operated by many ways. The
introduction method depends on furnace construction (cupola, electric induction furnace,
electric arc furnace etc.), the form of the powder introduced (dust, granulate, briquettes) and
its chemical composition and foundry plant mechanization level (Holtzer et al., 2006;
Jezierski & Janerka, 2008).
The most often used are:
- introduction by hand for the small furnaces and small quantities of materials
introduced (chemical composition correction),
- mechanical introduction with use of vibratory conveyors into charging hopper or
dosing devices. Most often blocks or briquettes are introduced this way along with the
solid charge,
Integrated Waste Management – Volume I
240
- pneumatic introduction of powdered material with carrier gas. This method is one of
the pneumatic conveying applications. The liquid metal inside furnace or ladle replaces
the typical pneumatic conveying receiving device. Powdered material is directly
introduced into metal bath by means of pneumatic feeder and through pipes ended
with an injection lance (Holtzer, 2005).
The two first methods mentioned require a special material pre-treatment which means it
must be de-dusted or granulated or briquetted. They are not appropriate for the
introduction of dusty fractions because of possibility of environmental pollution and the
inefficiency of the metallurgical processes (the dusts are easily sucked out of furnace).
Moreover, it should be emphasized that the most commonly used are waste materials in
form of dust and their granulation or briquetting requires additional devices which
increases total production costs. During pneumatic injection, the use of fine material
particles causes a large contact surface between them and liquid metal and consequently
high dissolution rates of material. Additionally, the lance is introduced inside liquid bath
that eliminates environment dustiness problem and process is intensified by particles and
metal mutual movement, forced by carrier gas stream. Finally, it causes significant physical
chemical processes rate increase when compared to hand operated or mechanical
introduction. These advantages caused that powdered materials pneumatic injection is used
in the following processes (Jezierski & Janerka, 2001; Cholewa, 2008):
- liquid cast iron recarburization inside electric arc furnaces and cupolas (the solid wastes
from carbon materials production processes can be utilized),
- desulphurization and dephosphorization of alloys inside ladles and electric arc
furnaces,
- alloy additions introduction into liquid metal inside ladles, electric arc furnaces and
cupolas (the possibility of utilization of dusts from alloy additions production),
- alloys inoculation or refining and liquid composites production,
- inoculants introduction inside the liquid metal stream during mouldings pouring in,
- slag foaming inside electric arc furnaces during steel production,
- dusts recycling from cupolas and electric arc furnaces de-dusting systems,
- coal dust injection into blast furnaces,
- waste plastics utilization by their injection into blast furnaces.
Many factors determine the correct powder pneumatic injection process. These are:
pneumatic transportation parameters, carrier gas and material mass flow, solid-gas mixture
mass concentration, gas and particles velocity on the lance outlet. These parameters depend
on feeding device construction which should give a possibility of changing individual
parameters. The liquid metal parameters (the initial bath temperature, chemical
composition, metal bath mass), the grade of powdered material and carrier gas play
together an important role, too (Engh & Larsen, 1979; Janerka & Jezierski, 2002). The kind of
carrier gas used depends on the process itself, the reagent being introduced and the furnace.
The powdered material carriers are usually: compressed air, argon or nitrogen. When
carbon materials or dusts are introduced air is mostly employed. Inoculants introduction,
desulphurization and alloy additions introduction into ladle requires argon usage. When
compressed air is used (because of its dampness) the filters, dehydrators or driers are used.
The powdered materials introduced into liquid metals can be divided into: powders
insoluble in liquid metal (forming slag) and soluble reagents which are assimilated by metal
or refine it. This is both for materials utilized earlier in metallurgical processes and for dusts
recycled from various production processes. Powders are characterized by physical
Solid Waste Utilization in Foundries and Metallurgical Plants
241
chemical properties as melting point, gas saturation and solubility inside liquid metal. Their
dampness should be minimal (<0.1%) because of possibility of hydrogen assimilation by
liquid metal. In order to design devices properly and select pneumatic injection parameters
properly, the bulk density and compactibility (the level of density) of the injected materials
must be known. It is important to ensure that the material will not suspend in feeders and
silos which can cause instability in dosing devices. This is particularly important for dusts
created in metallurgical furnaces which possess very strong internal bonds (Janerka, 2010;
Kanafek et al., 1999). As mentioned earlier, the important element of the powder injection
process is a feeder, where the mixing of carrier gas and powder as well as subsequent
diphase stream conveying take place. The powder injection setups used nowadays are of
various constructional and functional designs. The powder feeders should be characteristic
for powder feeding stability, small carrier gas consumption and be hermetic. The feeders
can be divided into two groups – gravitational and pressurized. The gravitational ones work
on loose powder pouring basis. The material portioned with mechanical feeders (with
sectors, cells or feeding screw) is introduced into pipeline and transported with carrier gas
stream. Because the feeders are not completely hermetic when the overpressure on lance
outlet appears (metallostatic pressure), these feeders can be used only when the powder is
introduced solely on the liquid metal surface. In pressure feeders the material into pipeline
introduction is intensified by overpressure in the upper part of the feeder. Solutions like that
are used when the material is transported through longer pipeline and when the injection
lance is submerged into liquid metal (Janerka, 2010; Kokoszka et al., 1999). One of the
features that differ the classic pneumatic conveying (where the receiver is a silo) from
pneumatic injection process (where the receiver is liquid metal) are the working parameters.
For the pneumatic injection the range of transportation parameters differs from those for
pneumatic conveying. The pneumatic conveying is determined mostly by the economic
factors which can be obtained for high solid-gas mixture mass concentration (this parameter
is a quotient of material mass flow and gas mass flow) and small diphase stream velocity. In
injection process technological parameters play the most important role. Therefore high flow
velocity on the lance outlet (Approx. 70÷120 m/s) to ensure high stream energy to achieve
its deeper penetration into liquid metal is applied. The mixture mass concentration is
usually from 8 to 20 kg of solid per kg of gas (Janerka, 2003).
2.1 Recarburization of liquid metal
The projects targeted to limit waste generation may cover the solid metal charge for cast iron
production change and the pig iron can be replaced with steel scrap. The pig iron share may
reach up to 75% of the charge mass. The pig iron is usually blast furnace product and the
carbon content varies from 3.5 to 4.5%C. There are two main pig iron grades: steelmaking
pig iron and foundry pig iron which are supplied to foundry in the form of pigs. The
foundry pig iron can be further divided into: hematite, semi-hematite, normal, phosphoric
and special for ductile iron production. The pig iron production process generates
significant waste amounts and is energy-consuming. It is possible to produce cast iron with
no pig iron at all (synthetic cast iron). In this case it is necessary to compensate carbon deficit
when the pig iron is replaced by steel scrap. The greater utilization of the steel scrap which
is waste material may be considered both from the ecological and the economic point of
view. The price of steel scrap depending on the world situation is three times less than
foundry pig iron. The cast iron smelting on the steel scrap base only forces to more than 3%
carbon content increase. In this case the carburizer mass should be around 3.8 to 5% of the
Integrated Waste Management – Volume I
242
metallic charge mass. This amount depends on carburizer grade and the recarburization
method employed. On the basis of the estimated carbon content in grey iron, steel scrap, pig
iron and carburizer one can proceed with the calculations of the specific charge materials. To
reach 3.2%C content in iron when the heat is made only with the steel scrap, 74% pig iron
and 26% steel scrap should be charged. When 100% of steel scrap is used and the goal is
3.2%C in the final alloy, the introduction of 4.2% carburizer is necessary. These proportions
may vary of course when some portion of the process scrap with the carbon content Approx.
3.2% is introduced into solid charge (Skoczkowski, 1998; Janerka, 2010). The most often used
carburizers are natural graphite, anthracite, synthetic graphite and petroleum coke.
Graphite is a natural mineral and occurs as a 72-80% of carbon rich ore. Its natural colour is
glossy black or steel black. Dependably on amount and kind of impurities in ore the natural
graphite is produced by means of special enrichment. It may be achieved by sorting inside
the air stream and flotation (Janerka et al., 2009). Anthracite is a product of high plant
substances carbonification which contain of 92-97% of elemental carbon. It is characterized
by tar black lustre, high mechanical strength and low volatile parts content of 3-8%.
Synthetic graphite is the name given to graphite obtained during high-temperature process
(graphitization) of the coke (petroleum, coal or pitch) and anthracite. The properties of the
synthetic graphite and its structure degree of order depend on both input material and the
final treatment temperature. Petroleum coke is a solid carbonaceous product obtained
during thermal treatment of the oil distillation residues. The input product for the coking
are heavy residues from various stages and methods of the crude oil refining (Janerka et al.
2009; Janerka, 2010).
The production of those materials is in some degree connected with environment pollution.
It should be emphasized that the necessary amount of carburizer to produce 1t of cast iron is
relatively small and equals 40-50kg. The most environmental friendly carburizers are
natural graphite and anthracite. These are minerals which are only mechanically ground
and calcined when only the volatile parts and some sulphur compounds are emitted into the
atmosphere. Petroleum coke and synthetic graphite, which require high-temperature
processing are much more nuisance to the environment. Materials from the scrap graphite
or carbon electrodes grinding process, materials from graphite linings used in various
industry branches offered by many suppliers, can also be used as carburizers. Foundries
which possess electric arc furnaces we can use their own scrap electrodes as a carburizer .
The production wastes from electrode manufacturers can be also used as carburizers.
Mostly these are dusts from electro-filters with very big carbon content of 97-99%C.
The essential parameter which characterizes the recarburization process from the
technological point of view is its efficiency (recarburization effectiveness, carbon by liquid
metal assimilation ratio). This parameter determines recarburization time and the carburizer
amount to be introduced to obtain the planned carbon content increase. The efficiency (the
effectiveness) of the recarburization is given by equation (Janerka 2010, Chojecki et al. 2002):
100%.
kp
m
nn
CC
EM
MC
(1)
where: C
p
– the initial carbon content, %, C
k
– the final carbon content, %, M
m
– mass of
metal, kg, M
n
– mass of carburizer, kg, C
n
– carbon content in carburizer,%.
The carburizer introduction can be realized by its addition into solid charge, onto liquid
metal surface, onto liquid metal stream or on the ladle bottom. In these cases the carburizer
granulation should be something between 1 and 6mm (with no dust in it). The carburizer
Solid Waste Utilization in Foundries and Metallurgical Plants
243
introduction into solid charge can be realized in electric induction and arc furnaces and
cupolas, too. It is a method which does not require any additional investments to buy the
recarburization devices. The high recarburization level can be achieved by this method with
no melting time extension at all. The use of that method allows not only to correct the
carbon content in alloy but to produce the synthetic iron, too. Therefore it is often used for
the cast iron production.
The carburizer introduction onto liquid metal bath surface is the most common
recarburization method for the electric induction furnaces both for synthetic cast iron and
for cast iron made on a pig iron production method. It is because after the solid charge is
melted the sample for chemical analysis is taken and on its basis the real carbon deficit is
estimated. Moreover, in the electric induction furnaces when the charge is molten, the
continuous electromagnetic stirring occurs what causes an increase of the process efficiency.
For the cupolas and electric arc furnaces the carburizer introduction in carrier gas stream is
often used and the fine (dusty) fractions of carburizers can be utilized.
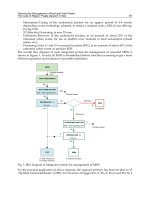
The recarburization setup example is presented in Fig. 1. Its main part is a pressure
container (1) of 0.25 to 1.0m
3
capacity (Janerka, 2010; Kanafek et al., 1999; Kokoszka et al.,
1999). The bell door is situated in the upper part, whereas the mixing chamber (3) is situated
at the bottom. The pressure container is equipped with decompression valve which allows
to decompress the container when the working cycle is finished. The air pressure above the
material being conveyed is regulated by means of the reducer (4). The air supply is started
and stopped with the main valve (10) operation. All the valves can be operated from
container control switchboard (2) or from the control panel situated in the furnace control
room. The container is mounted on the extensometric scales (5) and their recordings are
displayed on the control switchboard (2). The carburizer is transported through a pipe (11)
ended with the injection lance (13) inserted into electric arc furnace (14) and submerged into
liquid metal. The lance can be mounted on the manipulator (12) which allows its automatic
introduction into liquid metal. This method makes the work safer and guarantees better
process repeatability.
The silo (7) with the carburizer can be situated above the feeder and it can have 24hours or
shift working capacity. The screening sieve (8) should be mounted at the top of container to
stop the impurities and oversize. The bottom silo (7) part is a pneumatically driven damper
(slide or swivel). Between damper (6) and chamber feeder (1) the compensator is necessary
to eliminate silo influence on the weighing system. The carburizer is supplied by
manufacturers mostly in big-bags of 1m
3
capacity. On the basis of the author’s experiments
(Janerka 2010; Janerka et al. 2010) and literature overview (Kosowski, 1982; Przeworski,
1986) an analysis of the influence of the introduction method (SC – carburizer into solid
charge addition, S – addition onto metal surface, PI – pneumatic injection), furnace type (IH
– induction furnace, EAF – electric arc furnace) and carburizer grade (GS – synthetic
graphite, GE – ground electrodes scrap) on the recarburization efficiency was carried out
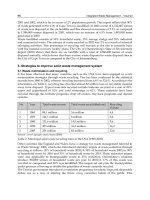
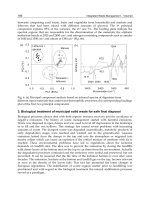
(Fig. 2.). Of course these are average results, because there are many factors which can
change those values all the time. However, some conclusions can be put forward. When the
recarburization efficiencies recorded in induction furnaces for the synthetic graphite and
ground electrodes scrap are compared, it can be seen that they are even higher for the
electrodes scrap.
It is probably an effect of the recarburization method employed but it show that this waste
material makes up the full value of carburizer. The next remark is connected to the
recarburization method. The introduction of carburizer with solid charge in induction
Integrated Waste Management – Volume I
244
furnace allows the foundry to achieve the efficiency respectively 92 and 83% and for the
addition onto metal surface the process efficiency is reduced by Approx. 6%. For the EAF
when the carburizer is added with solid charge the efficiency is 10 to 15% less than for
induction furnace.
Fig. 1. The recarburization setup for the electric arc furnace: 1-pressure container, 2-control
switchboard, 3-mixing chamber, 4-reducer, 5-extensometric scales, 6-slide damper, 7-silo,
8-screening sieve, 9-the compressed air supply, 10-main valve, 11-pipe, 12-lance
manipulator, 13-injection lance, 14-electric arc furnace
For the surface carburizer addition in EAF the recarburization efficiency is at most around
53%. It should be mentioned that such a result can be achieved only after tens of minutes
because of very slow liquid metal movement inside furnace. The process can be accelerated
by mechanical stirring but it is hard to do so. Very high efficiency level in EAF can be
achieve with the use of pneumatic powdered carburizer injection. The 80% efficiency is
recorded just after few minutes after the material has been completely introduced. Our
researches have shown that the diphase stream parameters have strong influence on the
efficiency and rate of the process (Janerka, 2010). These parameters depend on the feeders
construction. Nowadays the devices allow the control of mass gas flow in the range from
0.03 to 0.20kg/s. This parameter directly influences (when the geometry setup does not
change) on the solid-gas velocity on the lance outlet and consequently on the stream
dynamics. The particle velocity inside the pipe can be calculated as a product of the air
velocity and carburizer particle slip coefficient in relation to carrier gas. This coefficient s is
in range s=0.5 to 0.8. Low gas flow causes low velocity and stream energy onto lance outlet
and as a result the limited reaction zone between carburizer and liquid metal (small stream
surface). Large carrier gas flow ensures good stream dynamics but simultaneously as a
Solid Waste Utilization in Foundries and Metallurgical Plants
245
cooling effect significant liquid metal temperature decreases and more intense carbon
oxidation occur (when the carrier gas is compressed air, larger oxygen amount is
introduced). Too large carrier gas flow can cause a carburizer dozing decrease in some
device designs. The material mass flow can be changed in range m
c
= 0.10 to 2.0 kg/s. Small
device output increases recarburization efficiency but extends injection time what causes
liquid metal temperature decrease. Large mass flow causes some carburizer portion not to
be assimilated by liquid metal and floats into surface. It is an important recarburization
process index, too. Of course, these two parameters mainly depend on furnace capacity
which is directly related to the conveying pipe diameter. Badly chosen gas and material
mass flow cause recarburization decrease to 40 to 50%. Undoubtedly pneumatic
recarburization in the electric arc furnaces is the only method to achieve high indexes of that
process.
83,5
77,8
92,5
87,6
53,2
73,5
86,2
0
10
20
30
40
50
60
70
80
90
100
SC_IH_GS S_IH_GS SC_IH_GE S_IH_GE SC_EAF_GE S_EAF_GE PI_EAF_GE
Method _Furnace_Carburizer
E [%]
Fig. 2. The influence of recarburization method, furnace type and carburizer grade on the
recarburization efficiency
2.2 Powder and dust injection into cupola
According to literature data (Ratkovic & Dopp, 2004; Smyksy & Holtzer, 2002, 2007) and
authors’ own experiences the cupola melting process creates dust in amount of between 4
kg/t and 15 kg/t of molten cast iron depending on the charging materials, furnace type and
mass of cupola coke used (or not for coke-less cupolas). In Germany alone cupolas generate
over 30000 t of dust per year. The dust being sucked out includes many valuable elements
which are additionally very harmful (Zn, Pb, Cd). The Fe content is usually higher than 10%,
so the dust itself is a valuable charging material. When the dust contains > 15%C it can be an
extra fuel, too.
Since, nowadays a bigger and bigger part of the charge materials for cupolas (sometimes up
to 40%) comprises automotive scrap, mainly zinc coated sheets, the high Zn content in
cupola dust appears a serious problem. The zinc content in the dust may achieve up to 20%
what means it can be considered as a charge material in zinc metallurgical plants. Moreover,
Integrated Waste Management – Volume I
246
repeated recirculation of dust into the cupola causes an increase in the economic factors of
the process.
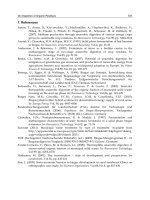
At the Department of Foundry experiments of re-injection of cupola dust together with the
finest fractions of ferrosilicon and anthracite (considered as wastes) were carried out and
resulted in several industrial installations. The experiments were conducted with use of
experimental setup built in the Department of Foundry and one of the most important
results was industrial installation implemented in cast iron foundry, see Fig. 3 where its
scheme was presented.
There are generally two methods of cupola dust treatment (when it is going to be re-used in
furnace), the first is direct pneumatic injection back into furnace and the second is its
briquetting and introduction into furnace in this form (Smyksy & Holtzer, 2002). The
Department of Foundry of Silesian University of Technology has been involved in the
experiments of pneumatic dusts re-injection into cupolas for several years. Their effect,
again with cooperation with POLKO company was designing and implementing of several
installations that are described in the paper on the example of Czech foundry based on
cupolas.
The mentioned foundry wanted to solve the problem of simultaneous injection of three
materials of different characteristics:
-
cupola dust,
-
small fractions of FeSi (considered as wastes),
-
pulverized anthracite.
Therefore the first step of experiments was developing the best mixture recipe both from
metallurgical process (final carbon content in cast iron, impurities level etc.) and
technological (pneumatic conveying parameters, estimated temperature drop etc.) point of
view. Then the preliminary tests were carried out when the materials listed above and their
mixtures: anthracite + FeSi (50% + 50% mass) and cupola dust + FeSi (50% + 50% mass) were
used. The pneumatic injection installation was based on pneumatic chamber feeder of V
n
=
0.25m
3
capacity, see (Kanafek et al., 1999). The pneumatic chamber feeder was equipped
with electronic control system and a precise dosing system within the required flow range
(2÷5 kg/min). The feeder’s mass changes (during injection process) were continuously
recorded with ±0.1kg accuracy which enabled to quickly estimate the powdered material
outflow and in the same way the efficiency of the injection installation in the real time
manner. Apart from the feeder, the installation consists of the elastic pipe of L=25m length
and d
w
=0,025m inside diameter from pneumatic feeder to the end of installation (injection
lances integrated with cupola nozzles/tuyeres). Moreover, some important constructional
changes in the mixing chamber (situated at the bottom part of the feeder, where the
powdered material mixes with the carrier gas) were made. The porous liner to fluidize of
loose material inside the container was situated at the bottom part of pneumatic feeder.
From the technological point of view not only pneumatic conveying parameters but the
transportation stability during the injection cycle was crucial. After some design changes
and parameters adjustment both results were achieved and for the powdered material mass
flow m
c
= 2÷5 kg/min (well inside the requirements) the working cycle remained stable.
The implemented injection system integrated with cupola nozzles made utilization of the
whole mass of dust from dust extraction system possible and the injection process did not
negatively affect the produced alloy quality.
The implementation of the waste utilization method based on pneumatic injection in the
aforementioned foundry enabled the recovery of waste materials received during
Solid Waste Utilization in Foundries and Metallurgical Plants
247
metallurgical processes. Earlier this material was exported from the plant to special
utilization facilities which was relatively expensive. The final economic indexes of the
described foundry application were as follows:
-
high decreasing of production costs about 20%,
-
increasing of the cupola effectiveness about 50%,
-
coke consumption decreasing about 10%.
Fig. 3. Industrial cupola dust injection setup; 1- cupola, 2- wind box, 3- cupola nozzles
(tuyeres), 4- tapping hole, 5- dust removal system, 6- charging door, 7- dust-coal mixture
pneumatic chamber feeder, 8- dust-coal mixture container, 9- dust storage container, 10- coal
pneumatic chamber feeder, 11- ferroalloys pneumatic chamber feeder, 12- ferroalloys
storage container, 13- oxygen blow
2.3 Metallurgical furnace dust injection for slag foaming
One of the biggest problems in metallurgical and foundry industries is a large quantity of
dust generated during production processes. The most important is furnace dust created
when the molten metal is prepared and subsequently sucked out by the dust removal
system (Machado et al., 2006, Ruiz et al., 2007; Vargas et al., 2006). At the Department of
Foundry, the experiments with use of pneumatic injection method were carried out to
utilize these kinds of materials and some results were successfully introduced into industrial
applications. This part of the chapter shows that pneumatic injection technique could and
should be continuously considered as an effective method for dust wastes utilization. The
mass of dust generated during steel-making is enormous according to (Jezierski et al., 2008;
Holtzer, 2005; Fiore et al. 2008). In Europe it is roughly 900 000 t/year, in Japan over 450 000
t/year and in Poland about 60 000 t/year. Over 30% of total steel production is molten
Integrated Waste Management – Volume I
248
nowadays in electric arc furnaces (EAF) and one of the most significant environmental
issues is utilization of dusts, often with high zinc content. Back in 1990s the experiments
were started worldwide with dusts re-injection into melting furnace. The Department of
Foundry of Silesian University of Technology a few years ago carried out the researches and
then industrial implementation of the installation for dusts pneumatic injection back into 65
tons EAF in one of the Polish steel plants. The goal was to utilize the furnace dust in mixture
with pulverized coal what should be good for slag foaming. The EAF’s slag foaming method
is well known and successfully used as a necessary approach for economical electrodes use,
energy management and stability from the melting process point of view (electric arc
stabilization). The scheme of the slag foaming process with use of pneumatic injection
technique for reagent’s mixtures introducing were presented in Fig. 4 below. The mixture of
furnace dust and pulverized coal in the ratio of 3 to 1 was prepared. It was both due to
chemical and technical reasons, firstly, to ensure estimated carbon content to start physical
and chemical foaming reactions and secondarily to ensure fast and stable pneumatic
conveying of the material through pipeline and finally injection lance. The furnace dust
alone causes problems during pneumatic conveying and may suspend inside the feeder.
Fig. 4. The industrial set up for EAF dust-coal mixture pneumatic injection into 65 tons EAF:
1- furnace dust container (feeder), 2- intermediate dust container, 3- pulverized coal
container, 4- furnace dust pneumatic chamber feeder, 5- dust feeding screw, 6- coal feeding
screw, 7- oxygen lance, 8- mixture injection lance, 9- mixture pneumatic feeder, 10- EAF,
11- liquid metal, 12- expanded slag
The carrier gas (compressed air) was dried and the diphase gas-particles stream was created
with use of the pneumatic feeder of own design (the former cooperation with POLKO
company) and injection process started. The chemical composition of furnace dusts was
typical for the steel plant which utilizes industrial scrap including automotive sheets with
high zinc content. The researches were carried out firstly in laboratory conditions on the
semi-industrial setup to estimate pneumatic conveying parameters for the material. After
Solid Waste Utilization in Foundries and Metallurgical Plants
249
this stage the decision of producing a special chamber feeder design (with possible material
fluidization) was made to ensure no material is suspended inside. Then the POLKO
company (one of the best Polish companies in the pneumatic conveying field, formerly a
part of the Department of Foundry) designed and manufactured the complete powder
injection set-up: feeders, pipelines, automation and control devices etc. and the industrial
experiments were started. During the industrial experiments a total of 278 melts were
performed with various material compositions as follows:
-
167 melts with dust-coal mixture injection (90% of dust and 10% of powdered coal),
-
69 melts with dust-coal mixture injection (25% of coal and 75% of dust),
-
42 melts with the coal injection only (for comparison).
The main parameters of the process were:
-
dust size: 0.005÷0.5mm,
-
dust bulk density: 489kg/m
3
,
-
coal grain size: 0÷3mm,
-
coal bulk density: 667kg/m
3
,
-
maximum mass of the mixture injected during one melt: 1330kg,
-
mass composition of the mixture: 75% of dust + 25% of coal,
-
mixture injection time: 10÷15min,
-
system capacity: 0.5÷2.2kg/s,
-
unitary oxygen consumption: 2÷4m
3
/t,
-
unitary dust consumption: 5÷11kg/t,
-
unitary coal consumption: 1÷3kg/t.
The experiments proved high efficiency of the installation and after some minor parameters
adjustments it was successfully commissioned and has been used till now. The energy
consumption rate decreased significantly, the electrodes life extended and the process
stability was improved, too. However, the most important result is that the plant utilizes all
furnace dust generated by itself with several times less dust capacity deposited on dumps.
3. Sand reclamation
After the casting is knocked out the mould the used moulding and core sand become the
by-products. The used sand can be utilized separately or with other components in the
building industry, as a leak stopper on waste storage areas, as a material in concrete
aggregate production and as a filler in a roads building industry. However, the important
issue is to maximise utilization of used moulding sand by foundry plant itself by
employing sand grains reclamation methods. The specific sand component recovery is a
complex issue because the recovery alone is not enough to give the component the
appropriate properties to use it again in new moulding sand preparation. The recovered
components must meet quality requirements and be a fresh components replacement of
full value (Danko, J., & Danko, R., 2004; Danko J. et al., 2007; Danko R., 2004).
The sand reclamation process consists of following actions:
-
preliminary mechanical impurities (metallic ones mainly) from the used sand
separation,
-
agglomerated sand break-up after casting knock out,
-
screening and proper grain size fraction separation,
-
repeated metallic inclusions separation process,
Integrated Waste Management – Volume I
250
- real sand reclamation, dry or wet, the goal is the residues of binding material removal
out of sand matrix, with use of the methods which allow to remove thin material
coating from the grain surface,
-
sand matrix de-dusting or rinsing to remove all the unwanted reclamation products,
proper grain size fraction of specific size and homogeneity separation (the classification
on the grain size basis) (Szlumczyk 2005; Szlumczyk et al., 2007, 2008).
The field of sand reclaim application depends on the sand matrix grains cleanness degree
that is binder from the grain surface removal and reclamation products classification. The
essential reclamation process part is binder removal, that can be realized by abrasive sand
matrix grains mutual reaction. The selection of the devices setup fitted for the reclamation
process depends on the binder grade and the quality requirements for the reclamation
products. The sand reclamation methods can be divided into wet and dry. In the second
group the mechanical and pneumatic reclamation occur in the ambient temperature and
thermal reclamation in the elevated temperature. In the wet reclamation method the used
sand is mixed with water and in the form of pulp is mechanically treated usually in the
rotary device. The sand grains are released not only from thin binder coatings and insoluble
in water impurities but partly from insoluble impurities which can dispergate, too. The sand
matrix after binder separation is rinsed, classified, dried and cooled.
In the mechanical method usually the machines are used which grind (mill), abrade or strike
sand grains. In the pneumatic method which is a specific mechanical method modification,
the binder layer removal is obtained by the collisions and abrasion of the sand grains in the
air flow (cocurrently). In the pneumatic method the used sand conveying stream energy
between technological appliances is employed. It is possible to insert the linear regenerator
into straight segments of the installation which is purposely geometrically shaped (some
throats are introduced) or on the pipe outlet to mount abrasive-percussive cap, which
changes the stream direction. The controlled disturbance in pneumatic stream inside
pipeline intensifies abrasive cleaning of the binder residues from matrix grains process. The
movement of the pneumatically driven particles is defined by the resisting forces caused by
gas and material friction on the pipeline’s walls, particles friction on themselves and gravity
and inertial forces of lifted particles. The reclamation process was carried out on the
installation fitted to sand matrix pneumatic reclamation with the linear regenerator and
abrasive-percussive cap (Szlumczyk 2005; Szlumczyk et al., 2007, 2008). The experimental
reclamation setup consists of the following systems (Fig. 5):
-
high-pressure pneumatic conveying chamber feeder (1),
-
linear regenerator (3) cooperating with the pipeline of D
N
=0.08m diameter,
-
receiver (4) connected to de-dusting system,
-
fluidized air classifier (6) which is a separate device,
-
gas mass flow meter (5),
-
abrasive-percussive cap as a receiver (7),
-
controlling, measuring and regulating instruments.
The linear regenerator parts used in the experiments were shown in Fig. 6. They were made
of wear resistant plastic and their shape corresponds to Witoszynski nozzle on inlet and
Laval nozzle on outlet and such a shape was a result of model experiments described
further in the paper. The analysis of the receiver (abrasive-percussive cap) influence on the
binder coating removal (destroying) process correctness can be based on the maximum air
flow rate. The cap was shown in Fig. 7. According to the stream theory and own research it
can be assumed that for the distance between pipeline outlet point and abrasive-percussive
Solid Waste Utilization in Foundries and Metallurgical Plants
251
cap up to l
1
=0.3m the particles of d
s
>0.3mm diameter, velocity does not change. To simplify:
for the manufacturing method sake it was set up that the inner cap surface shape is a
cylinder of R
1
radius. On the basis of the experiments results as well as calculations it can be
stated that the pneumatic sand matrix reclamation installation is suitable for the sand grades
being examined. The effectiveness of the linear regenerator depends on compressed air
supply system parameters what is essential to achieve proper diphase stream parameters.
These parameters are transportation velocity and mixture mass concentration. The
significant element of the proper process run is the constructional design of the throat. It is
decisive for the resistance of flow. When the throat degree is small, the process efficiency
decreases while for a too large one (over S
p
=4) the resistance increases what makes it
impossible to achieve better efficiency and more than one use of the throat elements on the
sand matrix being reclaimed stream way. The carried out experiments indicated that the
best results of the linear regenerator application were obtained for the flow of w
8
velocity
from 15 to 28m/s and
m
=12 to 25kg/kg mixture mas concentration. In these conditions the
system ensures good sand matrix reclamation process results for the moulding sand being
processed. The use of the abrasive-percussive cap needs the diphase stream velocity on the
pipeline inlet into cap adjusting.
Fig. 5. The experimental setup scheme
The velocity should not exceed critical value what may cause sand matrix grains
deterioration (cracking and scaling). The acceptable velocity of the stream introduced into
cap w
AN
= 35 m/s. When the effectiveness of these two pneumatic sand matrix reclamation
systems is analysed, it can be stated that they are more beneficial than other dry reclamation
systems.
Integrated Waste Management – Volume I
252
Fig. 6. The linear regenerator parts
Fig. 7. The scheme of the stream on the abrasive-percussive cap surface influence process.
4. Physical modelling of the powder injection process
The observation of the diphase stream is often impossible. The conditions that limit direct
observation are high liquid metal temperature (in powder injection into liquid metal
process) or dustiness (in the sand reclamation process). Therefore physical modelling
experiments are carried which allow to some extent to explain the phenomena visible in
diphase stream conveying processes. The experiments on the models must be carried out
with regard to the similarity theory otherwise the results cannot be transferred onto
industrial installations and can be analysed in only exact research conditions. There are
several similarity conditions description methods i.e. relationships between physical
quantities scales which describe some phenomenon being examined. All of them are based
on the dimensional analysis (Clift et al., 1978; Farias & Irons, 1986; Sawda & Itamura, 1989).
Many authors dealt with the issue of the diphase stream (Szekely, 1979; Zhang, & Fruehan,
1991; Zhao &Irons, 1990). Most often the model experiments are conducted on the various
liquids, gases and solids being introduced. The results estimated with the help of the criteria
Solid Waste Utilization in Foundries and Metallurgical Plants
253
number are transferred on the liquid metal conditions. Increasingly, for analysis of these
parameters, numerical modelling and computer simulation of the occurring phenomena is
conducted after previous physical modelling of the powder injection into liquid process
been made. During the observation of gas or gas and solid mixture flow introduced into the
metal bath almost every scientist distinguished two flow states: bubbling (so-called
barbotage) and jet flow. The first is characteristic for the small material mass flow and
velocity on the lance outlet. The mass transport occurs only on bubbles surface, which are
deformed and disintegrated just under the surface of the liquid medium where they are
introduced. The second condition is characteristic for the big material mass flow and
velocity on the lance outlet. The large bubbles deform and disintegrate just on the lance
outlet that causes the large reaction surface between liquid and solid material being
introduced. This condition is much more beneficial than the barbotage. For small injection
velocity the bubbles break away the stream momentarily. When the velocity is higher the
stream penetrates the liquid further and wrinkles and the small bubbles appear. The stream
introduced into liquid causes the injected material with liquid mixing and the assimilated
droplets transport the stream further. When the stream velocity increases the larger gas
amount mixes with the liquid (Janerka et al., 2004).
The goal of the physical modelling is sometimes the introduced diphase stream surface
estimation what is an area of the intense mass transport between solid reagent and metal
bath and the stream penetration range. The aim of the experiments is to show what
parameters and how significantly they influence the shape and size of the diphase stream
area inside liquid medium. Such experiments are carried out on the special setups for the
physical modelling. The example of the setup based on the high pressure pneumatic
conveying chamber feeder is shown in Fig. 8. The material supplier is the pressure container
(1) of 3.0dm
3
capacity.
The closing valve is mounted at the top of the container. The overpressure inside the
container which device efficiency is based on, is regulated by means of the reducing valve
(7). The spring-type pressure gauges in particular setup places were mounted to measure
the overpressure. The carrier gas supplying system consists of compressor (8), cut-off valve
(9) and the reducer with filter (10). The gas flow meter (11) was used to gas flow measuring.
The powders introducing systems contain pipes (12) ended with a lance (13) introduced into
Fig. 8. The example setup for the physical modelling: 1-pressure container, 2-mixing
chamber, 3-scales, 4-closing valve, 5,9-cut-off valves, 6,7-pressure reducers, 8-compressor or
pressurized argon bottle, 10-carrier gas filter, 11-flow meter, 12-pipes, 13-injection lances, 14-
model liquid container, 15-digital camcorder or camera, 16-computer
Integrated Waste Management – Volume I
254
container (14) and made of Plexiglas (dimensions 1000x500x100mm). Every experiment is
recorded on the digital camera (camcorder) and the captured pictures are transferred to the
computer. As a model, powders of water insoluble materials are mostly used (plastics). Such
experimental example with the use of polystyrene and polyethylene of 0.26-1.20mm
diameter was presented below. The injected materials density varied from
= 822÷1240
kg/m
3
. As a model, liquid water and water NaCl solution of 1180 kg/m
3
density were used.
The injection process was carried out with the injection lance of 5mm diameter and it was
sloped at an angle of
=30, 45, 60° to the liquid surface and submerged to depth h=50 and
100mm. The air only injection into liquid medium with various velocities was shown in Fig.
9 while in Fig. 10 next page the diphase stream injection with various parameters was
presented.
Fig. 9. The single phase (the air) injection into liquid medium with velocity of w =6.8 m/s,
w =37.1 m/s and w =78.5 m/s
The single phase stream penetration range increases as the carrier gas mass flow increases.
However, it is several times smaller than for the diphase stream injected under the same
pneumatic conveying parameters. It is because the higher diphase stream energy is mainly
kinetic. The diphase stream injection causes fewer disadvantageous phenomena appearance
on the liquid surface (splatters). The higher stream penetration range is also obtained when
small particles are introduced. It may occur because the smaller particles present higher
velocity on the lance outlet and the liquid medium resistance for these particles is less. This
is a good condition (from the process point of view) because smaller particles give larger
extended surface of the injected powder for the same total volume of the injected particles. It
results in higher technological indexes such efficiency and recarburization rate. However,
fine powders of small density cause problems during pneumatic conveying because of their
tendency to go into suspension inside chamber feeders and non-uniform falling down the
container.
The diphase stream area can be divided into four characteristic zones (Fig. 11).
Zone I – close to the lance outlet. In this area large gas bubbles of irregular shape are
created. Their size and number depend on gas flow. When the flow is higher, bubbles break
Solid Waste Utilization in Foundries and Metallurgical Plants
255
away from the lance faster and faster disintegrate and again new bubbles are created. The
carburizer particles are captured in them and after the bubbles burst they will have a contact
with liquid metal. However, it occurs close to or even on the metal surface. The mass
exchange takes place as a result of metal movement and carburizer grains floating on the
metal surface. This is a disadvantageous phenomenon but it can be minimized with the gas
velocity on the lance outlet increase.
Fig. 10. The diphase stream injection for the particles of d
c
=0.833 mm diameter and =882
kg/m
3
density, liquid density
osr
=1000kg/m
3
(left) and
osr
=1180 kg/m
3
(right picture)
Zone II is a direct stream range area. It mainly consists of carburizer particles because only
they have enough energy to infiltrate the liquid metal so deeply. The mass exchange process
is the most intense in this zone because the particles have significant velocity so the near-
surface diffusive layer thickness is very small.
Zone III is the area of the smallest particles having direct contact with liquid metal. Its area
is the largest and it may be assumed that it determines the process efficiency. The size of this
zone is a consequence of zone II creation.
Zone IV consists of bubbles of spherical, ellipsoidal or spherical cap shape, dependably on
the bubble creation place and its size. Moving towards the surface the hydrostatic pressure
decreases what causes their growth. Being in liquid metal they heat themselves additionally
and their volume increases. They burst close to or on metal surface so the particles are there
Integrated Waste Management – Volume I
256
partly uplifted. The carburizer particles are captured inside these bubbles and the mass
exchange occurs after their bursting under the liquid metal surface what significantly
decreases the process total efficiency.
Fig. 11. The shape and area of the diphase stream: 1-carburizer particles, 2-gas bubbles
Under industrial conditions of pneumatic recarburization the estimated process efficiency is
obtained thanks to overpressure and exchangeable nozzles in dosing device changes. It
allows controlling gas flow as a one of the main parameters of pneumatic conveying
process. The dosing device output increase is obtained mostly by increasing overpressure
inside chamber feeder container. Subsequently the flow increase (mass gas and material
flow) causes adequate surface area, width and penetration range of the diphase stream
increase. The fine particles injection is very beneficial not only from metallurgical point of
view (large contact surface between reacting phases) but because the more significant
diphase stream surface and direct reaction zone metal-carburizer increase, too.
The model experiments were carried out to select the best geometrical layout of the throats
used in the linear regenerator, too. The research consist of stream flow conditions analysis in
various geometrical throat layouts inside pipe system. The aim was to force the flow
instability that causes mutual particle interaction. During the experiments the stream flow of
various mass concentration velocities and the pressure drop on the measured section of the
pipe system were recorded. The particles distribution inside this stream was analysed.
These experiments were also recorded photographically. Typical photographs of the solid
particles distribution inside diphase stream were presented in Fig. 12.
The model experiments were employed to optimize constructional setup of the throats in
the linear regenerator and to estimate their shape (Witoszynski nozzle on the inlet and Laval
nozzle in the outlet). These sections were made of transparent material (Plexiglas) to make
particles movement observation during the diphase stream flow possible. The solid particles
were granulated polypropylene ones of 2-3mm size and black and white colours. The
recordings and observations results allow analysing the diphase stream flow parameters
inside the particular linear regenerator sections. The particles agglomerations are visible on
the linear regenerator inlet (throat) what suggests their mutual interactions intensity
increase with the small resistance of flow caused by differential pressure.
Solid Waste Utilization in Foundries and Metallurgical Plants
257
Fig. 12. The stream flow inside model linear regenerator system
4.1 Diphase gas-particles stream force model analysis
The experiments (as a continuation of the model experiments described above) were carried
out to understand the character of diphase stream forces on liquid surface in powder
injection process. The short description of work methodology and apparatus are mentioned
in the paper as well as the examples of the results obtained. The work presented in the
paper is a part of a large scaled experimental plan that should explain important relations
between injection technological indexes and dynamics of the diphase stream. The research
stand is presented on fig. and its complete description was presented in previously
published paper (Jezierski et al. 2006) but instead of furnace or ladle a measuring device is
situated at the end of the injection system and connected to PC computer, see Fig. 13.
The experiments were conducted as part of the experimental plan for various lances
geometries, pneumatic parameters and injected powdered materials sorts. Use of PC
computer with dedicated program allowed to measure stream force value with frequency 10
measurements per second. So we can say that the stream force measurement was almost
continuous. The powdered material used in the experiment was polystyrene with
granulation 0.4mm with the air as a carrier gas. The distance between lance outlet and an
extensometric measuring device’s surface was established at three levels: 10, 40, 80mm
because one of the problems to solve was that distance influences stream force’s value
achieved.
The full experimental plan included 27 experiments for various process parameters
configurations separately made. Apart from a grain size there were four another
independent variables during experiments:
-
a carrier gas (compressed air) pressure p
1
, (three levels of changing: 0.1; 0.2; 0.3 MPa),
-
a gas into dispenser pressure p
4
(six levels of changing: from 0.05 to 0.3MPa with step
0.05MPa),
-
a distance between lance outlet and measuring device surface H (10, 40 and 80mm),
-
a lance inside diameter d
w
, (three levels of changing: 5.6; 6.1 and 7.6mm).
The results of the recordings and calculations were used to analyze and to create the graphs
to show time-changing character of stream force. The examples of the graphs for
experiments with use of lance with inside diameter 6.1mm were presented below in Fig. 14.
One can see a characteristic peak at the end of the blowing. It is connected to moment when
the last portion of mixture is blown through the injection lance. From technological point of
Integrated Waste Management – Volume I
258
view the most important is the period when force stabilizes in the middle of the cycle
because in real industrial conditions we are interested mainly in the process stability. When
one looks precisely at graphs one can see that for some combination of pneumatic
parameters p
1
and p
4
quite considerable stream force fluctuations can be seen. It is mostly
present in cases when the pressure into container (above powdered material) p
4
has value
from the highest levels equal 0.25 or 0.3MPa and carrier gas pressure p
1
has the smallest
value equal 0.1MPa (Fig. 15 next page). In such conditions for small lance’s inside diameter
the mass concentration of diphase mixture value is too big so the pneumatic conveying
character seems to be pulsating not stable.
Fig. 13. Scheme of research setup; 1- pneumatic powder chamber feeder, 2- pipeline,
3- injection lance of special design, 4- stream force measuring electronic device, 5- carrier gas
flow meter, 6- extensometric device, 7- carrier gas (compressed air) supply, 8- slidable arm,
9- PC computer, H- changeable distance between lance outlet and measuring device
The paper presents graphs for only one chosen inside diameter lance d
w
= 6.1mm but the
described problems and relationships between process parameters were present in others
examined lances, too. The fluctuations of force values were the biggest with use of the
smallest lance of 5.6mm diameter and the most stable process was observed for the lance of
7.6mm inside diameter.
The next step was statistical analysis of recorded and calculated data. The average value of
stream force in stable (during the stable cycle period) was calculated, the experimental
equations were formulated and graphs were made. Below are presented some of them for
Solid Waste Utilization in Foundries and Metallurgical Plants
259
the parameters analogical to these on the stream force’s time-changing graphs, see Fig. 16
and 17 next pages.
0
0,5
1
1,5
2
2,5
3
3,5
4
4,5
5
5,5
6
0 0,5 1 1,5 2 2,5 3 3,5 4 4,5
time t[s]
stream force F[mN]
p1=0,1 p4=0,05
p1=0,1 p4=0,1
p1=0,1 p4=0,15
p1=0,1 p4=0,2
p1=0,1 p4=0,25
p1=0,1 p4=0,3
Fig. 14. Diphase stream force character for parameters as follows: lance diameter
d
w
= 6.1mm, distance between lance outlet and measuring device’s surface H = 40mm,
carrier gas pressure p
1
= 0.1MPa, powdered material – polyethylene of granulation 0.4mm
0
0,5
1
1,5
2
2,5
3
3,5
4
4,5
5
00,511,522,5 33,544,55
time t[s]
stream force F[mN]
p1=0,1 p4=0,05
p1=0,1 p4=0,1
p1=0,1 p4=0,15
p1=0,1 p4=0,2
p1=0,1 p4=0,25
p1=0,1 p4=0,3
Fig. 15. Diphase stream force character for parameters as follows: lance diameter
d
w
= 6.1mm, distance between lance outlet and measuring device’s surface H = 80mm,
carrier gas pressure p
1
= 0.1MPa, powdered material – polyethylene of granulation 0.4mm
Integrated Waste Management – Volume I
260
k
F 0,785 0,032 w 0,019
µ
(2)
where: w
k
– gas velocity, µ - mass mixture concentration.
The described experiments have drawn to the following conclusions:
1.
Velocity of the carrier gas in the lance outlet depends mostly (the same geometrical
conditions) on inside lance diameter and mostly influence diphase stream force value.
2.
Diphase stream force value increases with increasing pressures (especially pressure in
powder feeder p
4
which increase cause mass concentration µ increasing) and decreases
with increasing of distance between lance outlet and measuring surface (liquid metal
bath). For distances above 40mm the value was so small that it was impossible to
measure with used equipment.
3.
The proper period of injection cycle for industrial conditions is in the middle of the
process, when the stream force has good stability. The moment which show the finish
peak introduced quite considerable amount of carrier gas with last portion of powder
injected.
4.
Mass concentration of the diphase mixture and velocity of carrier gas in the lance outlet
have decisive influence on the analyzed force. But the value of µ should not be above
20-30kg/kg because the higher values cause high instability of conveying process.
Fig. 16. Influence of gas velocity in lance outlet and mass concentration on the stream force
(d
w
= 6.1mm, H = 10mm)
The further model experiments were carried out with the liquid medium and they proved
the previously made researches without liquid usage. The stream force value corresponds
strongly with the ability of the stream to infiltrate the liquid with the high stream
penetration range.