Integrated Waste Management Volume I Part 9 doc
Bạn đang xem bản rút gọn của tài liệu. Xem và tải ngay bản đầy đủ của tài liệu tại đây (798.71 KB, 35 trang )
Economic and Operational Feasibility Analysis of Solid Waste Minimization Projects
271
metals to a recycling processor, a process change could be implemented that requires
employees to separate plastics from metals before shipment. There is little to no initial
investment for this example, but there will be added labour costs for separation versus the
additional revenue generated by the finer sort to the processor. If the additional revenues
outweigh the additional costs, the alternative should be implemented.
For projects with significant initial investments or capital costs, a more detailed profitability
analysis is needed. The three standard measures of profitability are:
Payback period
Internal rate of return (IRR)
Net present value (NPV)
The payback period for a project is the amount of time required to recover the initial cash
outlay for the project. The formula for calculating the payback period is on a pre-tax basis in
years is:
Payback Period
Capital Investment
Annual operating cost savings
(1)
For example, suppose a manufacturer installs a cardboard baler for a total cost of $65,000. If
the baler is expected to save the company $20,000 per year, then the payback period is 3.25
years. Payback period is typically measured in years; however, some alternatives may have
payback periods in terms of months. Many organizations use the payback period as a
screening method before conducting a full financial analysis. If the alternative does not meet
a predetermined threshold, the alternative is rejected. Payback periods in the range of three
to four years are usually considered acceptable for low risk investments. Again, this method
is recommended for quick assessments of profitability. If large capital expenditures are
involved, it should be followed by a more strenuous financial analysis such at the IRR and
NPV.
The internal rate of return (IRR) and net present value (NPV) are both discounted cash flow
techniques for determining profitability and determining if a waste minimization alternative
will improve the financial position of the company. Many organizations use these methods
for ranking capital projects that are competing for funds, such as the case with the various
waste minimization alternatives. Capital funding for a project can depend on the ability of
the project to generate positive cash flows beyond the payback period to realize an
acceptable return on investment. Both the IRR and NPV recognize the time value of money
by discounting the projected future net cash flows to the present. For investments with a
low level of risk, an after tax IRR of 12 to 15% if typically acceptable.
The formula for NPV is:
N
Ct
(1 r )t
t 0
NPV
(2)
Each cash inflow/outflow is discounted back to its present value (PV). Then they are
summed. Therefore
Where
t - the time of the cash flow
272
Integrated Waste Management – Volume I
N - the total time of the project
r - the discount rate (the rate of return that could be earned on an investment in the
financial markets with similar risk.)
Ct - the net cash flow (the amount of cash) at time t (for educational purposes, C0 is
commonly placed to the left of the sum to emphasize its role as the initial investment).
The internal rate of return (IRR) is a capital budgeting metric used by firms to decide
whether they should make investments. It is an indicator of the efficiency of an investment,
as opposed to net present value (NPV), which indicates value or magnitude. The IRR is the
annualized effective compounded return rate which can be earned on the invested capital,
i.e., the yield on the investment.
A project is a good investment proposition if its IRR is greater than the rate of return that
could be earned by alternate investments (investing in other projects, buying bonds, or
investing the money in a bank account). Thus, the IRR should be compared to any
alternative costs of capital and should include an appropriate risk premium.
Mathematically, the IRR is defined as any discount rate that results in a net present value of
zero for a series of cash flows. In general, if the IRR is greater than the project's cost of
capital, or hurdle rate, the project will add value for the company. The equation for IRR is:
N
Ct
0
(1 r )t
t 0
NPV
(3)
Most spreadsheet programs typically have the ability to automatically calculate IRR and
NPV form a series of cash flows. Following is an example applying these financial
evaluation concepts. For example, the baler case study discussed previously had an initial
cost of $65,000 and $20,000 in annual savings. Additionally, the assumed baler life span was
10 years and an organization minimum attractive rate of return (MARR) was 15%. The
MARR is the is the minimum return on a project that a manager is willing to accept before
starting a project, given its risk and the opportunity cost of foregoing other projects. The
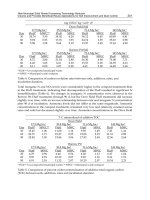
following cash flows, IRR, and NPV result:
Year
0
1
2
3
4
5
6
7
8
9
10
IRR
NPV
Table 1. Net present value analysis
Cash Flow
$(65,000)
$20,000
$20,000
$20,000
$20,000
$20,000
$20,000
$20,000
$20,000
$20,000
$20,000
28.2%
$30,761
Economic and Operational Feasibility Analysis of Solid Waste Minimization Projects
273
As shown in the last two rows of Table 1, the IRR is 28.2% and the NPV is nearly $31,000 at a
MARR of 15%. The fact that the IRR is greater than the 15% MARR and the fact that the NPV
is positive indicates that the project is a good financial decision.
3.3 Sustainability and organisational culture feasibility
Waste minimization alternatives should also be evaluated based on sustainability and the
cultural fit within the organization. Sustainability is defined as an organization’s investment
in a system of life, projected to be viable on an ongoing basis that provides quality of life for
all individuals and preserves natural ecosystems. Sustainability in its simplest form
describes a characteristic of a process that can be maintained at a certain level indefinitely.
The term, in its environmental usage, refers to the potential longevity of vital human
ecological support systems, such as the planet's climatic system, systems of agriculture,
industry, forestry, fisheries, and the systems on which they depend. In other words, the
waste minimization alternatives should be evaluated based on how well they meet this
definition, such that the alternative can be sustained without large amounts of effort or
additional resources and continue to protect the environment. Often, this will be related to
the culture of the organization. Criteria commonly used to evaluate the sustainability of an
alternative include:
Dealing transparently and systemically with risk, uncertainty and irreversibility
Ensuring appropriate valuation, appreciation and restoration of nature
Integration of environmental, social, human and economic goals in policies and
activities
Equal opportunity and community participation/Sustainable community
Conservation of biodiversity and ecological integrity
Ensuring inter-generational equity
Recognizing the global integration of localities
A commitment to best practice
No net loss of human capital or natural capital
The principle of continuous improvement
The need for good governance
When an alternative involves working with a recycler or commodity broker there are several
key questions to ask potential candidates to determine the best fit for the organization.
Those questions include:
What types of materials does the company accept and how must they be prepared?
What contract terms does the buyer require?
Who provides the transportation?
What is the schedule of collections?
What are the maximum allowable contaminant levels and what is the procedure for
dealing with rejected loads?
Are there minimum quantity requirements?
Where will be recyclable material be weighed?
Who will provide containers for recyclables?
Can “escape clauses” be included in the contract?
Be sure to check references.
In a similar way, when working with equipment vendors, there a several key questions to
consider:
274
Integrated Waste Management – Volume I
What is the total cost of the equipment including freight and installation?
What are the building requirements and specifications for the equipment (compressed
air, electricity, space, minimum door widths)?
Does a service contract included in the purchase price or is there an additional charge?
Do you offer training to the employees, engineers, and maintenance employees that will
be working with the equipment, if so, is there a charge?
What is the process if the equipment malfunctions and the company needs support, is
there a representative available 24 hours per day? What is the charge for these visits?
Do you offer an acceptance test process to ensure that the equipment operates within
the promised specifications (capacity and cycle time)?
What is the required installation time and must production be shut down?
4. Case study
In 2008, the Lucas County Solid Waste Management District (District) located in Ohio, USA,
considered the purchase of a material recovery facility (MRF) to sort and sell nearly 10,000
tons recyclable materials that were collected per year from its municipal recycling programs.
This section analyzes the economic and operational feasibility of the MRF as an option for
processing recyclable materials and may serve as an example for other local governments
considering the implementation of such a system. A strong emphasis is placed on economic
efficiencies and a sensitivity analysis is also discussed. A break-even analysis is discussed to
determine the degree by which the existing conditions would need to change in order to
allow such a facility to become feasible (or infeasible).
Based on a literature review of previous research conducted in this field, three relevant
articles were found. The first was published in 1995 and is titled “The development of
material recovery facilities in the United States: status and cost structure analysis” (Chang
and Wang, 1995). This article examined a fast track MRF development in the U.S. and the
related operating and cost structures. The purpose of the paper was to create solid waste
management strategies and to aid in future investment forecasting or policy decisions. The
second paper was published in 2005 and is titled “Sustainable pattern analysis of a publicly
owned material recovery facility in a fast-growing urban setting under uncertainty” (Daliva
and Chang, 2005). This research applied grey integer programming techniques to screen
optimal shipping patterns and the outcome was an ideal MRF location and capacity design.
The final paper was a report published in 1994 by the Pennsylvania Department of
Environmental Protection and is titled “Lycoming County Material Recovery Facility
Evaluation” (Beck, 2004). This research evaluated the operational efficiency and
cost/revenue of a Lycoming County MRF. The paper also identified methods that the
facility, and others like it, could be made more financially sustainable over the long term.
4.1 Methodology
The methodology used to conduct this research was based on the principles outlined in the
third edition of “Facilities Planning” (Tompkins, et. al., 2003). This book provides an
industrial engineering basis for defining facility requirements, identifying equipment needs,
developing layouts, and implementing facility plans. This research examined the hypothesis
that a county owned MRF could be cost justified and financially advantageous versus the
Economic and Operational Feasibility Analysis of Solid Waste Minimization Projects
275
current system of outsourcing in Lucas County, Ohio. The assumptions for this case study
included:
The useful life of the MRF is 20 years (2007 to 2027)
A minimum attractive rate of return (MARR) of 15% was fixed over the 20 year project
life for financial decisions
Recycling levels would increase at annual rates of 5% for fiber, 3% for plastics, 2% for
glass, and remain constant for metals over the 20 year project life.
Recycling commodity prices would remain increase at a rate of 2.5% the 20 year project
life.
Utility costs would increase at a rate of 2.5% per year over the 20 year project life
(inflation).
Labour and benefit costs would increase at a rate of 3.5% per year over the 20 year
project life (inflation).
The first phase of the analysis process involved estimating the current recycling levels in
terms of materials compositions and volumes (annual tonnages). These data were collected
from District records from the 2007 fiscal year and included operating cost and revenue
data. Once combined, this information provided a complete baseline of the operations of the
current system utilizing the outsourced processes. This baseline was used to compare the
cost structure of acquiring a county owned and operated MRF. The baseline data provided
annualized costs and revenues associated with the existing drop-off recycling program,
specifically:
Revenue paid from third party processors for recyclable materials
Third party processing fees
Labour costs
Administrative costs
Vehicle costs (fuel, maintenance, repair)
Drop off container and material costs
The second phase involved indentifying potential MRF sites. A local business realtor was
contacted for assistance. Upon the identification of the optimal MRF site, a complete annual
cost and revenue projection was conducted to operate the MRF over a 20 year period. This
analysis included the following annualized costs and revenues:
Revenue paid from third party recycling material commodity brokers
Building purchase cost (including realtor fees)
Building modification and renovation costs
Equipment and inspection/repair costs
Labour costs (including driver and processors)
Administrative costs
Utility costs
Vehicle costs (fuel, maintenance, repair)
Drop off container and material costs
This financial projection of the proposed MRF was compared with the current system
baseline. In essence, the analysis answered the question whether the additional revenue
earned from the sale of the processed recyclable materials outweighed the additional capital
and operating costs over the projected 20 year life of the project at a 15% minimum
attractive rate of return. To accomplish this analysis, a net present worth (NPW) was
conducted. This method not only allows the selection of a single project based on the NPW
276
Integrated Waste Management – Volume I
value and in the case of this case study, the existing system of outsourcing versus
purchasing and operating a county owned MRF.
To find the NPW of a project an interest rate is needed to discount the future cash flows. The
most appropriate value to use for this interest rate is the rate of return that one can obtain
from investing the money elsewhere. Alternatively, it may be the rate that an organization
will be charged if it had to borrow the money. The selection of this rate is a policy decision
by organizational management and is usually based on market conditions.
To begin this process, the District determined the net cash flow in each period over the
service life of the project. Considering the MARR, each of these net cash flows was
discounted back to the present time (year zero at the start of the project). The magnitude of
NPW determines whether the project is accepted or rejected. If NPW is positive, the decision
is to accept the project. If it is negative, then the investment is not worthwhile economically.
If it is zero, then the project does not make a difference economically.
It is also possible to conduct a break-even interest rate analysis by varying the value of the
interest rate while computing the NPW of a project. The break-even interest rate is the rate
at which NPW is zero. The break-even interest rate is also known as the internal rate of
return (IRR).
4.2 Overview of the current recycling process
Recycling services provided by the District to the local community are accomplished via a
drop-off program. In Lucas County, the District collects two recycling streams from over 60
drop off sites throughout the community. These two material streams are commingled
paper products and commingled containers. The drop-off sites are located at grocery stores,
schools, metro parks, township offices, and large apartment complexes. Each drop off site
has at least two five-cubic yard dumpsters, one for each recycling stream. At high volume
sites, multiple containers are utilized for the two recycling streams. Below is a summary of
the total tons of each waste collected in 2006 at the drop-off sites:
4,368 tons of ONP and MOP
2,912 tons of OCC
1,493 tons of glass bottles
677 tons of plastic bottles
235 tons of steel cans
70 tons of aluminium cans
4.3 Current system costs and revenue
Under the current system the District’s drop-off program was operating at a $425,462 loss
per year considering revenue minus expenses. The loss is offset by additional revenue
generated by the District. The additional revenue is primarily generated from a $3 per ton
surcharge on all solid waste generated in Lucas County. This surcharge is collected by the
landfills that serve Lucas County and amounts to approximately $1.5 million per year.
Under the current contract the District has entered with a third party processor, the District
generates the following revenue per ton of material (please note the District is paid based on
commingled materials that require additional sorts):
$37.08 per ton of commingled fiber (OCC, MOP, ONP)
$23.35 per ton of commingled containers (aluminium/steel can and plastic)
Economic and Operational Feasibility Analysis of Solid Waste Minimization Projects
277
Per year, the District generates $327,734 from the sale of recyclables to the third party
processor. This revenue is offset by the following annual costs:
$350,196 for truck diesel fuel costs
$5,500 for annual maintenance costs
$7,500 for drop-off site container costs and maintenance
$240,000 for trucdk driver salaries and benefits for the four drivers employed by the
District (one drive is a team leader that operates a vehicle as needed)
$150,000 for administrative costs which include the Solid Waste District Manager’s and
administrative assistant’s salary and benefits in addition to supply costs.
4.4 Proposed system costs and revenue
Under the proposed system the District’s drop-off program will operate at an $189,327 loss
per year considering revenue minus expenses. The revenue generated from the sale of the
sorted recyclable materials was calculated using the current values of the Chicago material
prices listed below (current as of 2/2008):
Mixed office paper - $82/ baled ton
White ledger - $102/baled ton
Newspaper - $55/baled ton
Cardboard - $110/baled ton
Aluminum cans - $180/crushed and baled ton
Steel cans - $180/crushed and baled ton
Plastic bottles - $180/crushed and baled ton
Glass bottles - $25/ton
Based on the forecasted volumes and commodity prices, the District will generate $844,197
annually from the sale of the recyclable materials to commodity brokers. From an expense
standpoint, the new system will require additional money to operate and to maintain the
MRF, specifically, the cost of the building, labour costs, utility, costs, maintenance costs, and
management/administrative costs. The cost of the building will be addressed in the
comparison and justification portion of this chapter. Specifically, the costs for the proposed
system are:
$365,100 for truck diesel fuel costs (this is up slightly from the current system due to the
location of the proposed MRF and the additional required miles for the trucks to
deposit material there)
$5,500 for annual maintenance costs (no change from the current system)
$7,500 for drop-off site container costs and maintenance (no change from the current
system)
$240,000 for truck driver salaries and benefits for the four drivers employed by the
District (no change from the current system)
$186,400 in labour costs for employees to operate the MRF (these were discussed in the
previous section)
$190,000 for administrative costs which include the Solid Waste District Manager’s and
administrative assistant’s salary and benefits in addition to supply costs (the proposed
system includes $40,000 for a District employee to supervise the MRF)
$39,024 in utility and building maintenance costs for the MRF
The utility and building maintenance costs were estimated from the current costs of the
proposed site as determined from existing records.
278
Integrated Waste Management – Volume I
4.5 Financial comparison and analysis
To complete the financial analysis the Full Cost Accounting for Municipal Solid Waste,
published the US Environmental Protection Agency, was used as a guide (US EPA, 2006).
The proposed system will result in an annual cost savings of $236,135 versus the existing
system of outsourcing. This was calculated by taking the projected annual net revenue (cost)
of the proposed system minus the annual net revenue (cost) of the current system. Both
system will result in a net cost for the District, (-$189,327 for the proposed system minus $425,462 of the current system). The initial investment for the proposed system, which
includes the cost of the building and renovations, is $973,050. The breakdown for this
amount is $900,000 for the building and equipment and an additional $73,050 to refurbish
the building and equipment. The $73,050 is the total amount provided by contactors based
on inspection of the building and equipment. The payback period for the proposed system
is 4.12 years (or four years and 1.5 months) and the internal rate of return for the first five
years of operation is 6.8% and 20.5% for the first 10 years of operation. Working with the
Lucas County Commissioners a $1,000,000 bond at 6% interest will be established with a 20
year payback period to acquire the fund for the initial investment of $973,050.
4.6 Breakeven and sensitivity analysis
From a financially standpoint, the proposed system has a payback period 4.12 years and an
internal rate of return of 20.5% over 10 years based on the market assumptions stated earlier.
A critical concern involves analyzing changes to these assumptions and the impact to the
decision to implement. The breakeven point and a sensitivity analysis of the proposed
system based on changes in market conditions will answer address this concern. From a
breakeven standpoint, two market changes were analyzed:
The lowest level that the amounts of material recycled (in tons) by the District could fall
and still achieve a 10 year IRR of 6.5%
The lowest level that the dollar values of the waste commodities could fall and still
achieve a 10 year IRR of 6.5%
The breakeven point for the amount of materials collected by the District and the dollar
values for the waste commodities was analyzed. An analysis of the data indicated that the
amount of materials collected by the District could drop by 13% or 1,300 tons from the
estimate to achieve an IRR of 6.5%. This would amount to an $110,000 reduction in revenue
per year for the District. On average, the amount of materials collected by the District has
increase by 3% to 5%, so this is not a large concern. Similarly, the dollar values provided by
the commodity brokers based on the market rates could drop and average of 13% for each
material type from the current conditions to achieve an IRR of 6.5%. This would also
amount to an $110,000 reduction in revenue per year for the District.
A sensitivity analysis was conducted to determine which variables would have the largest
impact on the revenue target, hence meeting the IRR, if they were reduced. To accomplish
this, each variable was reduced by 5% while all other variables were held constant and the
percent change in revenue was measured. The variables analyzed were:
Amounts of materials collected (measured in tons)
Dollar value per ton of recycling material
From this analysis OCC amounts and their price were most sensitive to changes and
therefore have the largest impact on total revenue and IRR. A 5% reduction in the amount
collected annually or the dollar value per ton of OCC reduced the total revenue by 2%.
Economic and Operational Feasibility Analysis of Solid Waste Minimization Projects
279
Likewise, a 5% reduction in ONP reduced total revenue and IRR by 1%. All other variables
did not indicate a high level of sensitivity.
4.7 Conclusions
This case study demonstrated the process for municipalities to economically justify the
purchase and operation of a government owned MRF. Key findings from this research
revolve around a case study from the 2008 purchase of a government owned MRF in Ohio,
USA. The key findings were demonstrated through a complete financial analysis.
Specifically, the financial analysis indicated that the municipality would achieve a payback
period of approximately four years, and a ten year internal rate of return of 20.5%. The
consequences of these findings, stemming from the economic and operational justification,
led to the actual purchase of the MRF site and subsequent operation in 2008 through early
2011. This research may serve as an example or model for other local governments
considering the implementation of such a system.
A strong emphasis was placed on economic efficiencies and a sensitivity analysis of the
results to changes in the data inputs, specifically inflation, recycling levels, and recycling
commodity market shifts. A break even analysis of the data indicates that the amount of
materials collected by the District or the commodity prices could drop by 13% ($110,000)
from the estimate to achieve an IRR of 6.5%. On average, the amount of materials collected
by the District has increased by 3% to 5%, so this is not a large concern. The sensitivity
analysis indicated that OCC amounts and price are most sensitive to changes and therefore
have the largest impact on total revenue and IRR. A 5% reduction in the amount collected
annually or the dollar value per ton of OCC reduces total revenue by 2%. All other variables
did not indicate level a high level of sensitivity.
Reservations of limitations of this research include:
Location and the cost of business in various geographical areas
Inflation
Recycling commodity market shifts
Competition
This research and MRF analysis was conducted in the Midwest, which has a relatively lower
business and real estate costs versus the East or West Cost. Conducting a similar study in
these areas may not be economically justified based on these higher costs. Major changes in
inflation (labour and operating costs) or commodity market shifts may alter the economics
of the ten year cost structure. Finally, unforeseen competition arising in the area could
reduce material collection amounts, hence reducing revenues. This competition could
present itself as a new private sector recycling collector/processor or as modified fee
structures from existing companies. The likelihood of these events over the ten year time
frame is relatively low due to these companies current cost structures and taxation rates.
5. References
Beck, R.W. (2004). Lycoming County Material Recovery Facility Evaluation. Pennsylvania
Department of Environmental Protection. Final Report.
Chang, N. and Wang, S.F. (1995). The development of material recovery facilities in the
United States: status and cost structure analysis. Resources, Conservation and
Recycling. 13: 115 – 128;
280
Integrated Waste Management – Volume I
Davila, E. and Chang. N. (2005). Sustainable pattern analysis of a publicly owned material
recovery facility in a fast-growing urban setting under uncertainty. Journal of
Environmental Management. 75: 337 – 351;
Tompkins, White, Bozer, and Tanchoco. (2003). Facilities Planning. John Wiley and Sons,
Inc., Hoboken, NJ, USA.
US Environnemental Protection Agency. (2006). Full Cost Accounting for Municipal Solid
Waste Management.
15
Waste Management at the Construction Site
Joseph Laquatra and Mark Pierce
Cornell University
U.S.A.
1. Introduction
Construction and demolition (C&D) debris is produced during the construction,
rehabilitation, and demolition of buildings, roads, and other structures (Clark, Jambeck, and
Townsend; 2006). According to the U.S. Environmental Protection Agency (2003), C&D
debris amounts to 170 million tons per year, or 40 percent of the solid waste stream in the
U.S. While efforts to reduce this through reduction, recycling, reuse, or rebuying continue to
expand through government mandates, green building incentives, and education, much
work remains to be done. This chapter will begin with a history of C&D debris management
and will cover state and local government regulations that pertain to C&D debris. Impacts
on this matter from green building programs will be described. Issues that pertain to
landfills, including C&D landfills, will be evaluated, along with concerns that relate to
specific materials. The chapter will conclude with a discussion of lessons learned to date and
recommendations for improved progress.
2. Background
Waste generation by human societies is not new. “Since humans have inhabited the earth
they have generated, produced, manufactured, excreted, secreted, discarded, and otherwise
disposed of all manner of wastes” (Meliosi,1981, p.1). Working to devise methods for
dealing with their societies’ wastes has occupied humans since the beginning of civilization
and the creation of cities. The ancient city of Athens, Greece had a regulation that required
that waste be dumped at least a mile away from city limits; and ancient Rome had sanitation
crews in 200 AD (Trash Timeline, 1998).
What is new is the amount of waste produced by human societies, especially industrial
societies. Of course part of this is driven by the rise in human population. More people will
create more waste. But the amount of waste created has soared since the industrial
revolution and development of a culture and global economy driven by consumption.
The development of formal management strategies for the collection and disposal of solid
waste in the United Sates has occurred primarily within the last 110 to 120 years. Early
America had a relatively small population that was widely dispersed on the land and relied
primarily on an agrarian-based economy. Few waste materials were produced, and every
possible use was sought for materials before resorting to discarding anything.
As Susan Strasser notes in her book Waste and Want: A Social History of Trash (1999):
“most Americans produced little trash before the 20th century. Packaged goods were
becoming popular as the century began, but merchants continued to sell most food,
282
Integrated Waste Management – Volume I
hardware and cleaning products in bulk. Their customers practiced habits of reuse that had
prevailed in agricultural communities here and abroad. Women boiled food scraps into
soup or fed them to domestic animals; chickens, especially, would eat almost anything and
return the favor with eggs. Durable items were passed on to people of other classes or
generations, or stored in attics or basements for later use. Objects of no use to adults became
playthings for children. Broken or worn-out things could be brought back to their makers,
fixed by somebody handy, or taken to people who specialized in repairs. And items beyond
repair might be dismantled, their parts reused or sold to junk men who sold them to
manufacturers”(p.12).
While the method Strasser describes above may have worked in the sparsely populated
country side, it was not perfectly suited to cities. A brief review of references to the filth of
American cities of the mid 19th century made in the historical record illustrates this. For
example, in Washington D.C residents in 1860 discarded garbage and chamber pots into
streets and back alleys. Pigs roamed free and ate the filth, and slaughter houses emitted
putrid smells. Rats and cockroaches were common in most buildings in the city, including
the White House (Trash Timeline, 1998).
It was not until the late 19th century that a concerted effort started to appear in the nation’s
cities to clean up streets and devise some formal strategies for managing the increasing
amounts of waste. Prior to that period cities typically made due with an informal network of
small firms and legions of the poor who worked to collect wastes (McGowan, 1995). Citizens
seldom paid to have wastes hauled away, but instead placed them at curbsides where
individuals from this informal network would go through them and remove anything
considered to have residual value. Items deemed to have no value were often left in the
streets or tossed into alleys to rot. Milwaukee, Wisconsin provides a specific example:
“Until 1875, hogs and ‘swill children’- usually immigrant youngsters trying to supplement
the family income - collected whatever kitchen refuse Milwaukeeans produced. Obviously
unequal to the task of collecting the wastes of an entire city these ‘little garbage gatherers’
left the backyards and alleys reeking with filth, smelling to heaven” (Leavitt, 1980, p. 434).
While most cities of the 19th century had no formal means of collecting and managing solid
wastes, many had dumps. But they were basically open pits in the ground. Swamps were
also often used as dumping grounds. Melosi (1981) cites a description given by Reverend
Hugh Miller Thompson in 1879 that described a dump in New Orleans this way:
“Thither were brought the dead dogs and cats, the kitchen garbage and the like, and duly
dumped. This festering, rotten mess was picked over by rag pickers and wallowed over by
pigs, pigs and humans contesting for a living in it, and as the heaps increased, the odors
increased also, and the mass lay corrupting under a tropical sun, dispersing pestilential
fumes where the wind carried them” (p.545).
But as the industrial revolution in the United States progressed, and with the ensuing
development and soaring population growth in cities across the country, cities were forced
to seek more formal methods for managing wastes. In New York City in 1880 scavengers
removed 15,000 horse carcasses from the streets (Trash Timeline, 1998). It was not just horse
carcasses that created a problem on city streets. Engineers of that era estimated there were
26,000 horses in Brooklyn that produced 200 tons of manure and urine each day (Melosi,
1981). Most of that was deposited and left in the streets. In 1892, Milwaukee, Wisconsin
citizens were in an uproar because the city’s drinking water supply, drawn from Lake
Michigan, had become polluted by trash and waste being dumped into the lake (Leavitt,
1980).
Waste Management at the Construction Site
283
Driven by the waste problems illustrated by the above example, American cities began to set
up trash collection programs to deal with wastes generated by their citizens. In 1880 43% of
U.S. cities had a municipal program or paid private firms to collect trash. By 1900 this had
increased to 65% of cities (Melosi 1981). However, there were seldom regulations on how the
waste would be disposed. Many times private haulers removed any items with residual value
while collecting wastes and dumped everything else in the nearest vacant lot or body of water.
As waste generation rates continued to grow and citizens complained about filthy streets
and polluted water supplies, municipalities were forced to begin devising disposal methods
to end these problems. The spread of disease and resulting large death toll in urban areas
also spurred action. Medical thinking for much of the 19th century relied on the filth theory
of disease to explain the cause of epidemics. During this time period, “most physicians
believed that rotting organic wastes in crowded urban areas produced a miasmatic
atmosphere conducive to the spread of diseases such as cholera, yellow fever, diphtheria,
and typhoid fever” (Leavitt, 1980, p.461). This theory, even though incorrect, helped create a
health justification for garbage reform (Leavitt, 1980). This is also why one of the most
preferred methods of garbage and trash disposal at the turn of the century was incineration.
Burning garbage and trash would sanitize it before it was hauled to a dump (McGowan,
1995). Incineration also reduced the amount of material that needed to be dumped.
Between 1900 and 1918 a national movement arose to create municipal refuse departments
and bring “professional engineering and management know-how to the garbage business”
(McGowan, 1995, p.155). A man named George Warring is often cited as one of the first to
implement this idea in a major city. An engineer with a military background, he was
appointed Sanitary Commissioner in New York City in 1894. Warring had earned a national
reputation for his work in designing a modern sewage system in Memphis, Tennessee. He
had been sent to Memphis by the National Board of Health after a yellow fever and cholera
epidemic killed more than 10,000 people. When he came to New York he set about cleaning
up the city streets and designing and building facilities to handle the city’s collected garbage
and trash (Melosis, p.56).
Warring had a waste recovery facility built. It consisted of a conveyor belt where immigrant
laborers sorted through trash for any items of value as it passed by. The conveyor belt was
powered by steam created with heat from burning trash (McGowan citing Sicular, 1984).
Reduction and incineration were the preferred disposal solutions for much of the country at
the beginning of the 20th century. Even those municipalities that continued land dumping
saw that only as a temporary solution until they could afford to construct sorting facilities
and incinerators such as Warring had built in New York (Melosi, 1981).
As a method to assist sorting at recovery facilities, many cities required their citizens to sort
and separate trash before placing at the curb for collection. Spielman (2007) provides an
example of one municipality’s“card of instruction for householders.” Residents were
required to use three receptacles when putting waste materials out for collection. One was to
be used for ashes. However, sawdust, floor and street sweepings, broken glass and crockery,
tin cans, oyster and clam shells were also to be placed in the ash receptacle. The second
receptacle was to be used for garbage. This was defined to be kitchen or table waste,
vegetables, meats, fish, bones or fat. The third category was rubbish bundles. This included
bottles, paper, pasteboard, rags, mattresses, old clothes, old shoes, leather and leather scrap,
carpets, tobacco stems, straw, and excelsior.
Many of these advancements were abandoned with the reduction of public funding
resulting from the Great Depression. Cities were forced to reconsider how to collect wastes
284
Integrated Waste Management – Volume I
and continue the operation of sorting facilities and incinerators. Collecting separated wastes
and running sorting facilities were expensive operations. But incinerating mixed wastes
made that process much more costly. The moisture content of comingled waste made it less
efficient to burn (McGowan, 1995). Sanitary engineers conducted calculations to compare
the cost of burning trash with burying it. These calculations showed that the cost for
burning waste was two dollars per ton, while the cost of burying it just $0.29 per ton
(McGowan 1995, citing Thresher, 1939). It was not long before cities quickly abandoned
waste recovery and incinerator facilities and moved to the widespread practice of using
dumps. Ironically, New York City also led the way in abandoning the efforts of reformers
like Warring, and reinstituted the method of dumping trash on the land. William Carey, the
head of New York City Sanitary Department at that time, developed dumps throughout
New York’s five Boroughs (McGowan, 1995). Waste was no longer viewed as a source of
materials, but instead seen as “an expensive nuisance that could not be ignored” (McGowan,
1995, p. 160).
In 1931 Fresno, Jean Vincenze, the newly elected Public Works manager, immediately
canceled the city’s incineration contract and began what he called the sanitary fill
(McGowan, 1995). Vincenze’s “sanitary landfills” were nothing like current day, lined
sanitary landfills. Sanitary landfills of this era used a layering process. A layer of garbage 12
inches deep would be spread over the fill area and then covered with ashes or some sort of
non-putrescent rubbish. This layering process continued until the area was completely filled
(Melosi, 1981).
The cost for disposing the city’s trash dropped dramatically as Fresno’s public works
department perfected the work of collecting, transporting, and covering each day’s garbage.
This allowed the public works department to both expand the number of residents served
with trash collection services and reduce the costs for providing this service. As
McGowan(1995) notes, “the low cost and simplicity of landfill operation allowed officials of
waste management firms (public and private) to concentrate their efforts on cutting costs in
the labor intensive area of collection and transportation” (p.161).
2.1 C&D debris in U.S. history
A brief search of historical literature reveals little information on construction and
demolition debris or how it was handled in the 19th or early 20th century. This is not
surprising, since even in 1993 construction and demolition waste was seldom recorded
separately from municipal solid waste (Cosper et al., 1993).
Even though the country was developing at a rapid pace in the late 19th century and much
new construction was undersay, a significant amount of demolition likely resulted from this
development. In the October 10, 1937 issue of the New York Times, a story reported that “in
the year 1936 there were demolished in the City of New York more than 10,000 dwelling units
in old-law tenements and an equal number will have been demolished in 1937. “ (Post, 1937).
Construction and demolition debris in the United States would have consisted of relatively
few types of materials in the 19th and early 20th century. For example, in Philadelphia during
1950 dozens of 18th and 19th century buildings were demolished to create open space for
Independence National Historical Park. During archeological work done in the park in 2000,
much of the construction debris from these demolished buildings was uncovered. It was
composed of wood, stone, mortar, brick, plaster, and cement (Digging in the Archives,
2010). This archival post also notes that a portion of the demolition rubble was disposed of
by burying it on-site. Evidence is also cited that much of the building rubble was
Waste Management at the Construction Site
285
transported by rail to Lancaster County, Pennsylvania, where it was used to fill in a lake
(Digging in the Archives, 2010).
Dumping wastes into open dumps was the most common disposal method from the period
of the Great Depression until well into the 1970s. In 1972 an EPA Administrator estimated
that more than 14,000 municipalities across the country relied on open dumps for waste
disposal (Melosi, 1981). None of these municipalities implemented even the most basic
landfill technology and attempt to layer wastes or cover each day’s accumulation of trash
with fill. Many of these dumps were located in wetland areas, known more commonly
before the environmental movement as swamps. Abandoned gravel beds, ravines, and
gullies in the landscape were also commonly used. Dumps controlled by well-managed
municipalities would cover each day’s accumulation of dumped waste and garbage with
clean fill as a method to reduce odors and limit vermin’s access to food wastes. But most
dumps were merely piles of waste open to the environment. And even the best-managed
landfills had no linings to protect ground water or even surface water runoff from leachate.
This method of disposal continued to be the most widely used across the country until the
creation of the Environmental Protection Agency and its development of strict criteria for
the construction and maintenance of sanitary landfills.
The Resource Conservation and Recovery Act of 1976 (RCRA) forced the closure of open
dumps across the country and developed regulations that dictated minimum standards for
the construction and maintenance of sanitary landfills (Trash Timeline, 1998). Current day
sanitary landfills require a liner system of compacted clay or high density polyethylene. A
leachate collection system is also required to collect this liquid from the bottom of the
reservoir created by the liner. Methane gas collection wells are also required. Waste is
placed over the liner and leachate collection system and then covered at the end of each day
with six inches of soil or an alternative daily cover (NSWMA, 2008). In some cases, inert
types of construction and demolition materials are used as a daily cover material.
The closure of these dumps across the country and the expense of constructing engineered
sanitary landfills significantly increased disposal costs of municipal solid waste. The
increased cost of disposal began to make recycling of materials an economically viable
option. In fact, recovery of materials from the waste stream did grow. It went from very
small amounts to about 30% by 1995 (Spiegelman and Sheehan, 2005).
As a further method to reduce the demand for landfill space, some municipalities began to
limit, and in some cases ban, construction and demolition materials from their landfills as a
method to conserve landfill space. C&D materials typically do not contain putrescible
wastes that sanitary landfills are designed for. In addition, many materials in C&D waste
can be recovered and recycled. But even as late as 1996 only 20-30% of C&D debris was
recovered for reuse or recycling. The majority of the remaining material was land-filled (U.S.
EPA, 1998).
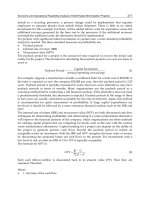
In 2003 the United States Environmental Protection Agency estimated that construction and
demolition debris totaled approximately 170 million tons (U.S. EPA, 2003). This amount is
broken down as follows:
Construction: 15 Million Tons (9% of the total). This refers to waste materials
generated during initial construction.
Renovations: 71million tons (42% of the total). This includes remodeling,
replacements, additions, includes wastes from adding new materials and removing old
materials.
Building Demolition: 84 million tons (49% of the total).
286
Integrated Waste Management – Volume I
Of these amounts, the following breakdown is made:
Residential construction: 6%
Non-residential construction: 3%
Residential renovation: 22%
Non-residential renovation: 19%
Residential demolition: 11%
Non-residential demolition: 39%
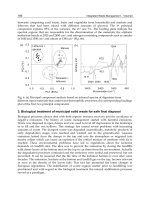
Figure 1 displays these figures graphically.
Fig. 1. C&D debris breakdown in the United States.
The EPA roughly estimates that 48% of C&D materials were recovered in 2003, which is 23%
higher than the recovery estimate of 1997 (U.S. EPA, 2003). The agency also estimated that
while much of the non-recovered C&D materials went to specifically designated C&D
landfills, a significant amount also went to municipal solid waste landfills or incinerators.
However, the amount of C&D waste co-mingled with municipal solid waste is not known
(U.S. EPA, 2003).
2.2 Conclusion
Sustainability means that a community or society can continue to do what it is doing
forever. But current rates of raw material inputs and energy consumption required to
construct, maintain, and then dispose of buildings in the United States is certainly not
sustainable for any extended period of time. And the widespread practice of simply burying
construction and demolition materials instead of using those materials to reduce the
amounts of raw materials extracted from the environment is a strategy that cannot be
sustained indefinitely. In a world with an expanding global economy and the increasing
Waste Management at the Construction Site
287
demand for material resources, we must end the linear process currently used for material
acquisition and use. We must find ways to imitate natural systems where there is no such
thing as waste material, so that materials are constantly recycled and serve as inputs to the
human economy or nourishment to the eco-system.
3. Federal regulations and C&D debris
While C&D debris is not explicitly regulated at the federal level in the U.S., the disposal of
solid and hazardous waste is covered by the Resource Conservation and Recovery Act
(RCRA) of 1976, which amended the Solid Waste Disposal Act of 1965. RCRA set national
goals for:
Protecting human health and the environment from the potential hazards of waste
disposal.
Conserving energy and natural resources.
Reducing the amount of waste generated.
Ensuring that wastes are managed in an environmentally-sound manner.
(U.S. EPA, 2010a)
Through the state authorization rulemaking process, the EPA has delegated RCRA
implementation responsibility to individual states. Since the enactment of RCRA, other
federal statutes have been passed that affect C&D debris, including the National Emission
Standards for Hazardous Air Pollutants (NESHAP), which apply to asbestos, and the
Comprehensive Environmental Response Compensation and Liability Act (CERCLA), also
known as the Superfund, which applies to any hazardous material in C&D debris. The Toxic
Substances Control Act specifically regulates the disposal of PCB ballasts in debris
generated from activities related to renovation and demolition.
The 1970 Clean Air Act Amendments established NESHAP, through which the EPA is
required to identify and list harmful air pollutants (EPA, 2010b). These standards require
that emissions from these pollutants be minimized to the maximum extent possible through
the Maximum Achievable Control Technology (MCAT). NESHAP specifies procedures for
removing and disposing of asbestos.
4. State regulations and C&D debris
From the perspective of states having the primary responsibility for C&D debris regulation,
Clark et al. (2006) provided an extensive review of individual state activities in this regard.
They found a high degree of variation among states in regulatory aspects of C&D debris. At
a most basic level, states vary in how they define this waste, which affects its management.
Some states separately define construction debris and demolition debris. Some include it in
other definitions of waste. For example, Maryland includes C&D debris in its definition of
processed debris. Mississippi includes C&D debris in its definitions of rubbish and industrial
processed debris. Other states include C&D debris in their definitions of dry waste or inert
waste.
For landfills that accept C&D debris, states also vary in their regulation. California requires
that such landfills be located in areas of low seismicity. Indiana specifies characteristics of
the soil lining in landfills adjacent to aquifers. Not all states require that landfills have soil
liners. Those that do specify a lining system of clay or other soil that meets specific
requirements. Some states require leachate collection systems and groundwater monitoring.
288
Integrated Waste Management – Volume I
Clark et al. (2006) effectively documented the wide variation among states in their regulations
concerning the disposal of C&D debris. They noted differences with respect to definitions,
specifically whether states defined C&D debris as one or two categories for regulatory
purposes, whether inert debris was categorized, and if other definitions applied to C&D
debris. They noted which states did and did not have landfill liner requirements and which
had specifications for leachate collection. Permitting issues they noted were those pertaining to
financial assurance and training for operators and landfill spotters. They also reported on state
regulations that are specific to C&D landfills and C&D recycling facilities, groundwater
monitoring requirements, and which states were updating regulations on C&D debris.
To determine if any state regulations had changed since the Clark et al. (2006) study, we
contacted appropriate personnel of the landfill-regulating agency in every state and asked if
any regulations had changed since that paper was published.
4.1 States that have not updated regulations
States that reported no changes to their C&D debris regulations since the Clark et al. (2006)
study are shown in Table 1.
State
Alabama
Alaska
Arizona
Arkansas
Colorado
Delaware
Florida
Georgia
Hawaii
Idaho
Iowa
Kentucky
Louisiana
Maine
Maryland
Notes
No changes, but the state has funded a research project to examine
the feasibility of more recycling.
No changes to regulations, but corrections should be made to Table 1
in the Clark et al. (2006) study: Hawaii does have a definition for
construction and demolition waste, but not for construction waste,
demolition waste, or inert debris. The state does have other
definitions. Hawaii does require spotters, as well as training for
spotters, under C&D landfill permits. The state does have regulations
covering C&D debris recycling facilities.
No changes have been made, but regulations are currently being
revised and will be presented to the state legislature in 2012.
No changes have been made, but the Governor’s office issued an
emergency declaration on August 30, 2005 to cover the disposal of 22
million tons of debris that resulted from Hurricane Katrina. 600,000
residential structures were affected; of these, 77% were completely
destroyed. Over 6,000 commercial structures were affected; of these,
67% were completely destroyed (State of Louisiana, 2005).
No changes have been made to regulations, but a correction should
Waste Management at the Construction Site
Massachusetts
Michigan
Mississippi
Missouri
Nevada
New Hampshire
New Jersey
New Mexico
New York
North Carolina
Ohio
Oregon
Pennsylvania
Rhode Island
South Dakota
Texas
Utah
Vermont
Washington
289
be made to the Clark et al. (2006) study to note that the state does
regulate C&D landfills and C&D recycling facilities. The study also
notes that the state requires a final cover over a landfill of two feet of
earth within 60 days and then a cap within two years, but not exactly
what the cap consists of: The cap is required to have a lowpermeability layer of plastic or clay, a drainage layer, a minimum
slope of 4%, and at least 18" of dirt and 6" of topsoil that is compacted
and vegetatively stabilized.
As of July 2011, clean gypsum wallboard will be added to asphalt
pavement, brick, concrete, metal, and wood on the list of materials
banned from disposal.
No changes have been made except generic exemptions for asphalt
shingles, new construction drywall, and scrap wood.
The discussion about capping systems should be revised to reflect
specifications in the New Hampshire Code of Administrative Rules,
Part 805.10.
New Mexico implemented new general solid waste rules in August
2007. Regarding C&D debris, however, no changes have been made.
Senate Bill 1492 passed in 2007. It has enhanced protections
applicable to sanitary landfills, which pertain to C&D debris, that are
not in the rules. In particular NEW C&D landfills, of which there are
none , and permitted after August 1, 2007, are required to have liners
and leachate collection systems. Of particular note is the buffer
requirements to parks, wildlife preserves and hunting lands.
New rules and programs are currently being adopted, but they are in
the early stages. Otherwise, no changes have been made.
Most of the information provided in Clark et al. (2006) is incorrect or
confusing. Washington amended its solid waste rules in 2003, well
before that paper was published. State personnel found that the
wrong agency had responded to the request for information (WA
Dept of Natural Resources) and the wrong regulation was referenced.
The current rule no longer includes definitions of demolition or
construction waste but has a definition for inert waste as well as
standards for inert waste landfills. This is covered in sections 100,
290
Integrated Waste Management – Volume I
410, and 990 of WAC 173-350, Solid Waste Handling Standards. Noninert construction and demolition waste destined for disposal must
be managed in either a limited purpose landfill authorized to accept
it (Section 400) or at a municipal solid waste (Subtitle D) landfill
permitted and operated in accordance with WAC 173-351, Criteria for
municipal solid waste landfills. These are the only three categories of
landfill facilities in the state.
West Virginia
Wisconsin
Wyoming
Table 1. States that have not changed regulations since publication of Clark et al. (2006).
4.2 States that have updated regulations
State
California
Indiana
Regulation
We were unable to find a state official who could give a clear
answer on whether regulations had changed. However, Clark et al.
(2006) cited a definition of inert waste from the California Integrated
Waste Management Board as:
“Subset of solid waste that does not contain hazardous waste or
soluble pollutants at concentrations in excess of applicable water
quality objectives, and does not contain significant quantities of
decomposable waste.”
Clark et al. (2006), p. 150.
We found that the California Integrated Waste Management Board
is now the Department of Resources Recycling and Recovery. This
definition is provided: “Inert debris means solid waste and
recyclable materials that are source separated or separated for reuse
and do not contain hazardous waste…or soluble pollutants at
concentrations in excess of applicable water quality.” Regulations:
Title 14, Natural Resources—Division 7, CIWMB. Chapter 3.
Minimum Standards for Solid Waste Handling and Disposal,
Section 17388. Definitions.
There has been one change to regulations that affect C&D debris
since 2005. On May 31, 2006, the state issued the ruling “General
Permit for Storage and Processing of Asphalt Roofing Shingle Waste
and/or for the Storage and Distribution of Ground Asphalt
Aggregate for Beneficial Use.” See link:
and Licenses/Waste General
Permits/Asphalt roofing shingles gp.pdf
New regulations effective in 2009. See link:
/>Pulverizing is now banned. Material must be recognizable.
Kansas
Kansas’ definition of C&D waste is written to prohibit disposal of
Connecticut
Illinois
Waste Management at the Construction Site
Minnesota
Montana
Nebraska
291
chemical containers in C&D landfills even if empty. This
requirement is why there is no groundwater monitoring. The
regulations are available online at the following link:
The
definition of C&D waste can be found in our state law at the same
website at K.S.A. 65-3402(u).
A new rulemaking is underway to address financial assurance and
siting requirements. This was initiated at the request of the
legislature. The scope of the rule has narrowed to potentially affect
only new facilities. The rule revisions were too unwieldy to deal
with as one rulemaking and have been split into two: one to address
financial assurance and the other to address siting requirements.
Current rulemaking can be viewed at this link:
/>This rulemaking reflects two legislative directives to to improve
siting rules to better protect groundwater and improve financial
assurance to assure that Minnesota taxpayers are protected, and
puts a moratorium on siting or expanding many landfills until such
rules are in place.
New rules for general waste management were issued in February,
2010. Minor changes to wording were included, but no major
regulatory changes were made.
Random inspections of incoming loads are required to exclude
regulated hazardous wastes or PCB wastes. Personnel must be
trained to recognize regulated hazardous wastes and PCB waste.
The effective date of Title 132 - Integrated Solid Waste Management
Regulations is December 28, 2009.
Agency personnel noted the following quotation from Clark et al.
(2006):
"Not only are some discrete components found in
buildings hazardous wastes, but the buildings themselves may be
hazardous wastes if painted or contaminated with toxic chemicals
(e.g., coated with lead-based paint)." Clark et al. (2006), p. 144.
The department's opinion on that topic is that under the hazardous
waste regulations (Title 128) waste determinations are based on the
waste "as generated." A demolition then would mean the waste "as
generated" is the entire structure. It is not possible for a
representative sample of the entire structure to fail a TCLP for
metals. The entire mass of the waste versus the small amount of
paint in relation to that waste effectively dilutes the results to well
below any toxicity characteristic regulatory limits. This is obviously
not intentional dilution so it is not affected by the LDR dilution
prohibition. There is the remote possibility that a building might
have been contaminated with a listed hazardous waste and, as such,
292
Integrated Waste Management – Volume I
North Dakota
Oklahoma
South Carolina
Tennessee
Virginia
the entire waste (the building debris) will be a listed hazardous
waste under the mixture rule (Title 128, Chapter 2, Section 005.02). It
would be possible to do a so-called contained-out determination of
the debris if it could be suitably demonstrated the waste contained
so little of the listed component that it presents no risk to human
health or the environment.
Changes include: Minimize erosion and optimize drainage of
precipitation falling on the landfill. The grade of slopes may not be
less than three percent, nor more than fifteen percent, unless the
applicant or permittee provides justification to show steeper slopes
are stable and will not result in long-term surface soil loss in excess
of two tons [1.82 metric tons] per acre per year. In no instance may
slopes exceed twenty-five percent. Refer to North Dakota Century
Code (NDCC), North Dakota Administrative Code (NDAC) Code
33-20-04.1-09 paragraph 4b3.
Changes became effective July 11, 2010 and included the
amendment of certain rules that directly affect C&D facilities. These
changes include the following:
1. OAC 252:515, Subchapter 15: The exemption for C&D landfills
was removed. This means that C&D landfills will be required to
implement methane gas monitoring and control which includes the
installation of gas probes, the submittal of an explosive gas
monitoring and analysis plan to DEQ, and procedures for corrective
action if explosive gas levels are exceeded.
2. OAC 252:515, Subchapter 29: The exception for C&D landfills was
removed. This means that C&D landfills are required to have a
waste exclusion plan (WEP).
The key dates for implementing these rule changes are as follows.
1. OAC 252:515, Subchapter 15:
a. An explosive gas monitoring and analysis plan (Plan), as required
in OAC 252:515-15-3(a), must be submitted to the DEQ for approval
no later than January 7, 2011.
b.The Plan must be implemented no later than 90 days after it is
approved by the DEQ.
2. OAC 252:515, Subchapter 29:
a. A WEP, as required by OAC 252:515-29-2(a), must be submitted
to the DEQ for approval no later than January 7, 2011.
New regulations went into effect in 05/2008. No major changes to
requirements but some terminology changes – see
/>_regulation.htm
Regulation Code: 61-107.19.
All landfills are now to have groundwater monitoring. Cover
frequency used to be less frequent, but is now once per week.
Virginia Solid Waste Management Regulation, 9VAC20, Chapter 81
to be posted to the Virginia Department of Environmental Quality
Waste Management at the Construction Site
293
website as of March 16, 2011.
Inert waste is no longer defined in the regulation, and the definition
of C&D landfill has changed:
"Construction/demolition/debris landfill" or "CDD landfill" means
a land burial facility engineered, constructed and operated to
contain and isolate construction waste, demolition waste, debris
waste, split tires, and white goods, or combinations of the above
solid wastes.
Leachate control and monitoring are required. Gas management is
required unless the operator can demonstrate that gas formation is
not a concern.
Table 2. States that have changed regulations since publication of Clark et al. (2006).
Tables 1 and 2 demonstrate the difficulties associated with presenting a clear picture of the
issue of C&D debris management across the United States. Some states have detailed
definitions and management policies for C&D debris and the facilities that handle it.
Specifications for landfill liners and covers vary, as do requirements for leachate
management. Problematic issues related to gypsum wallboard waste are highlighted by the
ban on disposal of this waste by Massachusetts. And as can be seen in the case of
Washington, despite their meticulous research approach, Clark et al. (2006) were misled by a
staff person in a state agency who thought his agency had regulatory authority over C&D
debris when it did not.
Among other issues, the management of C&D debris has implications for water and air
quality. A state with minimal oversight of such debris can affect the quality of air and water
in adjacent states. Policy implications of this situation may include regional cooperation
among states in their management of C&D debris, at a minimum. In addition, policies need
to be communicated clearly so that those involved in construction, demolition, and related
industries can remain in compliance in ways that do not have negative impacts on housing
affordability and other issues.
5. Local municipal programs
Many local governments have instituted programs and issued regulations as a method to
reduce the amount of C&D waste flowing to local landfills. Three examples of specific local
programs are described below.
The city of Portland Oregon provides an example of a local municipality that has set
regulations that require the general contractor of all building projects costing over $50,000 to
make certain that 75% of the waste produced on the job-site be recycled. The general
contractor is responsible for setting up a recycling program, including containers or storage
areas separate from garbage for materials being recycled. The general contractor must
complete a pre-construction recycling plan that details precisely how/where the following
materials will be recycled:
Rubble (concrete and asphalt)
Land clearing debris
Corrugated cardboard
Metals
Wood (City of Portland, Oregon, 2011).
294
Integrated Waste Management – Volume I
The City of Austin, Texas provides an example of a municipality that uses a green building
program to provide incentives to reduce construction wastes. The program sets minimum
recycling and/or reuse levels of construction waste if buildings are to qualify for the Austin
Energy Green Building designation. Waste reduction and recycling requirements set forth in
program are designed to assist the city in meeting a waste reduction goal that calls for a 90%
reduction in materials sent to landfill by 2040 (Austin Energy, 2010).
As part of the requirements that builders and developers must meet to obtain the Austin
Energy Green Building designation, they must set aside space on the construction site for
sorting and temporary storage of reusable/recyclable materials. Builders are allowed to reuse
many of the waste materials on-site. For example, waste wood and cleared brush can be
chipped and used for on-site landscaping purposes. Gypsum drywall scraps can be ground on
site and used as a soil amendment. Concrete can be crushed and used as fill or drainage under
garden beds or driveway areas. The program requires that a minimum of 50% of the waste
generated by the construction project must be recycled or reused (Austin Energy, 2010).
The city of Seattle has also set very ambitious targets for reducing waste materials. The city
has set a goal to reach a 70% recycling target by 2025. As a method to reduce construction
waste, the city provides educational materials to contractors and developers on methods to
reduce construction waste. They have an on-line checklist that describes basic steps in
setting up a job-site reuse and recycling strategy. In addition, the following on-line resources
are also provided: (1) A searchable data base for recycling construction and demolition
waste, and (2) A recycling directory to identify what materials are easiest to recycle in the
region (City of Seattle, n.d.).
6. Green building programs and C&D debris
Besides regulation, incentives exist for managing C&D debris in ways other than disposal in
landfills. A number of green building programs are now in effect at the national, state, and
local levels throughout the U.S. The most well-known of these is Leadership in Energy and
Environmental Design (LEED), which is administered by the U.S. Green Building Council
(USGBC). LEED is a program through which buildings are certified as meeting
sustainability standards. LEED focuses on specific areas environmental health, including
resource efficiency. Points are awarded to a development project for minimizing the amount
of C&D debris that is sent to landfills. LEED is applicable to all buildings, including homes.
Since 2004 Enterprise Community Partners has administered the only national program to
develop green homes for low‐income families. The Green Communities Criteria established
under this initiative relate to design, neighborhood fabric, resource efficiency,
environmental health, and maintenance. This program features green characteristics that are
found in many LEED buildings, but differs in its focus on serving low‐income families. This
effort also has a focus on minimization of C&D debris that is sent to landfills.
With input from several thousand stakeholders, the National Association of Home Builders
(NAHB), the International Code Council (ICC), and the NAHB Research Center developed
ICC‐700, the National Green Building Standard. It was approved in 2009 as an American
National Standard, and is the only green standard that is consistent with ICC’s I‐Codes.
Green features covered by this standard are similar to those in use by LEED and Enterprise.
ICC Codes are used as the basis of building codes in use across the United States.
The EPA Indoor airPlus program of the U.S. Environmental Protection Agency is an
enhancement to the ENERGY STAR Home program. ENERGY STAR homes are certified to
Waste Management at the Construction Site
295
perform to a level of energy efficiency that is typically 20 – 30 percent higher than
conventional homes. To be certified as an Indoor airPlus home, over 30 additional
construction features are added to the home, including resource efficiency.
An implication of more widespread adoption of green building programs would be an
increased awareness of the amount of construction debris that can be diverted from
landfills. And as green buildings are planned in advance for deconstruction, less demolition
debris will be produced.
7. The issue of gypsum
One issue that has posed challenges to C&D recycling is that of gypsum wallboard waste.
This wallboard is comprised of gypsum with paper facing and backing. Gypsum is calcium
sulfate dihydrate, a mineral that is mined from dried sea beds. It is the most common
interior wall finish material used in new construction and remodeling in the United States
(CalRecycle, 2007).
Gypsum board, also widely known as drywall or mistakenly as the brand name of a U.S.
Gypsum Corporation product, Sheetrock®, generally makes up the largest single component
in the C&D construction waste stream. A Cornell University study found that, on average,
some 1,700 pounds of gypsum waste is produced per home constructed, amounting to
approximately one pound per square foot of house area (Laquatra and Pierce, 2004).
The usual method of finishing drywall, the use of tape and joint compound to cover joints
and screw depressions, is most efficiently done when the largest possible pieces of drywall
are used to reduce the number of joints. This in turn requires cutting openings for
doorways, windows, heating/air conditioning vents, electric receptacle and switch boxes,
and junction boxes for light fixtures (as opposed to piecing multiple drywall sheets together
to form openings). This produces the bulk of construction drywall waste.
Management of drywall waste may involve either disposal or recycling. Frequently, drywall
waste is disposed of by simply dumping it in landfills. The chemical composition of the
gypsum used in drywall, however, presents at least one important obstacle to disposing of
such waste in this manner.
Many landfills in the United States now recover and use the methane gas produced by
decomposition of buried organic waste. Sulfate-reducing bacteria, which thrive in the
anaerobic conditions of landfills, produce hydrogen sulfide gas as they break down the
sulfites in gypsum. Hydrogen sulfide gas has a foul odor and can make people sick. It is
lethal in high concentrations. In addition, the presence of this hydrogen sulfide in methane
recovered from landfills reduces the quality of the methane gas. Although technology is
available to lessen the amount of hydrogen sulfide in recovered methane, the added expense
of doing so prevents many landfills from accepting drywall waste.
One suggested method of drywall disposal is to cut scraps into small pieces and then place
them in the uninsulated cavities of interior partitions (Yost, 1997). This technique has yet to
be widely used, in part because of the additional labor required.
As an alternative to simply disposing of drywall waste, recycling technology has advanced
to the stage where builders are now able to separate gypsum from other waste materials
onsite to be picked up by drywall recyclers at costs comparable to those of landfill disposal.
Recycled gypsum from residential construction waste is used in the manufacturing of new
drywall, the making of cement, as filler in stucco, as a precipitant to remove solids from
turbid water, and as an absorbent to dewater the resulting sludge, in the treatment of waste