Integrated Waste Management Volume I Part 14 ppt
Bạn đang xem bản rút gọn của tài liệu. Xem và tải ngay bản đầy đủ của tài liệu tại đây (3.24 MB, 35 trang )
Integrated Waste Management – Volume I
446
collection a management system based on recovery and recycling but without incineration
would be preferable (De Feo and Malvano, 2009).
In summary, the following outcomes were obtained with the WISARD procedure (De Feo
and Malvano, 2009):
Scenario number 21 (80% separate collection, no RDF incineration, dry residue sorting)
was the most environmentally sound option for the following six impact categories:
renewable energy use, total energy use, water, suspended solids and oxydable matters
index, eutrophication, and hazardous waste;
Scenario number 10 (80% separate collection, RDF production and incineration) was the
most environmentally sound option for the following three impact categories: non-
renewable energy use, greenhouse gases, and acidification;
Scenario number 1 (35% separate collection, RDF production and incineration) was the
most environmentally sound option for the following two impact categories: mineral
and quarried matters, and non-hazardous waste;
For the following eight impact categories (of the eleven considered), all the MSW
management scenarios considered produced negative impacts, and the highest
percentage of separate collection corresponded to the highest avoided impact:
Renewable Energy Use, Non-Renewable Energy Use, Total Energy Use, Water,
Suspended Solids and Oxydable Matters Index, Acidification, Eutrophication, and
Hazardous Waste;
For ‘‘Mineral and Quarried Matters” the MSW management scenarios considered
produced positive and negative impacts, and the highest percentage of separate
collection corresponded to the highest produced impact;
For ‘‘Greenhouse Gases”, the MSW management scenarios considered produced
positive and negative impacts, and the highest percentage of separate collection
corresponded to the highest avoided impact;
For ‘‘Non-Hazardous Waste” all the MSW management scenarios considered produced
positive impacts, and the highest percentage of separate collection corresponded to the
highest produced impact;
For the following six impact categories (of the eleven considered), for high percentages
of separate collection (80%), a management system based on recovery and recycling but
without incineration would be preferable: Renewable Energy Use, Total Energy Use,
Water, Suspended Solids and Oxydable Matters Index, Eutrophication and Hazardous
Waste;
‘‘Paper Collection Recycling” was the system component with the greatest avoided
impact for 45.5% of the cases considered;
‘‘Dry Residue Collection Logistic” was the system component with the greatest
produced for 54.5% of the cases considered.
3.1 Results obtained with SimaPro
The results obtained with the SimaPro procedure were evaluated by means of three keys.
The first key evaluates the results of the Inventory Analysis consisting of the data on the
emissions of pollutants into the environment due to the different phases of the MSW
management system, focusing on the treatment activities of the several MSW components.
Thus, it was possible to compare in quantitative environmental terms, the impacts generated
Comparison of the Suitability
of Two LCA Procedures in Selecting the Best MSW Management System
447
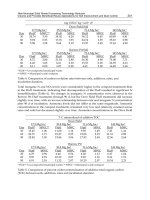
Table 10. Summary of the numerical results obtained with WISARD for MSW management
scenarios 1-10 developed in terms of avoided or produced impact (De Feo and Malvano,
2009)
Table 11. Management phase with the greatest avoided impact for each impact category and
for MSW management scenarios 1-10 developed in the study performed with WISARD.
DRCL = dry residue collection logistics; DRCD = dry residue collection disposal; DRCR =
dry residue collection recycling; PaCR = paper collection recycling; Pl&MCR = plastics and
metals collection recycling; GCR = glass collection recycling; PCC = putrescibles collection
composting; PCD = putrescibles collection disposal (De Feo and Malvano, 2009)
Integrated Waste Management – Volume I
448
Table 12. Management phase with the greatest produced impact for each impact category
and for MSW management scenarios 1-10 developed in the study performed with WISARD.
DRCD = dry residue collection disposal; DRCL = dry residue collection logistics; DRCI =
dry residue collection RDF incineration; DRCR = dry residue collection recycling; GCL =
glass collection logistics; PaCR = paper collection recycling; Pl&MCR = plastics and metals
collection recycling; PCC = putrescibles collection composting; PCD = putrescibles collection
disposal (De Feo and Malvano, 2009)
by the production units of materials from raw materials and impacts resulting from
treatment processes that lead to the production of secondary materials deriving from the
separate collection.
The second interpretation key directly derives from the evaluation model adopted, which
allows for the definition of the damage level induced by the MSW management system with
reference to the following macro-categories: Human Health, Ecosystem Quality and
Resource Consumption. Thus, it was possible to compare different scenarios and express
judgments about the influence of the percentage of separate collection on the impacts
produced. In particular, the damage category “Human Health” includes the following
damage/impact sub-categories: Carcinogens, Respiration Organics, Respiration Inorganics,
Climate Change, Radiation, Ozone Layer. While, “Ecosystem Quality” is the combination of
data related to the following damage/impact sub-categories: Ecotoxicity,
Acidification/Eutrophication, Land Use. Finally, “Resources consumption” comprises the
sub-categories Minerals and Fossil Fuels.
The third and final key relates to the identification of the management phases having a
significant impact on the overall impact as well as how these results vary with the scenarios
considered.
Comparison of the Suitability
of Two LCA Procedures in Selecting the Best MSW Management System
449
3.1.1 Results of the inventory analysis
The analysis of the emission data related to the packaging materials highlighted that, in
most cases, the pollutant emissions from secondary production were lower than that for
primary production for each impact category. Tables 13, 14 and 15 show the results obtained
for the packaging materials of glass, aluminium and paper, respectively.
Emissions Primary Production Secondary Production
CO
2
955 g 880.9 g
CO 1.42 g 0.825 g
NO
X
1.43 g 3.24 g
SO
X
5.07 g 4.85 g
BOD
5
0.584 mg 1.74 g
COD 0.011.9 g 2.18 g
Tot. Nitrogen 11.5 mg 10.1 mg
Sand 562 g 1.99 mg
Table 13. Comparison between the emissions due to the primary production of glass and
recycling of the same quantity of glass (secondary production)
Emissions Primary Production Secondary Production
Dust (< 2.5 µm) 4.97 g 269 mg
Dust (> 10 µm) 12.3 g 622 mg
Dust (> 2.5 µm <10 µm) 7.43 g 232 mg
NOx 19.8 g 2.58 g
Cadmium 628 µm 243 µm
BOD
5
20.7 g 1.86 g
COD 33.4 g 4.07 g
PAH 424 µm 23.4 µm
Chrome VI 18.9 mg 4.36 mg
Table 14. Comparison between the emissions due to the primary production of aluminium
and recycling of the same quantity of aluminium (secondary production)
Emissions Primary Production Secondary Production
Water 16.8 m
3
590 l
Wood 1.2 mm
3
2.45 mm
3
CO
2
856 g 809.6 g
CO 586.4 mg 593.6 mg
Chrome VI 11 µm 15.9 µm
BOD
5
1.38 g 647 mg
Chlorine 3.96 g 3.73 g
COD 5.05 g 1.94 g
Mercury 11.5 µm 5.04 µm
Suspended Solid 1.35 g 308 mg
Table 15. Comparison between the emissions due to the primary production of paper and
recycling of the same quantity of paper (secondary production)
Integrated Waste Management – Volume I
450
The presentation of the results of the Impact Assessment in terms of Environmental Damage
makes it possible to analyze the problem of potential impacts in general terms. While, it is
subsequently possible to extrapolate more peculiar considerations (PRè Consultants, 2000).
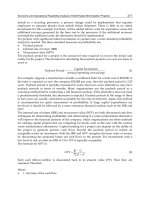
Figures 4, 5 and 6 show the differences between the impact of secondary and primary
production of glass, aluminium, paper and compost, for the damage categories Human
Health, Ecosystem Quality and Resource Consumption, respectively. A positive value of the
difference indicates an induced impact. Thus, for glass and paper the recycling process
induce impacts both in terms of Human Health and Resource Consumption.
-1.60E-05
-1.40E-05
-1.20E-05
-1.00E-05
-8.00E-06
-6.00E-06
-4.00E-06
-2.00E-06
0.00E+00
2.00E-06
Glass Aluminium Paper Compost
DALY
Human Health
Fig. 4. Difference between impact due to primary production and secondary production of
packaging materials and compost in terms of “Human Health” damage category (the
disability-adjusted life year, DALY, is a measure of overall disease burden, expressed as the
number of years lost due to ill-health, disability or early death)
In general, identical to the results obtained with WISARD, with reference to all the
management scenarios considered it was highlighted that the environmental impact linearly
decreases with the percentage of separate collection for each damage category. Only the
subcategory “Acidification/Eutrophication” of the damage macro-category “Ecosystem
Quality” showed an induced impact increasing with the percentage of separate collection
(Table 16). Moreover, the MSW management system determines avoided impacts for the
damage categories “Human Health” and “Resources Consumption”, while it determines
induced impacts for the damage category “Ecosystem Quality”.
Taking into account the contribution of the different MSW management phases, it was noted
that all the considered scenarios have negative impact indicators in terms of Human Health
and Resource Consumption, thus indirectly indicating that in these cases an integrated
management of MSW is more environmentally sound than traditional methods of
production of materials and energy. Dry residue incineration, landfill disposal, composting
and glass production were the MSW management phases with the greatest influence on the
final results in terms of environmental impacts.
Comparison of the Suitability
of Two LCA Procedures in Selecting the Best MSW Management System
451
-0.45
-0.4
-0.35
-0.3
-0.25
-0.2
-0.15
-0.1
-0.05
0
Glass Aluminium Paper Compost
PDF m
2
year
Ecosystem Quality
Fig. 5. Difference between impact due to primary production and secondary production of
packaging materials and compost in terms of “Ecosystem Quality” (the Potentially
Disappeared Fraction, PDF, is the fraction of species that has a high probability of no
occurrence in a region due to unfavorable conditions)
-14
-12
-10
-8
-6
-4
-2
0
2
Glass Aluminium Paper Compost
MJ surplus
Resource Consumption
Fig. 6. Difference between impact due to primary production and secondary production of
packaging materials and compost in terms of “Resource Consumption” damage category
(MJ surplus expresses the surplus of Mega Joule needed in the extraction of resources when
the demand for these will be 5 times higher than it was in 1990)
Integrated Waste Management – Volume I
452
Due to the simplified basic hypothesis of the adopted model, the modality of plastics
management was not considered when assessing the produced effects. Moreover, the
modality of paper management did not compare with the quantitative analysis of results,
with the analysis of single emissions highlighting that the balance between primary and
secondary production is essentially neutral. Finally, the implemented model was not
sufficiently adequate for the collecting and transporting phase, which would require the
implementation of another calculation model.
Table 16. Summary of the numerical results obtained with SimaPro for MSW management
scenarios 1-10 developed in terms of avoided or produced impact. (-) = avoided impact, (+)
= induced impact. Decreasing = the avoided or induced impact decreases with the
increasing of separate collection percentage; Increasing = the avoided or induced impact
increases with the increasing of separate collection percentage.
Table 17. Management phase with the greatest produced impact for each impact category
and for MSW management scenarios 1-10 developed in the study performed with SimaPro
Comparison of the Suitability
of Two LCA Procedures in Selecting the Best MSW Management System
453
Table 18. Management phase with the greatest avoided impact for each impact category and
for MSW management scenarios 1-10 developed in the study performed with SimaPro
Table 17 indicates the management phase with the greatest produced impact for each impact
category as well as for MSW management scenarios 1-10 developed in the study performed
with SimaPro. “Glass (green)” resulted the heaviest phase 33 times out of 110 (10 scenarios x
11 impact categories), corresponding to 27.3%. While, “Incineration” and “Titanium dioxide
production” were the heaviest phase 20 times (18.2%) and 18 times (16.4%), respectively.
Table 18 indicates the management phase with the greatest avoided impact for each impact
category as well as for MSW management scenarios 1-10 developed in the study performed
with SimaPro. “Glass (white)” resulted the lightest phase 53 times out of 110, corresponding
to 48.2%. While, “Electricity consumption” was the heaviest phase 21 times (19.1%). Finally,
“Radioactive emissions”, “Softwood”, “Bauxite consumption” were the lightest phase 10
times each one (9.1%).
More detailed results in terms of impacts due to the several phases of the MSW
management system are presented in the next paragraphs in relation to the most significant
impact categories.
3.1.2 Climate change
The impact produced by dry residue incineration decreased linearly with the increasing of
the percentage of separate collection in terms of Climatic Change. A similar result was
obtained by Bruno et al. (2002), also indicating that the solution with incineration was more
environmentally sound than the solution with direct landfill disposal in terms of
Acidification and Global Warming. Eriksson et al. (2005) identified in the incineration the
management phase with the maximum production of CO
2
, while waste landfilling was
indicated as the worst option. The composting process of putrescibles was the management
phase which affected the most the production of induced impacts. The impact increases
linearly with the increasing of the percentage of separate collection. Arena et al. (2003)
pointed out that the worst solution was the direct landfill disposal in terms of Climate
Change, due to the emission of greenhouse gases, accordingly to the findings of Ozeler et al.
(2006). For the scenario with 70% of separate collection, the impact induced by the
composting process recycling overcame the impact induced by the dry residue incineration,
in terms of Climate Change damage category (Figure 7). A similar solution was found by
Bruno et al., (2002).
Integrated Waste Management – Volume I
454
0.0E+00
2.0E-05
4.0E-05
6.0E-05
8.0E-05
1.0E-04
1.2E-04
1.4E-04
1.6E-04
35 40 45 50 55 60 65 70 75 80
DALY
Percentage of separate collection [%]
Putrescible Composting Dry Residue Incineration
y = 8E-07 x + 1E-05
y = -2E-06 x + 0.0002
Fig. 7. Trend of the induced impacts by Putrescibles Composting and Dry Residue
Incineration in terms of “Climate Change”
3.1.3 Acidification/Eutrophication
The MSW management phase of putrescibles composting has an induced impact on the
category Acidification/Eutrophication as well as contributes to the negative results of the
damage macro-category Ecosystem Quality. A similar result was obtained by Eriksson et al.
(2004) considering the installation of an anaerobic digestion plant. While, different results
were obtained by Salhofer et al. (2007), who found lower impact in terms of the
Eutrophication of mechanical biological treatment rather than incineration. The avoided
impact is due to the energy recovery with the subsequent saving of fossil fuels. This amount
decreases with the increasing of the percentage of separate collection up to 60%, while for
greater percentages the maximum benefit is given by the glass production. The results are
shown in Figures 8 and 9.
3.1.4 Carcinogens
In scenarios with the incineration of dry residue (1-10), the avoided impact increases with
the percentage of separate collection due to the progressive reduction of the contribution of
the incineration process. The main contribution in positive terms was given by the energy
saving deriving from non-renewable sources.
In relation to scenario 20 (80% separate collection, mechanical sorting of dry residue), the
direct landfill disposal of dry residue (scenario 21) produced an increase of about one order
of magnitude in terms of the sub-category Carcinogens, thus determining a negative result
in terms of the damage category Human Health. Similarly, the landfilling of inert materials
and ashes of the combustion process (scenario 20) resulted in a negligible impact than that
due to the direct landfilling of dry residue in scenario 21. Similar results were obtained by
Bruno et al. (2002) who showed a significant impact of landfilling due to the release of heavy
metals downstream leachate treatment.
Figures 10 and 11 show the trend of induced impacts in terms of the damage category
“Carcinogens” by incineration and inert waste landfilling disposal, respectively.
Comparison of the Suitability
of Two LCA Procedures in Selecting the Best MSW Management System
455
y = 0.0787 x + 1.3896
0
1
2
3
4
5
6
7
8
9
35 40 45 50 55 60 65 70 75 80
PDF m
2
year
Percentage of separate collection [%]
Putrescibles Composting
Fig. 8. Trend of induced impacts by the putrescibles composting in terms of damage
category “Acidification/Eutrophication”
y = 0.1034 x - 10.727
-8
-7
-6
-5
-4
-3
-2
-1
35 40 45 50 55 60 65 70 75 80
PDF m
2
year
Percentage of separate collection [%]
Electricity from Fossil Fuels
Fig. 9. Trend of induced impacts by the fossil fuels consumption in terms of damage
category “Acidification/Eutrophication”
3.2 Comparison of the results obtained with WISARD and SimaPro
One of the aims of this study was to compare the results obtained with the application of
two LCA procedures, WISARD and SimaPro, the first specific to the waste sector, while the
second of a general nature. In particular, applicability and reliability of the single procedure
to assess the life cycle of MSW management systems was evaluated.
It can therefore be deduced from the presentation of the results in the previous paragraphs
that the comparison between the two procedures can be performed only in qualitative rather
than quantitative terms because the mathematical models used for the analysis development
as well as representation of the obtained data are completely different.
Integrated Waste Management – Volume I
456
0.0E+00
2.0E-05
4.0E-05
6.0E-05
8.0E-05
1.0E-04
1.2E-04
1.4E-04
1.6E-04
35 40 45 50 55 60 65 70 75 80
DALY
Percentage of separate collection [%]
Dry Residue Incineration Dry Residue Direct Landfill Disposal
y = -5 10
-7
x + 5 10
-5
Fig. 10. Trend of induced impacts by incineration in terms of damage category
“Carcinogens”
-2.0E-05
0.0E+00
2.0E-05
4.0E-05
6.0E-05
8.0E-05
1.0E-04
1.2E-04
1.4E-04
1.6E-04
35 40 45 50 55 60 65 70 75 80
DALY
Percentage of separate collection [%]
Inert Waste Landfill Disposal Discards Landfill Disposal
y = -2 10
-8
x - 3 10
-7
Fig. 11. Trend of induced impacts by inert waste landfill disposal in terms of damage
category “Carcinogens”
Since the procedure WISARD is applied only to MSW management systems, with this
procedure the results are presented only in terms of equivalent inhabitants. On the contrary,
the SimaPro procedure, being of a general nature, can be adopted for the application of Life
Cycle Assessment to all products, processes and activities. SimaPro, compared to WISARD,
allows for a simpler and direct interpretation of the results, even by non-technical users.
This is achieved with the presentation of the results in terms of the damage macro-
categories Human Health, Ecosystem Quality and Resource Consumption.
Comparison of the Suitability
of Two LCA Procedures in Selecting the Best MSW Management System
457
The comparison between the results obtained with the two LCA procedures show the
following similarities:
all the considered scenarios showed negative overall impact indicators, indicating that
the MSW management was environmentally sound compared with traditional methods
of production of matter and energy. In particular, this behaviour was more evident the
higher the percentage of waste collection;
environmental emissions due to secondary production processes were lower than the
corresponding emissions due to the primary production of packaging materials, with
the presented exception;
for a fixed percentage of separate collection, the solution with mechanical-biological
selection of dry residue showed a reduction of the environmental benefit depending on
the impact category take into account;
for the percentages of separate collection greater than 60%, the solution with
mechanical-biological selection of dry residue waste can be considered environmentally
equivalent to the solution with the incineration and landfilling of ashes.
Table 19 shows the comparison between the MSW management phases with major and
minor impacts for the WISARD and SimaPro procedures for the common Impact Category.
Obviously, the MSW management phase with the greatest avoided impact indicates an
environmental benefit, while the MSW management phase with the greatest produced
impact indicates any environmental damage.
The qualitative comparison shows the perfect coincidence between the overall performances
in terms of positive/negative values. While, the two LCA procedures showed a different
behaviour in terms of the identification of the MSW management phase which affected the
most the final result in terms of positive or negative impacts. The different behaviour is due
to the different assumptions and simplifications made during the construction of the system
and, particularly, in the implementation phase of the process units of the treatment and
disposal plants.
As shown in table 9, focusing only on the common impact categories, Plastics and Metals
Recycling and Glass Recycling was the MSW phase with the greatest avoided impacts for
WISARD and SimaPro, respectively.
As shown in table 19, the collection and transporting to the treatment plants has a significant
importance in the WISARD procedure, resulting as the phase with the greatest incidence on
the production of induced impacts. The same results were not achieved for the SimaPro
procedure because its general nature determined a major approximation in the construction
of the basic calculation model.
3.3 Comparison with SimaPro between scenarios with dry residue incineration or
sorting
The main aim of this paragraph is to compare the induced or avoided impacts due to
scenarios with dry residue incineration (1-10) and scenarios with dry residue sorting (11-20),
using SimaPro as an LCA tool. Firstly, it focused on the numerical results obtained with
SimaPro for MSW management scenarios 11-20 developed in terms of avoided or produced
impact. As shown in table 20, only for the damage category Acidification/Eutrophication do
the impact values increase with the separate collection percentage, thus indicating an
environmental negative effect due to the separate collection. On the contrary, for ten out of
the eleven impacts considered with SimaPro, the calculated value decreased with the
percentage of separate collection, thus confirming the environmental convenience to push
Integrated Waste Management – Volume I
458
Table 19. Comparison between the MSW management phases with major and minor
impacts for the WISARD and SimaPro procedures for the common Impact Category
up toward the maximization of separate collection. Moreover, for seven impact categories
(see Table 20 for more details), the impact values were positive therefore indicating that they
were avoided impacts (the integrated MSW management was environmentally sound in
terms of these damage categories). While, the damage category “Land Use” showed both
positive (for low levels of separate collection) and negative values (for high levels of
separate collection). Finally, the impact values for the three damage categories Carcinogens,
Ecotoxicity and Acidification/Eutrophication were only positive thus indicating that they
were induced impacts (the integrated MSW management was not environmentally sound in
terms of these damage categories). Table 20 gives the equation of the line giving the values
of avoided or induced impacts by MSW management scenarios for each damage category.
While, Tables 21 and 22 indicate the management phase with the greatest produced and
induced impact for each impact category as well as for MSW management scenarios 11-20
developed in the study performed with SimaPro, respectively.
Table 21 shows the management phases with the greatest produced impact for each impact
category as well as for MSW management scenarios 11-20 developed in the study performed
with SimaPro. “Glass (Green)” resulted the heaviest phase 33 times out of 110,
corresponding to 30%. While, “Landfill Disposal” was the heaviest phase 17 times,
corresponding to 15.5%. Finally, “Wastewater treatment”, “Glass Recycling”, “Electricity
consumption (nuclear)”, “Natural fertilizers” and “Titanium dioxide production” were
heaviest at the same manner: 10 times, corresponding to 9.1%.
Table 22 shows the management phases with the greatest avoided impact for each impact
category as well as for MSW management scenarios 11-20 developed in the study performed
with SimaPro. “Glass (White)” resulted the lightest phase 70 times out of 110 (10 scenarios x
11 impact categories), corresponding to 63.7%. While, “Leachate disposal”, “Radioactive
emissions”, “Softwood” and “Bauxite consumption” were lightest at the same manner: 10
times, corresponding to 9.1%.
From this point forward, the aim of the paragraph is to compare scenarios 1-10 with
scenarios 11-20 in order to qualitatively evaluate the environmental role of the incineration
in the considered model of MSW management system. First of all, the difference between
the values of Tables 20 (dry residue sorting scenarios) and 16 (dry residue incineration
scenarios) were calculated in order to evaluate which scenarios are more environmentally
sound in terms of the considered damage categories. The obtained results are condensed in
figures 14 and 15. Essentially, for 10 out of the 11 impact categories (all excluding
Comparison of the Suitability
of Two LCA Procedures in Selecting the Best MSW Management System
459
Table 20. Summary of the numerical results obtained with SimaPro for MSW management
scenarios 11-20 developed in terms of avoided or produced impact. (-) = avoided impact, (+)
= induced impact. Decreasing = the avoided or induced impact decreases with the
increasing of separate collection percentage; Increasing = the avoided or induced impact
increases with the increasing of separate collection percentage
Table 21. Management phase with the greatest produced impact for each impact category
and for MSW management scenarios 11-20 developed in the study performed with SimaPro
“Minerals”), the difference was positive therefore indicating that sorting scenarios were
heavier than the corresponding incineration scenarios. In particular, Figure 14 shows the
trend of the difference between the Sorting scenario impact and Incineration scenario impact
normalized in respect to the maximum impact value of each category for the following
damage categories: “Carcinogens”, “Resp. Organics”, “Resp. Inorganics”, “Climatic
Integrated Waste Management – Volume I
460
Change”, “Radiation”, “Ozone Layer”, “Ecotoxicity”, “Acidif/Eutroph.”, “Land Use” and
“Fossil Fuels”. As clearly shown in Figure 12, in terms of one of the ten listed impact
categories, an Incineration scenario is more environmentally sound than the corresponding
Sorting scenario with the difference linearly decreasing with the increasing of the percentage
of separate collection.
Table 22. Management phase with the greatest avoided impact for each impact category
and for MSW management scenarios 11-20 developed in the study performed with
SimaPro
Only for the damage category “Minerals” the difference between the Sorting scenario
impact and Incineration scenario impact was negative, thus indicating that sorting scenarios
were lighter than the corresponding incineration scenarios. As clearly shown in Figure 13, a
Sorting scenario is more environmentally sound than the corresponding Incineration
scenario with the difference linearly decreasing with the increasing of the percentage of
separate collection.
Since for ten out of the eleven impact categories, the difference between the impact of a
Sorting scenario and the impact of the corresponding (in terms of percentage of separate
collection) Incineration scenario was positive, it can be argued that in general Incineration
scenarios are more environmentally sound than the corresponding Sorting scenarios,
especially for low levels of separate collection. While, on the contrary, the difference tends to
diminish with the increasing of the percentage of separate collection.
4. Conclusion
The outputs from 12 out of 21 options modelled were initially analysed under eleven
environmental effect categories as suggested by the WISARD procedure, with the aim of
carrying out a synthetic study of the data available. The impact assessment categories
suggested are as follows: renewable energy use, non-renewable energy use, total energy use,
water, suspended solids and oxydable matters index, mineral and quarried matters,
greenhouse gases, acidification, eutrophication, hazardous waste, non-hazardous waste.
Attention was given to both measuring the overall impact due to the application of the
Comparison of the Suitability
of Two LCA Procedures in Selecting the Best MSW Management System
461
Y (x) = y(x)/max[y(x)] = -0.154 x + 1.385
0.0
0.1
0.2
0.3
0.4
0.5
0.6
0.7
0.8
0.9
1.0
35 40 45 50 55 60 65 70 75 80
(Sorting - Incineration) Scenario Impact [y(x)]
normalised respect the maximum value of
each category [Y(x)]
Percentage of separate collection (x) [%]
Fig. 12. Trend of the difference between the Sorting scenario impact and Incineration scenario
impact normalized in respect to the maximum impact value of each category for the following
damage categories: “Carcinogens”, “Resp. Organics”, “Resp. Inorganics”, “Climatic Change”,
“Radiation”, “Ozone Layer”, “Ecotoxicity”, “Acidif/Eutroph.”, “Land Use” and “Fossil Fuels”
(the positive value indicates that in terms of this impact category, an Incineration scenario is
more environmentally sound than the corresponding Sorting scenario)
y (x) = 0.0047 x - 0.4668
-0.35
-0.30
-0.25
-0.20
-0.15
-0.10
-0.05
0.00
35 40 45 50 55 60 65 70 75 80
MInerals, y(x) [MJ surplus]
Percentage of separate collection (x) [%]
Fig. 13. Trend of the difference between the Sorting scenario impact and Incineration
scenario impact for the damage category “Minerals” (the negative value indicates that in
terms of this impact category a Recycling scenario is more environmentally sound than the
corresponding Incineration scenario)
Integrated Waste Management – Volume I
462
entire MSW management system adopted, as well as the evaluation of the specific
contribution produced by each phase of the MSW management system.
The principal conclusions were that the scenario with 80% separate collection, no RDF
incineration and dry residue sorting was the most environmentally sound option for six
impact categories of the eleven chosen: renewable energy use, total energy use, water,
suspended solids and oxydable matter index, eutrophication and hazardous waste. The
second-best scenario with three impacts of environmentally sound categories (non-
renewable energy use, greenhouse gases and acidification) is 80% separate collection, RDF
production and incineration. For eight impact categories (renewable, non-renewable, total
energy use, water, suspended solids and oxydable matter index, acidification,
eutrophication, hazardous waste), all the MSW management scenarios produced a negative
impact and the highest percentage of separate collection corresponded to the highest
avoided impact.
A similar analysis was made with SimaPro considering the following impact assessment
categories: Carcinogens, Respiration Organics, Respiration Inorganics, Climate Change,
Radiation, Ozone Layer, Ecotoxicity Acidification/Eutrophication, Land Use, Minerals,
Fossil Fuels. Analysing the emission data obtained on material from packaging shows that
in most cases for each item impacts emissions of pollutants in secondary productions are
lower than those corresponding of primary productions.
From a more detailed analysis of results, it appeared that all the scenarios considered have
impact indicators relating to human health and resources with negative values. This means
that in these cases, the integrated systems waste management are environmentally
advantageous compared to traditional methods of production of matter and energy. In
particular, the solution with the direct landfilling of residue is not preferred over the
solution with waste incineration because there is more production of carcinogens substances
during incineration and landfilling of ashes. The stages of management that most affect the
final results of impact are incineration of waste, disposal in landfills, composting of organic
and glass production.
Comparing the two calculation methods adopted, a coincidence of the results in terms of
quality and performance is evident, highlighting the feasibility of the two procedures as
well as the validity of the results. However, the same results are strongly influenced by the
assumptions at the base of the building model and the approximations of reality, thus not
making it possible to carry out a quantitative comparison due to the different models used
for the characterization and representation of the results.
The results are similar for both Life Cycle Assessment procedures in qualitative terms. The
study emphasized the priority of separate collection and recycling to save energy as well as
reduce the environmental impact of MSW management.
The analysis carried out only with SimaPro, showed that for ten out of the eleven impact
categories, the difference between the impact of a Sorting scenario and the impact of the
corresponding (in terms of percentage of separate collection) Incineration scenario was
positive, thus highlighting that in general Incineration scenarios are more environmentally
sound than the corresponding Sorting scenarios, especially for low levels of separate
collection. While, the difference tends to diminish with the increasing of the percentage of
separate collection.
5. Acknowledgment
The authors wish to thank dr. Sacha A. Berardo for his English revision.
Comparison of the Suitability
of Two LCA Procedures in Selecting the Best MSW Management System
463
6. References
Althaus H.J., Classen M., Blaser S., Jungbluth N. (2004), Life cycle inventories of metals. Data
v1.1, Ecoinvent report No. 10. Dübendorf.
Arena U., Mastellone M.L., Perugini F. (2003). The environmental performance of alternative
solid waste management options: a life cycle assessmentstudy. Chemical
Engineering Journal, Vol. 96, pp. 207-222.
Azapagic, A. (1999). Life cycle assessment and its application to process selection, design
and optimisation. Chemical Engineering Journal, Vol. 73, 1–21.
Bjarnadóttir H.J., Friðriksson G.B., Johnsen T. Sletsen H. (2002). Guidelines for the use of
LCA in the waste management sector, NORDTEST project number: 1537-01,
Nordtest, Tekniikantie 12, FIN–02150 Espoo, Finland,
Bruno C., Castiglioni F., Giraudo C., Ferrero R., Regazzoni C., Pitea D. (2002). Life Cycle
Assessment di scenari alternativi per la gestione integrata di RSU nel bacino 10
della Provincia di Cuneo (in Italian), Proceedings of Ricicla 2002, Rimini, Italy,
November 2002.
Curran, M.A. (1996). Environmental Life Cycle Assessment. McGraw-Hill, New-York, USA.
De Feo G., De Gisi S. (2010). Public opinion and awareness towards MSW and separate
collection programmes: A sociological procedure for selecting areas and citizens
with a low level of knowledge. Waste Management, Vol. 30, pp. 958-976.
De Feo G., Malvano C. (2009), The use of LCA in selecting the best MSW management
system. Waste Management, Vol. 29, No. 6, pp. 1901-1915.
Eriksson O., Carlsson Reich M., Frostell B., Bjorklund A., Assefa G., Sundqvist J.O., Granath
J., Baky A, Thyselius L. (2005). Municipal solid waste management from a systems
perspective. Journal of Cleaner Production, Vol. 13, pp. 241:252.
Hischier, R. (2007). Life Cycle inventories of Packagings and Graphical Papers, eco-invent
report nr. 11, Swiss Centre for Life Cycle Inventories, Dübendorf.
Koneckny, K., Pennington, D.W. (2007). Life cycle thinking in waste management: summary
of European commission’s Malta 2005 workshop and pilot studies. Waste
Management, Vol. 27, pp. S92–S97.
Maillefer C., Ménard M., Reusser L., Som C., Stahel U. and Zimmermann P. (1998).
Ökoinventare für Verpackungen. BUWAL Schriftenreihe Umwelt Nr. 250. 2
nd
Edition. BUWAL, Bern.
Nemecek T., Heil A., Huguenin O., Meier S., Reckenholz A., Erzinger S., Blaser S., Dux D.,
Zimmermann A. (2004). Life Cycle Inventories of Agricultural Production Systems
Data v1.1. Centre for Life Cycle Inventories, Dübendorf.
Ozeler, D., Yetiş, Ü., Demirer, G.N. (2006). Life cycle assessment of municipal solid waste
management methods: Ankara case study. Environment International, Vol. 32, pp.
405-411.
Plinke E., Schonert M., Meckel H., Detzel A., Giegrich J., Fehrenbach H., Ostermayer A.,
Schorb A., Heinisch J., Luxenhofer K. and Schmitz S. (2000a) Ökobilanz für
Getränkeverpackungen II - Hauptteil. Texte 37/2000. Umweltbundesamt, Berlin,
Germany.
PRè Consultants (2000). The Eco-indicator 99. A damage oriented method for Life Cycle
Impact Assessment. Methodology Report,
Integrated Waste Management – Volume I
464
PRé Consultants (2007a), SimaPro 7.1. Introduction to LCA with SimaPro,
.
PRé Consultants (2007b), SimaPro 7.1 Tutorial, .
Pricewaterhouse Coopers (2006). WISARD Reference Guide, version 3.7. Pricewaterhouse
Coopers.
Rigamonti L., Grosso M., Giugliano M. (2009). Life cycle assessment for optimising the level
of separated collection in integrated MSW management systems. Waste
Management, Vol. 29, pp. 934-944.
SETAC Society of Environmental Toxicology and Chemistry (1996). Life Cycle Assessment
and Conceptually Related Programmes. SETAC-Europe Working Group, CRP
report, Brussels, Belgium.
Salhofer S., Binner E., Wassermann G. (2007). Strategic environmental assessment in waste
management planning, an Austrian case study. Environmental Modelling &
Software, Vol. 22, pp. 610-618.
24
Life Cycle Assessment in Municipal
Solid Waste Management
Konstadinos Abeliotis
Harokopio University
Greece
1. Introduction
Integrated Municipal Solid Waste (MSW) management is a tedious task requiring the
simultaneous fulfilment of technical, economical and social constraints. It combines a range
of collection and treatment methods to handle all materials in the waste stream in an
environmentally effective, economically affordable and socially acceptable way (McDougall,
2001). Due to the complexity of the issues required for effective integrated MSW
management, various computer-aided approaches that help the decision makers reach their
final decision have been engaged since the early days of integrated MSW management. Any
computer-based system supporting decision making is defined as a DSS (Finlay, 1989). DSS
incorporate computer-based models of real life biophysical and economic systems. There are
two main categories of DSS applied to solid waste management: the first one, based on
applied mathematics, emphasises application of statistical, optimisation or simulation
modelling. The second category of DSS provides specific problem-solving expertise stored
as facts, rules and procedures. In addition, there are also hybrid approaches.
Recently, there has been a major shift towards Life Cycle Assessment (LCA) computer-aided
tools. LCA is a holistic approach that is increasingly utilised for solid waste management
especially in the decision-making process and in strategy-planning. LCA can be categorised
as a hybrid approach since it utilises equations for inventory analysis and recycling loops on
the one hand, while on the other it requires expertise input for impact assessment and
characterisation.
Life Cycle Assessment (LCA) is a holistic approach that quantifies all environmental
burdens and therefore all environmental impacts throughout the life cycle of products or
processes (Rebitzer et al. 2004). LCA is not an exact scientific tool, but a science-based
assessment methodology for the impacts of a product or system on the environment
(Winkler & Bilitewski 2007). It is increasingly utilised for solid waste management systems
especially in the decision-making process and in strategy-planning. LCA has been utilised
for sustainable MSW management since 1995 (Güereca et al. 2006). LCA is an ideal tool for
application in MSW management because geographic locations, characteristics of waste,
energy sources, availability of some disposal options and size of markets for products
derived from waste management differ widely (White et al., 1997; Mendes et al., 2004). LCA
can help reduce local pressures and waste management costs, while considering the broader
effects and trade-offs felt elsewhere across society (Koneczny and Pennington, 2007).
The LCA procedure has been standardized in 1998 and revised in 2006 (ISO 14040, 2006).
Based on this standard, LCA consists of the following four sections:
Integrated Waste Management – Volume I
466
Goal and scope definition,
Life cycle inventory (LCI),
Life cycle impact assessment (LCIA),
Life cycle interpretation.
2. Objective of the chapter
The objective of this chapter is the critical presentation of recent peer-reviewed research
articles dealing with various stages of MSW management using the LCA methodology. In
each article the main LCA components are presented (Goal and scope, functional unit, main
assumptions, data sources for the compilation of the LCI, LCIA categories) in addition to the
main conclusions of the study. Based on this review, conclusions are drawn for answering
the key chapter question “What have we learned from the application of LCA to MSW?”
3. The challenge of dealing with the life cycle of MSW management
The application of LCA in MSW management is a very challenging task due to the following
reasons:
Every single waste management facility is considered a priori as environmentally
friendly. However, solid waste management facilities require land (a lot of land in the
case of landfills), consume non renewable natural resources for their operation (e.g.
fuels and electricity) and emit a series of air pollutants and leachates. Therefore, waste
management facilities put an environmental burden of their own on the natural
environment. The trade-offs between environmental gains and burdens have to be
assessed.
Solid waste management facilities on the other hand generate a lot of useful “products”;
Material reclamation facilities produce different sorts of paper and cardboard, glass,
plastics, etc. A mechanical biological treatment facility generates RDF, which can be
used as a solid fuel in cement kilns for example, and compost which can be used as a
fertilizer substitute. Thermal treatment facilities, the so called waste-to-energy, produce
electricity and heat. Therefore, solid waste management facilities have to be credited for
all those useful “products”.
There is a great deal of uncertainty in a lot of the major solid waste treatment processes.
The lack of quality data with respect to waste management practices is a recognized
problem of LCA (McDougall, 2001). Landfilling, the most widely used MSW
management option, has a lot of uncertainties related to the time frame of the impacts.
Obersteiner et al. (2007) report that data relating to processes with direct measurements
(such as collection, recycling and treatment) are more reliable than data from landfills
which partially have to be modelled and where estimations are necessary.
4. The life cycle of MSW
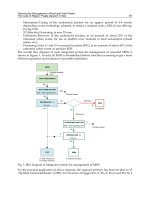
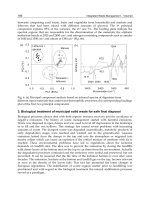
The life cycle of MSW is depicted in Figure 1 by the dotted line. The LCA system boundary
is the interface between the waste management system and the environment or other
product systems. The life cycle starts once a material or product becomes waste, i.e. its
owner discards it in the waste collection bins. MSW is collected either via mixed-bags or via
separate collection. Each collection method requires its own infrastructure, i.e. dedicated
bins and collection vehicles. The transportation stage follows. In the MSW management
Life Cycle Assessment in Municipal Solid Waste Management
467
system of developed countries, the mixed bag waste can either go to the landfill, the waste-
to-energy facility or to the Mechanical Biological treatment plant (MBT). The source-
separated waste, if it is a dry stream (paper and cardboard, plastics, glass, tin, aluminium,
etc.), can go to the material reclamation facility or if it is a wet stream (kitchen leftovers,
garden trimmings, etc.) can go directly to the biological treatment facility.
Mixed bag collection Separate collection
Thermal treatment
Mechanical
Biological
Treatment
Biological
Treatment
Transport
Material
Reclamation
Facility
Landfilling
Transport
MSW generation
RDF
Ash
Residue Residue Residue
Metals Compost
Energy
Glass
Paper Plastics
Methane
Fig. 1. The complete life cycle of MSW
In every management stage, products are presented in green boxes while residues from each
management stage end up in the landfill. The end of the life cycle of MSW is when it ceases
to be waste by becoming a useful product, residual landfill material or an emission to either
air or water (McDougall, 2001). Landfill, therefore, is an end of the MSW life cycle. The
production of useful products resulting from material or energy recovery is also an end of
the life cycle of MSW. Figure 1 presents all possible routes for MSW management. This does
not imply that each waste stream undergoes every management and treatment step. Please
also note that Fig. 1 does not present the resources consumed and the emissions in each
management step.
In the following paragraphs, each one of the aforementioned management stages is
discussed and the necessary data for the implementation of their life cycle inventory are
presented.
5. The life cycle inventory of MSW management
LCA assesses the use of resources and the release of emissions to air, water, land and the
generation of useful products. All these inputs (material and energy resources) and outputs
Integrated Waste Management – Volume I
468
(emissions and products) have to be identified and quantified during the life cycle inventory
(LCI) phase of the LCA. In the following sections, the most important LCI components of
each management stage are identified and presented. Inputs from natural resources and
output emissions are identified in red colour while the useful products in green. The
functional unit (FU) is the reference to which the inputs and outputs are related (ISO 14040,
2006).
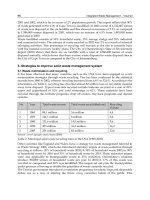
5.1 Collection and transport
Collection of MSW can either be in mixed bags or in separate bins. Mixed bag collection is
the most widely applied method; however separate collection is a prerequisite for successful
material recovery. Fig. 2 presents the inputs and outputs to the collection and transport
stages of MSW management. The inputs are MSW and the materials and energy for the
required infrastructure (MSW temporary storage containers and vehicles needed for
collection and transportation). The outputs of these processes are again MSW (with altered
physical properties such as density) and air, water and solid emissions.
Mixed bag
or separate
Collection
and
Transport
Fuel (diesel, natural gas)
Air emissions
WW emissions
Solid emissions
Vehicle materials (metals, glass, tyres)
Lubricants (engine and hydraulic oil)
Container materials (Steel, HDPE, concrete)
MSW
MSW
Fig. 2. Life cycle inventory components for the collection and transportation stages.
The following parameters must be taken into account for the compilation of an effective LCI
in the collection and transportation stages of an LCA:
Selective collection system,
Material of containers (HDPE, steel and fiber glass),
Collection frequency,
Distance covered,
Type of collection truck (pneumatic, top loader, rear loader, side loader),
Fuel of collection truck (diesel, natural gas),
Density of the waste fractions in containers and collection trucks,
Size of containers,
Filling percentage of the waste containers.
Mechanical
Biological
Treatment
Fuel (diesel, natural gas)
Fe
Al
Compost
Water
Lubricants (engine and hydraulic oil)
Strapping
Air emissions
WW emissions
Residue to landfill
MSW
Electricity
RDF
Fig. 3. Life cycle inventory components for the MBT plant.
Life Cycle Assessment in Municipal Solid Waste Management
469
5.2 Mechanical and biological treatment
Mechanical and biological treatment is a process that generates many useful “products” (see
Fig. 3). Its inputs include mixed-bag MSW, electricity, fuels (e.g. diesel and natural gas),
water and materials for the required infrastructure (e.g. lubricants and strapping). The
outputs are recovered metals (Fe and Al), RDF (which ultimately can be used as an energy
source), compost (which can substitute chemical fertilisers), emissions to air and water and
finally a fraction of residue that ends up in the landfill.
5.3 Thermal treatment
The major inputs and outputs considered when compiling the LCI of an incineration plant
are the following (see Fig. 4): MSW, electricity, other fuels (diesel, natural gas or even coal),
water and activated carbon (for air pollution control), are the major inputs. On the other
hand, the outputs are: flue gas (HCl, SO
2
, NO
x
, dioxins, CO, PM10, HF), bottom ash, iron
scrap, electricity generated, water discharge and air pollution control residues.
Incineration
Fuel (diesel, natural gas)
Water
Bottom ash
Exhaust gases
Electricity
Activated carbon
Lime [Ca(OH)
2
, CaO]
Fly ash
Electricity
MSW and/or RDF
Heat
Fig. 4. Life cycle inventory components for an incineration plant.
The key factors in modelling incineration in LCA terms are (Chen & Christensen, 2010):
incineration technology (e.g. grated firing, fluidized bed), the heating value of MSW
(specified by the MSW composition), the use of auxiliary fuel (type and amount) and
leachate disposal methods (e.g. spraying, wastewater treatment).
5.4 Biological treatment
Fig. 5 presents the major inputs and outputs for the life cycle inventory of MSW biological
treatment. There are two processes included under the term “biological treatment” in MSW
management: composting and anaerobic digestion. The biodegradable fraction of the MSW
is involved in both of the aforementioned processes. Composting is an aerobic process. The
degradable organic carbon in the MSW is converted into CO
2
.
Biological
Treatment
(Aerobic/Anaerobic)
Leachate
Exhaust gases
Residue to landfill
Compost
Biogas
Water
Electricity
MSW (organic fraction)
Fig. 5. Life cycle inventory components for biological treatment.
Integrated Waste Management – Volume I
470
5.5 Landfilling
Landfilling is the first and oldest MSW treatment option. The types of landfilling facilities,
all over the world, range from uncontrolled dumpsites to highly engineered facilities with
leachate and lanfill gas (LFG) management. Fig. 6 presents the major inputs and outputs for
the life cycle inventory of landfilling. When MSW is landfilled directly, anaerobic biological
degradation produces landfill gas and leachate. Over 90% of the converted organic carbon is
released as CO
2
and CH
4
. The remainder is released in the leachate (Obersteiner et al., 2007).
Landfilling
Clay
Leachate
Landfill gas
Top soil
HDPE
Gravel
MSW
Fuel
Fig. 6. Life cycle inventory components for landfilling.
Environmental impacts arising from landfills are: leachate (heavy metals and organic
loading), emissions into the air (CH
4
, other hydrocarbons), the energy inputs (fuel and
electricity) and material inputs for the construction of the engineered landfills (HDPE, clay,
gravel, top soil).
5.6 The contribution of capital equipment and infrastructure
Waste management systems require capital equipment and infrastructure for their
operation, in addition to inputs of energy and materials. All of these equipment and
infrastructure consume natural resources and release emissions to the environment during
their respective life cycles. These emissions, also known as secondary environmental
burdens, tend to be excluded from LCAs of MSW since they are assumed to be relatively
small in comparison to primary burdens (McDougall et al., 2001).
6. Review of selected peer reviewed publications
All of the reviewed studies appeared recently in peer-reviewed journals. They are presented
in chronological order starting from the oldest. They are comparative LCAs that evaluate
the consumption of natural resources, environmental emissions and/or performance of
various types of MSW management systems. The MSW management stages considered in
the reviewed publications are the following:
Collection and transport,
Material recovery via separate collection, material recovery facilities or the application
of MBT technology,
Thermal (mostly incineration) and biological treatment (both composting and anaerobic
digestion) treatment,
Final disposal via landfilling.