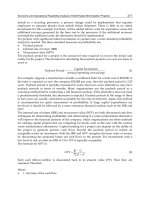
Integrated Waste Management Volume II Part 6 docx
Bạn đang xem bản rút gọn của tài liệu. Xem và tải ngay bản đầy đủ của tài liệu tại đây (2.24 MB, 35 trang )
Integrated Waste Management – Volume II
166
Japan. It is also paving the way for economic and social opportunities in the recycling sector.
However, challenges abound in terms of supply and how urban mining could be
sustainably done in developing countries where technologies are lacking. Likewise,
exposure to toxic metals is high due to the manual nature of recovering used car parts.
Recovery and recycling per se are good but accompanying issues need to be addressed in
developing countries so that real societal benefits are achieved. It is necessary that countries
like Japan, Korea and China identify emerging lessons from the implementation of their
respective ELV recycling laws so that developing countries can learn from them and craft
laws that are appropriate and tailored to local needs and existing resources. This paper
discusses the experiences of Japan and China in the field of urban mining and concomitant
issues and challenges and how they will shape ELV recycling policies in East Asia. Outlook
for the future will also be tackled as a way to create a road map for East Asia in the field of
automobile recycling.
2. Urban mining opportunities and markets in Asia
The term “urban mining” was coined by Professor Nanjyo of Tohoku University in the
1980s to encourage and promote the reuse of precious and rare-earth metals found in used
and discarded electronics. Japan, a heavy user of rare earth metals for its electronic and
automobile industries, depends largely from China which produces 90% of the world’s rare
earth metals. The table below shows the top producers of rare earth based on 2009 data:
Country Production (Metric Ton) Reserves (Metric Ton)
United States insignificant 13,000,000
Australia insignificant 5,400,000
Brazil 650 48,000
China 120,000 36,000,000
Commonwealth of
Independent States
Not available 19,000,000
India 2,700 3,100,000
Malaysia 380 30,000
Other countries Not available 22,000,000
World total (rounded) 124,000 99,000,000
Source:
Table 1. World Mine Production and Reserves (2009)
In July 2010, China announced a 72% reduction of exports due to increasing domestic
consumption. This prompted the Japanese government to search for alternative sources and
a research made by the National Institute of Material Science, a research organization
affiliated with the Japanese government, announced that 6,800 tons of gold can be recovered
from used electronics in Japan. This massive reserve is projected to be equivalent of 16% of
the world’s total reserves. Other reserves that can be generated are silver with 22%, tin with
11% and other materials at 5% (Kawakami, 2010). Clearly, the study showed the vast
potential of internally sourcing rare earth metals in Japan rather than depending solely from
foreign markets. It is sitting on mountains of used appliances and ELVs on its backyard
where necessary resource inputs for new cars abound.
Emerging Issues on Urban Mining in Automobile
Recycling: Outlook on Resource Recycling in East Asia
167
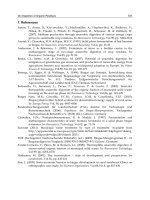
In ELVs, various metals can be found from different parts of a car. The following figure
shows the distribution of rare earth metals from the exterior components of a car:
Source: Nagamura, 2010
*Mn – Manganese; Ni – Nickel; Cr – Chromium; Mo - Molybdenum
Fig. 1. Rare earth metals in auto parts
It will be noted from the above figure that Chromium has the highest concentration in
engines and processing equipment while Manganese is abundant in suspension and steering
parts. The rest of rare earth metals are spread in other auto parts. In terms of the price of
earth metals, the following table shows the resource market fluctuation for iron ore, iron
scrap, copper, silver and gold:
Metals ($/t) Jan 2010 Jan 2011
Range of
Elevation(%)
Iron ore 135 189.5 40.37
Iron scrap 313.5 462.5 47.53
Copper 7,065 9,585 35.67
Gold 1,084.80 1,340.70 23.59
Silver 1,621.20 2,791.90 72.21
Source: Asahi Newspaper, 2011
Table 2. Resource market fluctuation
The prices of valuable earth metals in the world market have significantly risen from 2010 to
2011 with silver achieving the highest increase. In terms of recycling market, the top three
countries which have captured substantial markets for recycling are China, India and Japan
as shown on the following:
Integrated Waste Management – Volume II
168
Source: Ministry of Environment, Japan
Fig. 2. Recycling markets in Asia
3. Existing ELV legislations examined
The momentum towards ELV recycling was jumpstarted by the European Union (EU) with
the passage of an ELV recycling law in 2000. Japan passed the “Law for the Recycling of
End-of-Life Vehicles” in 2005. Korea legislated the “Act for Resource Recycling of Electrical
and Electronic Equipment and Vehicles“ in 2008. China, on the other hand, has “Statute 307”
which was enforced in 2010. One of the salient features of this law is that vehicle producers
of imported vehicles shall be responsible for the recovery and treatment of used vehicles
(Serrona, Yu & Che, 2009). There are distinct variations in each of these laws but they all fall
under the principle of “Extended Producer Responsibility” or EPR. Producers are largely
responsible for recovery but consumers are also entrusted with certain responsibilities. It
may be worth to comparatively revisit these laws as follows:
European Union
J
apan Korea China
Implementation
y
ear 2000 2005 2008 2010
Dismantlement
method
Machine and
Manual
Machine and
Manual
Machine and
Manual
Manual
Accountable entity
and associated
rec
y
clin
g
costs
Manufacturer End users Manufacturer Manufacturer
Operating principle Market-based
Fund system
(Air Bag, Freon
gas &
Automobile
Shredder
Residue or ASR)
Market-based Market-based
Institutional
mechanism
Member states
J
apan
Automobile
Recycling
Promotion
Center
Korea
Environment
Corporation Eco
Assurance System
(ECOAS)
China National
Resources
Recycling
Association
Table 3. Comparison of existing ELV laws
Emerging Issues on Urban Mining in Automobile
Recycling: Outlook on Resource Recycling in East Asia
169
The above table reflects the uniqueness of Japan in terms of who is responsible in ELV
recycling. The end users are the main actors as far as financial obligations are concerned
such as payment of recycling fees. However, manufacturers are liable too like setting and
publication of user fees and collection and disposal of shredder residues. Further, the above
laws put both the manufacturers and users at the helm of recycling. This characteristic
represents the necessary symbiosis that stakeholders play in resource recycling (Yu, Omura,
& Yoshimura, 2008).
4. ELV Recycling in Japan and China
Japan has been implementing its ELV law since 2005. The vehicles covered by the law are
four-wheeled passenger cars and commercial vehicles including mini-cars. The obligations
of the car manufacturer comprise of collection and disposal of freon gas and airbags,
collection and recycling of automobile shredder residue and setting and publication of user
charges. Unlike other countries with ELV laws, financial responsibility is with the users
where they are required to deposit a recycling fee at the time of sale. For old vehicles,
deposit is required at the time of automobile inspection. The fees are managed by a fund
management corporation (Kanari, Pineau, & Shallari, 2003).
Car recycling in Japan is not encompassing as it only covers three parts: airbag, freon and
automobile shredder residue (ASR). As of the present, recycling rate in Japan is pegged at
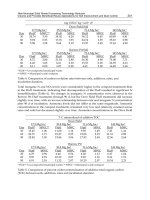
95%. Table 1 shows the change in the generation of ELV and used car export of Japan for the
period 2005 to 2008:
2005 2006 2007 2008
ELV Generatio
n
305 357 371 358
Cancelled re
g
istration of used car for
export
107 144 161 130
Sales of used car 811 807 753 718
Source: Japan Ministry of Economy, Trade and Industry (METI)
Table 4. ELV generation and used car export figures (Unit: 10,000 cars)
ELV generation grew rapidly from 2005 up to 2007 and a decline was noted in 2008. This
was due to the introduction of an ELV bounty system or subsidy. However, it is not only the
recycling rate of used car parts that is important but also the reduction in the volume of ASR
because of its harmful effects to human health and the environment, in general. Table 5
reflects the recycling rates for both ASR and airbag:
Rec
y
clin
g
Rate (%)
ASR Airba
g
Goal (%)
70% (until 2015)
85% 50% (until 2010)
30% (until 2005)
2008 72.4-80.5 94.1-94.9
2009 64.278.0 92.0-94.7
Source: Japan Ministry of Economy, Trade and Industry (METI)
Table 5. Recycling rates for ASR and airbag in Japan
Integrated Waste Management – Volume II
170
ASR remains a challenge for Japan as recycling rate is still not catching up with say airbags.
The goal in the next five years is to increase the rate from 50% to 70% in 2015. In summary,
the flow of automobile recycling in Japan is shown in the following figure:
Fig. 3. Flow of automobile recycling in Japan
The above figure shows the efficiency of car recycling in Japan as used car parts are
categorized. For example, reuse of used parts is about 20-30%, resource recycling is 50-55%
while ASR recycling is 12%. Only five percent (5%) goes to the landfill (Yu, 2010).
4.1 Dismantling experiment in Japan
Rare earth metals are not the only valuable resource found in used cars. Plastic materials are
also abundant. As part of the 3R Research and Development Project by Miyagi Prefecture in
Japan, an experiment was conducted to demonstrate the time element involved in dismantling
a used car with plastic as the main material recovered. Two types of used cars were
dismantled: commercial car and luxury car. Methodologies were manual and machine
dismantling (note that dismantling was done by non-experts). The following are the results:
Methodology Time Responsible
Manual dismantling 15 minutes 1 person (non-expert)
Machine dismantling 5 minutes
Separation and collecting plastic 10 minutes 1 person (non-expert)
Table 6. Dismantling of a commercial vehicle
Emerging Issues on Urban Mining in Automobile
Recycling: Outlook on Resource Recycling in East Asia
171
Overall, the recovered amount of plastic was 20 kilograms. The following picture shows an
image of a commercial vehicle dismantled by a machine.
Fig. 4. Commercial vehicle to be dismantled for waste plastic recycling
Waste plastic recovered are shown below:
Fig. 5. Recovered plastics from a commercial vehicle
It was observed that it is very easy to retrieve plastic materials from a commercial vehicle
because of the simplicity of its interior and a single type of plastic was used. In addition,
commercial vehicles are designed where it is easy to dismantle and recover plastic materials.
On the other hand, a luxury car was dismantled with the following results:
Integrated Waste Management – Volume II
172
Methodology Time Responsible
Manual dismantling 40 minutes 2 persons (non-expert)
Separation and collection 10 minutes 2 persons (non-expert)
Table 7. Dismantling of a luxury vehicle
The recovered amount of waste plastic was only five (5) kilograms compared to the
commercial vehicle which was 20 kilograms. The reason was that a luxury vehicle has
complex interior and is made of composite plastic materials. Also, many adjoining materials
are used which complicates the dismantling process and is time consuming as well.
Fig. 6. Luxury car dismantled for waste plastic recycling
Sample of recovered plastic materials is shown below:
Fig. 7. Waste plastic from a luxury car
A dismantling experiment was also made for a small sedan with amount of plastic materials
recovered shown below:
Emerging Issues on Urban Mining in Automobile
Recycling: Outlook on Resource Recycling in East Asia
173
Fig. 8. Waste plastics recovered from a small sedan
In summary, the amount of plastics recovered are as follows:
Polypropylene (PP)
PP+Polyethylene
(PE)
PE NA Composition
Total
(kg)
Weight
(kg)
19.5 2.90 2.72 0.52 0.8 26.44
The downside of the experiment was the time it took to dismantle the vehicle. The total
amount of time consumed was 2.5 hours by four (4) non-expert persons with a plastic
recovery of only 19.5 kilograms. It was concluded that waste plastic recycling from a small
sedan is not good considering the lengthy dismantling time and poor recovery efficiency.
Sample of plastics recovered are:
PP PP+PE PP+PE PP PP
0.14 0.10.16 0.26 0.04
PP PP PP P P P P
0.12 0.32 0.32 0.32 0.04
5
67 8 9 10
12 3 4
Integrated Waste Management – Volume II
174
On the left side are plastic pellets and on the right side is the internal part of a fender. In
summary, the volume of plastics that can be recovered as well as the recovery efficiency
depends on the type of vehicle. Figure 9 shows this type of variation.
Fig. 9. Recovery efficiency for various types of vehicles
Based on the experiment, it can be concluded that for dismantling time, commercial vehicles
are quick to be dismantled while minivans take time. In terms of volume of plastics
recovered, relatively big cars like commercial vehicles, station wagons, and minivans have
large amount of plastic materials.
4.2 Economic potential of ELV recycling in China
China’s economy is booming at an unprecedented rate. Looking at car possession alone, the
following table shows the rate for the period 2005-2008:
Year Volume of car (million)
2008 49.75
2007 43.58
2006 36.97
2005 31.6
Table 8. Car possession rate in China (2005-08)
Emerging Issues on Urban Mining in Automobile
Recycling: Outlook on Resource Recycling in East Asia
175
It is projected that the number of cars in China will increase a million per year in the near
future due to increasing purchasing power and demand for personal transportation. From
the data mentioned, it is also worth to examine the volume of cars that will become “used”
in the near future. Using the following formulae:
E=A+B-C
Where:
E number of presumed used cars at current year
A number of car possessions in previous year
B number of sales at current year
C number of car possession at current year
Thus, the number of projected used car between 2005 and 2007 is as follows:
Year Projected used car (million) Rate (%)
2007 1.97 4.5
2006 1.79 4.8
2005 1.05 3.3
Table 9. Projected used cars in China (2005-2007)
It is, therefore, projected using the above data that China will have a large volume of used
cars in the years to come.
There are about 10.33 million passenger cars in China in 2001 with an engine displacement
of 1,600 cc or less. In several years, these will become used cars. A study made in Shanghai
City and the City of Beijing showed that recovery percentage of ELVs in China is only 20%.
To validate this, Tohoku University through the environmental research fund of Sumitomo
Foundation conducted a dismantling experiment of a car commonly sold in China as shown
below:
Fig. 10. Popular type of car sold in China
Integrated Waste Management – Volume II
176
Considering the costs and difficulty involved in dismantling a new car, the research group
selected a model closed to the picture as shown in Fig. 11.
Fig. 11. Replacement car used for dismantlement
The recovered materials are as follows:
Fig. 12. Material composition of a passenger car
72.0
8.0
3.0
1.5
5.0
5.0
5.5
iron
aluminum
copper
lead
glass
seat
others
Emerging Issues on Urban Mining in Automobile
Recycling: Outlook on Resource Recycling in East Asia
177
If only 20% are to be recovered from the 7.2 million passenger cars sold in 2009, the
projected economic loss is about 200 billion Chinese Yuan based on the metallic market price
in China. Thus, the need to find ways to increase recovery rate of ELVs is necessary in the
country where car possession is increasing at a rapid rate (Che, 2011).
5. Monitoring system: A prerequisite in ELV recycling
The importance of establishing a monitoring system in ELV recycling is essential in so
many aspects. ELV recycling is about collating information or data needed to make it
more efficient and useful for key stakeholders like manufacturers, recyclers and even
those who manually recover used car parts. In the case of EU, it ensures the inventory of
ELVs while in Korea, every ELV is checked including weight, type and main parts like
bumper, fuel cell, engine, exterior and interior parts and so on (“Yu, Omura, &
Yoshimura, 2008). In the case of Japan, monitoring focuses on airbag, Freon gas and ASR
as mentioned earlier. The actual benefits of having a monitoring system abound. It helps
in increasing dismantling efficiency when each part is identified i.e. weight, type, time
consumed during dismantling and the amount. Having these data will be useful for
sharing purposes between the manufacturers and recyclers (Yu, 2010). The data could also
be used in life cycle analysis (LCA) and cost-benefit analysis (CBA). Another benefit is the
potential of determining who is responsible for what and what roles should relevant
stakeholders play in the whole gamut of ELV recycling.
6. Emerging issues and challenges
Advance technology in used vehicle recovery and recycling does not necessarily apply in
developing countries. They can recover resources using labor-intensive and manual
strategies. Efficiency remains a question but in a research in China (Serrona, Yu & Che,
2010), a comparison between manual and machine-based dismantling was made. It was
discovered that the former recovers more valuable parts which means more parts sold or
recycled while the latter destroys more parts. In terms of value, manual dismantling
provides more monetary compensation with more recovered parts. It also translates into
more job opportunities and feeds people. The downside is that manual labor exposes
people, engaged in the recovery of used car parts, to hazardous and toxic chemicals due
to the absence of protective gears. It also consumes a lot of time. Manual recovery is good
from the standpoint of local community participation. It allows them to be important
stakeholders in the resource recycling ecosystem.
There is no blueprint for ELV recycling across countries. Each country has its distinct
characteristics of stakeholders and geographical location. The formulation of recycling laws
should be based on the unique features of communities rather than applying blanket
legislations which may or may not be effective at all. To come up with sound laws is to have
good documentation of vehicle database i.e. registration, type of vehicle and other ELV data.
Policy makers should take these into consideration in order to arrive at legislations that
incorporate locality-based conditions, needs and characteristics into national policies.
7. Conclusions and recommendations
Urban mining is driving ELV recycling into sustainable waste management. Just like solid
waste management, various stakeholders or players are involved such as manufacturers,
Integrated Waste Management – Volume II
178
recyclers, users, waste reclaimers and the communities where waste recovery is done.
There is a wide range of opportunities in this field and what is significant is that it has
tremendous impact in terms of reducing toxic waste and providing local employment. In
addition, it helps mitigate climate change by reducing greenhouse gases as recovering and
recycling rare earth metals consume less energy than extracting raw metals. Closing the
loop of rare earth metal utilization is a necessary attribute of sustainable consumption and
production.
The experiences of Japan and Korea in this aspect are worthy of emulation by other
countries in East Asia. Developing countries, being the destination of used cars, should
formulate legislations that will address the collection, trading and disposal of ELVs which
consider local conditions and capacities. There is a vibrant informal ELV waste sector in
the Philippines, for example, but there is neither database nor monitoring system of
what comes to the country as other ELVs are brought in illegally. The challenge lies in
coming up with a legislation that strongly advocates safe and sustainable resource
recovery. The role of Japan and Korea is to provide technical assistance based on their
best practices. And being the leading manufacturers of vehicles in Asia, they should
incorporate LCA in the production process so that the end users in developing countries
are able to responsibly dispose used cars. Likewise, regulatory institutions will be able to
promote the development of appropriate, labor-intensive and simple technologies to
recover and recycle used metal parts. This kind of symbiosis will allow for a sound
partnership between these countries through job promotion and people to people
exchange of ideas. To strengthen ELV recycling regulations, the following are
recommended:
1. Establishment of a resource recycling network that integrates economic and social
dimension of ELV recycling. It should serve as a platform for exchanging innovative
ideas, appropriate technologies and best practices in both developed and developing
countries. There should also be component for capacity-building and community
organizing to strengthen local waste reclaimers doing manual recovery. Organizing
them into a legal entity will allow them to be accorded with rights, privileges and access
to social and health services.
2. Build up a communication system between car manufacturers and recyclers. Currently,
there is limited information exchange on ELV recycling processes. In the context of
sustainable consumption and production, auto makers need to design cars that are
easier to scrap and recover recyclable parts. Furthermore, they should provide the
method of resource recovery including rare metals. And it is important to collect data
on the content of materials as well as the cost and time involved in the recycling
process.
3. In the formulation of ELV recycling legislations, lessons should be culled out from the
best and bad practices of ELV recycling in Japan, Korea and even China. This includes
an assessment of market principles used in the current system and how it will affect the
future of resource recycling network worldwide. Policies should also be region-specific
and localized to reflect in recognition of the distinct features of each locality or
community.
4. The technological dimension of urban mining should be given attention with respect
to local capacities and recovery efficiency. Based on dismantling experiments cited,
Emerging Issues on Urban Mining in Automobile
Recycling: Outlook on Resource Recycling in East Asia
179
manual dismantling is found to be effective in terms of recovering more resource
materials compared to machine-based recovery. It is not always necessary that
machines are effective since manual recycling in developing countries generates local
jobs and increases the value of recovered parts. However, such method should ensure
adequate protection of workers from exposure to toxic materials.
5. Engage constructive policy dialogues with exporting countries like Japan and Korea to
discuss ways to ensure that used car importation comes with the necessary recovery
system in developing countries. This will ensure that developing economies are not
inundated with pollutive used cars and ELV recycling is done.
8. References
Che, Jia. 2011. Study on a policy model for the establishment of ELV recycling system in
China. PhD diss., Tohoku University.
Increasing recycling markets in Asia. 2011. Asahi Newspaper.
Kanari, N.; Pineau, L. & Shallari, S. (2003). End-of-Life Vehicle Recycling in the European
Union. JOM Journal. Volume 55, No. 8 (August 2003) pp. 1-8,
(accessed April
2, 2011).
Kawakami, Takako (2010). Urban mining softens the blow of restricted supply of precious
and rare-earth metals for electronics. Technology Forecasters Inc
/>restricted-supply-of-precious-and-rare-earth-metals-for-electronics/ (accessed June
7, 2011).
Nagamura, Yuki. 2010. Substance flow analysis of rare metals associated with iron and steel
scraps. Master’s thesis, Tohoku University [in Japanese].
Saito, Yuko & Jeong-soo Yu. 2011. Studies on regional policies: A comparative analysis of
urban mining project initiatives by local governments between Japan and Korea.
Annals of the Japan Association of Regional Policy Scientists (9), 209-214 [in
Japanese].
Serrona, Kevin Roy, Jeong-soo Yu & Jia Che (2010). Managing Wastes in Asia: Looking at
the Perspectives of China, Mongolia and the Philippines, Waste Management, Er
Sunil Kumar (Ed.), ISBN: 978-953-7619-84-8,
InTech, Available from:
/>looking-at-the-perspectives-of-china-mongolia-and-the-philippines.
Yu, Jeong-soo, Michiaki Omura & Keiichi Yoshimura. 2008. Controversies and issues of
automobile recycling policy in Japan and Korea. Annals of the Japan Association of
Regional Policy Scientists (6), 193-200 [in Japanese].
Yu, Jeong-soo. 2010. Issues on Resource Recycling in Asia: Outlook for the Future based on
the Experience of Automobile Recycling in Japan. Keynote Speech at the 3
rd
Asian
Automotive Environmental Forum, China, October 14.
Integrated Waste Management – Volume II
180
Yu, Jeong-soo. 2010. The Current Scenario on ELV Recycling Systems in Asia: Focus on
Operation Status in Korea and Trend Analysis in China. Material Cycles and Waste
Management Research 21(2), 87-95 [in Japanese].
11
Phosphorus in Water Quality
and Waste Management
Helmut Kroiss, Helmut Rechberger and Lukas Egle
Institute of Water Quality, Resources and Waste Management
Vienna University of Technology
Austria
1. Introduction
Phosphorus (P) is a key element for all living systems. Phosphorus is a component of DNA
and RNA and indispensable for the energetic metabolism (ADP/ATP) of living beings.
Phosphorus cannot be substituted in these biological functions by any other element. The
tremendous growth of global population is therefore linked to a proportional increase of
phosphorus requirement for the production of food, which actually to a large extent is
depending on the use of mineral phosphorus fertiliser.
Many natural (aquatic) ecosystems are controlled by restricted availability of phosphorus
which represents one important factor for high biodiversity. The anthropogenic increase of
phosphorus flows therefore has the potential to cause severe negative effects on natural
(aquatic) ecosystems (see section 2).
1
Roughly 80 - 90% of the extracted phosphate rock is used for food production and nutrition.
Given that P is a non-renewable resource and the global reserves are limited (contrary to
nitrogen another essential nutrient) the aspects of scarcity and recycling/recovery have to
be considered. Today’s global mine production and reserves of phosphate rock (average
P
2
O
5
content is 31 % (P 13.5 %), ranges from 26 - 34 % (P 11 - 15 %) (Kratz et al, 2007; Steen,
1998) are reported ca. 160 Mio t/a and 16 billion tons, respectively (USGS, 2010). This gives a
static lifetime for the reserves of some 120 years, a number which has been similarly
reported by several authors before (Röhling, 2007; Wagner, 2005; Rosmarin, 2004;
Pradt, 2003; Steen, 1998; Herring et al., 1993), others come to lifetimes up to hundreds of
years (EFMA, 2000).
Phosphate ore is produced mostly from open pit mines, resulting in dust emissions and
large quantities of tailings (mining wastes). Villabla and colleagues (2008) report material
and energy consumption data for the production of 1 ton of P
2
O
5
(Table 1). Another major
waste is produced at a later stage when wet phosphoric acid (H
3
PO
4
) is produced from
phosphate rock concentrate using sulphuric acid. This so-called phosphogypsum (ca. 5 tons
per ton of wet H
3
PO
4
) is normally disposed of at sea or in large-scale settling ponds. It has
very little use because it contains a considerable number of impurities such as Cadmium
and radioactive elements (Villabla et al., 2008).
Attention: in historic literature phosphorus content of products or minerals is mostly expressed as P
2
O
5
which corresponds to 0,44 P. Actually there is a trend to relate all data to P as element.
Integrated Waste Management – Volume II
182
The above mentioned coverage times show that there is no urgent scarcity problem appearing
at the horizon but the following aspects are worth to be considered: First, the relevant reserves
of phosphate rock are highly geographically concentrated in China, Morocco & Western
Sahara, South Africa and the U.S. The world’s largest producers are China, followed by the
U.S., Morocco and Russia (USGS, 2010). Large economies such as Western Europe or India
have virtually no domestic supply and are dependent on imports. This is one major ingredient
for a geopolitically instable situation. Second, the quality of extracted phosphate rock is
continuously declining, meaning that the content of hazardous substances such as Cadmium
and Uranium is rising (Kratz & Schnugg, 2006; Van Kauwenbergh, 1997; Steen, 1998). This will
require, e.g., the employment of costly decadmiation processes in the future if agricultural soil
shall be further on protected and not be used as a sink for heavy metals. Third, population
growth, nutrient conditions of soils in developing countries and changing nutrition patterns
(changeover to a meat- and dairy based diet) will entail increased demand of fertilisers. The
Food and Agriculture Organisation predicts annual growth rates between 0.7 to 1.3 % until
2030 (FAO, 2000) which would mean an increase of some 25 % in phosphate rock consumption
compared to now. The Population Division of the Department of Economic and Social Affairs
of the United Nations Secretariat predict 9.2 billion people in 2050 (+37 %) (UN, 2008).
Considering these facts similar market effects and price volatility as currently are the case for
crude oil have to be anticipated for phosphorous fertilisers in the future (Fig. 1).
Production Stage Input Output
Mining Electricity 697 MJ Waste 21.8 tons
Diesel 125 MJ Mine water
Explosives 3,3 MJ Diesel exhaust gases
Mineral processing Water Waste water
Electricity 1,128 MJ
Tailings 6.5 tons
Flotation reagents
Diesel 396 MJ Diesel exhaust gases
Total primary,
energy consumption ca. 5,500 MJ
Total solid waste ca. 28 tons
Table 1. Material and energy consumption for the production of 1 ton P
2
O
5
(= 0.44 t P),
adapted from Villabla et al. (2008).
Fig. 1. a) Phosphate rock production and world population (historic situation and future
trends); b) Phosphate rock commodity price 2006 – 2010
Phosphorus in Water Quality and Waste Management
183
Mankind’s usage of P is rather non-circular and dissipative. Bacinni & Brunner (1991)
established a P-balance for the 1980ies where it is shown that the use of P is inefficient (only
10% of P employed in agriculture is contained in the food) and large losses occur to the soil
and the hydrosphere. These findings still hold and today there is consensus that effective
phosphorous management in agriculture and waste water is of upmost importance.
Considering the above mentioned today’s goals for P management in a region could be:
Keeping soil fertility under minimized P fertilization, reducing surface emissions to the
hydrosphere, reducing point emissions to the hydrosphere and increasing recycling.
In countries with centralised waste water infrastructure sewage sludge is a by-product a
result of fulfilling a legal requirement for water protection by waste water treatment.
Sewage sludge represents a relevant source for P-recycling, especially if P-removal from
waste water is applied (UWWD, 1996) (see section 1.2). For example, Austria imported
31.000 t P/a in form of phosphate rock, fertilisers, food, and fodder in 2001 (Seyhan, 2006).
The actual P content of sewage sludge in Austria is ca. 7,000 t P/a, which corresponds to a
P-removal efficiency of ~ 85 % from waste water.
Sewage sludge is a waste according to actual legislation, as long as it cannot be marketed as
a product (e.g. to phosphate industry substituting phosphate rock). The common practise to
recycle the P-content of sewage sludge is its application in agriculture as fertiliser and soil
conditioner. As sewage sludge also contains potentially hazardous substances (pathogens,
heavy metals and organic micro-pollutants) this recycling path is subject to various legal
constraints (US/EPA Biosolids Rule and NPDS, EU Sludge Directive 86/278, numerous
national and regional sludge regulations, soil protection regulations) and is still a matter of
controversial discussion even in the scientific community. (Engelhart et al., 2000;
Brunner et al., 1988; Giger et al., 1984; Giam et al., 1984; Sjöström et al., 2008;
Sandaa et al., 2001; Ghaudri et al., 2000; Giller et al., 1998)
In US and UK the main risk associated with sludge recycling is related to hygiene
(pathogens) and there is a clear distinction between sludge and biosolids, the later being a
market product meeting certain quality criteria. In parts of Europe the main risk is
associated with soil and food protection (heavy metals and micro-pollutants). Beyond
agriculture and waste water treatment plant operators and also food industry, food chain
traders and retailers and numerous NGOs are stakeholders. Also the competition between
sludge as P-fertiliser and manure application in countries/regions with extensive animal
production has to be considered in this context.
Sludge application on land has strongly supported the reduction of emissions from point
sources which was very successful for heavy metals where the concentrations in sewage
sludge considerably decreased during past decades. Regarding the source control of micro-
pollutants the discussion has started but as these substances to a large extent originate from
market products the situation is much more complex than for heavy metals. Sewage sludge
not meeting the actual quality criteria for land application or sludge produced in
countries/regions where land application is banned (e.g. in Switzerland) have to be
disposed of. Where landfilling of organic material, as sludge, is not allowed any more
incineration has become a viable treatment option as ashes meet the criteria for landfilling.
At present sludges are incinerated in so-called mono-incinerators or co-incinerated in cement
kilns, coal-fired power plants and waste incineration plants. Incineration destroys the organic
sludge fraction including the micro-pollutants. Phosphorus and also most of the heavy metals
are contained in the ashes. A favourable condition for P-recovery is only with mono-
Integrated Waste Management – Volume II
184
incineration (maybe co-incineration with P-rich waste fractions) because only then P-rich ashes
are produced which can be put to special storage sites for future recycling of P.
2. Phosphorus in water quality management
Phosphorus is the limiting nutrient for algae (autotrophic) growth in most fresh water
bodies (lakes, rivers and reservoirs) and some coastal waters influenced by river
discharges. The anthropogenic discharge of phosphorus to these waters therefore
increases the potential for algae growth, which is the starting point of eutrophication.
Eutrophication is characterised by increased availability of phosphorus for primary
production (algae) which represents the basic substrate for the aquatic ecosystems. Even
moderate anthropogenic increase of P availability influences the competition between the
species which results in changes of the aquatic ecosystem Beyond certain thresholds of
phosphorus discharge the ecosystems shift to a completely different status with steadily
increasing deterioration of water quality.
In natural environments phosphorus is mainly present in particulate form as minerals with
low solubility. The availability of phosphorus for plants and algae is therefore quite
restricted. Hence in many natural aquatic ecosystems life is limited by phosphorus
deficiency. The decay of the organic material produced by photosynthesis under aerobic
conditions again results mainly in mineral phosphorus compounds in the sediments with
low availability. Under anaerobic conditions decomposition process results in the release of
phosphorus in dissolved and therefore easily accessible form.
Natural environments normally are characterised by restricted dissolved phosphorus flows.
Soil erosion results in relevant phosphorus loads depending on the P-content of the
particulate material either coming from natural rocks and soils or from agricultural land. As
long as this material remains under aerobic conditions in the waters and their sediments,
availability of phosphorus for algae growth is low. The main anthropogenic sources of
phosphorus, except erosion, for the aquatic environment are (Lee et al., 1978):
municipal and industrial waste waters
drainage from agricultural land
excreta from livestock
diffuse urban drainage
Humans need a daily phosphorus uptake of 1.8 - 2 g P via their nutrition and discharge it
with their excreta to the waste water. Most of this phosphorus is easily accessible for plants,
in waters for algae and macrophytes. Waste water therefore has a great potential for
enhancing eutrophication if not properly handled before discharge to the aquatic
environment. Agriculture uses either mineral phosphorus fertilisers or manure to meet the
phosphorus requirement for crop production. If correctly applied phosphorus is either taken
up by the crops or retained in the topsoil. Only soils with low quality tend to release
phosphorus compounds to the ground water, as e.g. at reclaimed agricultural areas from
wetlands. For the assessment of the effect of phosphorus discharges to waters it is always
relevant to investigate the availability of the phosphorus loads (particulate versus dissolved)
and that this strongly depends on the redox conditions in the sediments.
2.1 Source of P in waste water
The main sources of phosphorus in waste water are the human excreta, phosphorus
containing household detergents and some industrial and trade effluents. Precipitation
runoff only little contributes to P-loads in waste water if combined sewer systems are
Phosphorus in Water Quality and Waste Management
185
applied. Figure 2 shows the input and output loads of households in Austria, where P-free
laundry detergents but phosphorus containing dish-wash detergents are used.
Fig. 2. Recent phosphorus loads from households (Zessner & Aichinger, 2003)
Industrial use of phosphorus is quite limited; relevant phosphorus loads in industrial
effluents therefore are relatively low. P-discharges to waste water can origin from food and
textile industry and from rendering plants. Industrial and trade contribution to P-loads in
municipal waste water can vary in a broad range depending on local situations and is in a
range of 10 to 40 %.
Historical development
In the 1970 and 80’s the daily phosphorus load per inhabitant in municipal waste water was
up to 5 g, the main source being the phosphorus containing laundry detergents. Due to the
resulting eutrophication problems the removal of P-containing detergents from the market
was achieved which resulted in the actual P-loads in municipal waste water of 1.4 -
1.6 g P/PE/d (1PE = 60 g BOD
5
/d, or 120 g COD/d). Dish wash detergents still contain
phosphorus and contribute to about 10% of the P-loads (ATV, 1997; ATV DVWK, 2004). This
development makes P-elimination from waste water at treatment plants more economically
and ecologically advantageous. Application of P containing dishwashing detergents is still
increasing and therefore the development and application of P-free dish wash detergents are
aimed at.
While phosphorus can be or has to be removed from municipal waste water, the biological
treatment of industrial waste water often requires the addition of phosphorus As bacteria
are able to store phosphorus the control of P-dosing is not easy. Low phosphorus
availability favours the growth of filamentous bacteria (at activated sludge treatment
plants), which results in bad settling and thickening properties of the sludge. Impairment of
thickening properties of the sludge can be used as a sensible indicator of phosphorus
deficiency. Severe P-deficiency strongly affects treatment efficiency. An excess dosing of
phosphorus can result first in filling the P-storage capacity of the microorganisms and
therefore will not immediately be detected by rising P-concentrations in the effluent.
(Prendl et at., 2000; Nowak et al., 2000)
2.2 Phosphorus elimination
In most of the surface waters, availability of phosphorus limits the growth of algae and
macrophytes. The discharge of P-loads contained in waste waters therefore normally results in
an increased growth of algae and macrophytes which may cause reduced water quality by
eutrophication. This is especially relevant for lakes and estuaries (“Sensitive Areas”) but also
can affect the quality of rivers. According to EU Urban Waste Water Directive (91/271/EEC)
phosphorus needs to be eliminated from the waste water at treatment plants in sensitive areas.
Integrated Waste Management – Volume II
186
The EU effluent standards for sensitive areas for total phosphorus (TP) are 2 mg/L for WWTP
10.000 - 100.000 PE and 1 mg/L for more than 100.000 PE or a minimum TP load reduction of
80 %. National standards can be even more restrictive especially for catchments of lakes or
very sensitive coastal regions. Where environmental standards cannot be met by applying
only the minimum requirements (effluent standards according to precautionary principle)
much higher P-removal requirements can be prescribed for specific WWTPs (e.g. MURTHY,
Chesapeake Bay, Blue Plains WWTP). Figure 3 shows a single step waste water treatment
plant with its typical mechanical, biological and sludge treatment processes.
Fig. 3. Schematic of a conventional activated sludge treatment plant
2.2.1 Mechanical treatment
During mechanical treatment phosphorus contained in the particulate material is removed
from the waste water together with primary sludge which results in a TP removal of 10 -
15 %. Biological incorporation, enhanced biological P-removal and chemical precipitation
are state-of-the-art processes to reliably reduce P-load from waste water. The total
phosphorus loads removed from the waste water in most of the processes applied in
practice end up in the sludge. In principle the P-content of the sludge can be recovered and
reused which is of increasing relevance for the long term availability of this limited resource.
2.2.2 Chemical-physical P-elimination
The most reliable and most frequently applied removal process is chemical phosphorus
precipitation by addition of metal salts. Dissolved phosphorus is converted to solids which
are removed from the waste water together with the sludge. If very low effluent
concentrations < 0.5 mg TP/l) have to be achieved secondary effluents can be treated by
flocculation filtration.
P-removal by precipitation is based on five processes (ATV DVWK, 2004):
1. Dosing: complete mixing of precipitants (metal cations: Fe
3+
, Al
3+
, Ca
2+
) to waste water
stream
2. Precipitant reaction: Formation of particular compounds as precipitant cations,
phosphate anions and other anions.
Phosphorus in Water Quality and Waste Management
187
3. Coagulation: destabilization of colloids in waste water and coagulation to micro-flocs
4. Co-precipitation and flocculation: Formation of separable macro-flocs. Inclusion of
particulate matter, colloids as well as organic bounded phosphorus in these flocs
5. Separation: By sedimentation, filtration, flotation and a combination of these processes,
macro-flocs will be separated.
The elimination of phosphorus is based on the precipitation of the negative charged
dissolved phosphate (PO
4
3-
) by a trivalent metal ion. Sources of these metals are ferric and
ferrous chloride, ferrous chloride sulphate, ferrous sulphate, aluminium sulphate sodium
aluminate. Except the last one which is alkaline all the other precipitants are acid. Phosphate
compounds as FePO
4
and AlPO
4
with very low solubility product will be formed (pK
L
~ 22).
Iron and aluminium have nearly the same effect, but the optimum pH for iron is about one
unit lower than for aluminium. Iron-flocs have a higher density are more compact and more
shear resistant than aluminium-flocs. These properties influence the separation process
especially if pre- and post-precipitation processes are applied. With both metal ions PO
4
-P
effluent concentrations ≤ 0.1 mg/l can be achieved if dosage is sufficiently high.
Me
3+
+ PO
4
3-
-> MePO
4
(1)
Theoretically one mole of Fe or Al is needed to precipitate one mole of P. Due to the
different atomic weight of the atoms, the appropriate mass dosage needs to be calculated
based on the molar weights (1 Mol P: 31 g; 1 Mol Fe: 56 g; 1 Mol Al: 27 g). The specific
precipitant dosage (β-value) is the molar ratio between precipitant and phosphorus to be
precipitated as e.g. described above for simultaneous precipitation.
=
(2)
But iron- and aluminium-ions also react with other compounds therefore more precipitants
have to be added than theoretically necessary. With a chemical addition corresponding to a
β-value of 1.5 an effluent PO4-P concentration below 0.5 mg/l (TP < 1 mg/l) can be
achieved with simultaneous precipitation at activated sludge plants. Figure 4 is based on TP
effluent data of full scale municipal treatment plants. It shows the relation between TP
effluent concentrations and the β-factor applied for different P-removal techniques. As
mentioned above satisfying P-effluent concentrations need a higher dosing of metal salts
than derived from stoichiometry only. To precipitate 1 kg P theoretically 1.8 kg of iron
(56/31) and 0.9 kg (27/31) aluminium are necessary (β-value of 1). For simultaneous
precipitation it has to be considered that part of the phosphorus will be incorporated into
the sludge and therefore needs not to be precipitated. For rough calculations it can be
assumed that this incorporated phosphorus at least corresponds to ~ 1 % of the BOD
5
- load
in the influent to the biological treatment (e.g. 0.6 g P/PE
60
). If enhanced biological P-
removal occurs the precipitant requirement can only be derived from the operational
experience on site based on effluent monitoring.
Crystallisation processes
By precipitation with calcium cations manifold reactions are known, which are hard to
predict. High P-removal efficiency can be achieved at pH controlled crystallisation of
calcium hydroxyapatite which has a very low solubility product (pK
L
~ 59). PO
4
-P
concentrations below 0.1 mg/l can be achieved depending on the dosage.
5Ca
2+
+ 3PO
4
3-
+ OH
-
-> Ca
5
(PO
4
)
3
OH (3)
Integrated Waste Management – Volume II
188
Fig. 4. P-discharge in relation to the β-factor (Nikolavcic et al., 1998)
Phosphate reacts also with magnesium and ammonium forming magnesium-ammonium-
phosphate (MAP, struvite), a precipitation product with low solubility (Schulze-Rettmer,
1991). The precipitation (crystallisation) process is strongly dependent on pH. All the 3
components are present in waste water in low concentrations while in the sludge liquors after
anaerobic digestion even in high concentrations. Uncontrolled MAP-precipitation can cause
operational problems by incrustations of pipes and machine parts at sludge treatment plants.
Normally the precipitation process is limited by the (low) Mg concentrations. Efficient MAP
precipitation can be achieved in a controlled process by dosing Mg salts (see side stream and
crystallisation processes). Depending on the location of the addition of the precipitants at waste
water treatment plants the following techniques can be distinguished (ATV-DVWK 2004):
Main stream processes:
Pre- precipitation (1),
Simultaneous precipitation (2),
Post precipitation with flocculation and sedimentation (3) and
Post precipitation with flocculation filtration (4)
Side stream processes
Sludge liquors
Pre- precipitation (1)
The metal salts are added to the influent of grit chambers or primary clarifiers. The
precipitation product can be separated together with the primary sludge. P-precipitation
results also in additional removal of organic suspended solids which has to be considered
for design and operation of nitrifying and denitrifying treatment plants. Pre-precipitation
has to be continuously controlled according to the influent P-load and for a following
biological treatment P deficiency must be avoid. Especially nitrifying bacteria are sensible to
P-deficiency.
Simultaneous precipitation (2)
This is by far the most frequently applied process in full scale. Precipitants are added to the
influent of the aeration tank, directly into the aeration tank, to the inflow of the secondary
clarifier or to the return sludge. If enhanced biological P-removal is aimed at, the
Phosphorus in Water Quality and Waste Management
189
precipitants are preferably added to the effluent of the aeration tank in order to avoid
competition between biological and chemical P-removal. In such a case divalent iron salts
(e.g. ferrous sulphate) cannot be used because they have to be first transformed to trivalent
iron by oxidation. Divalent salts should only be added to the aerated volume of the tanks.
The precipitation products are removed together with the excess sludge. The increase of the
inorganic fraction of the excess sludge has to be considered for the design but this has only a
low relevance if P-free detergents are applied in the catchment. With simultaneous
precipitation P-effluent concentrations of ≤ 0.5 mg TP/l can be achieved if the dosage of
precipitants is adequate (β-value see capita 2.2.2). At the dosing points good mixing
conditions have to be ensured (high turbulence).
The access of iron salt is precipitated as Fe(OH)
3
and stored in the activated sludge. At
higher phosphorus loads this iron storage is able to precipitate surplus phosphorus. Thus
control of the dosage is much simpler than at pre or post precipitation.
Post precipitation with sedimentation (3)
This P-removal process normally is only applied as a polishing step after biological
treatment with P-removal in order to achieve TP concentrations below 0.5 mg/l. All these
processes have to concentrate on the retention of particulate material as bacterial flocs and
fine precipitation products containing phosphorus. The dissolved P fraction in the treated
effluent depends on the chemicals used, the dosage related to the P-load and the
environmental conditions (pH, T). For particle separation flocculants are added which
allows removing the precipitation products by sedimentation. In order to improve the
removal efficiency sludge can be recycled to the flocculator where gentle mixing is applied.
Post precipitation with flocculation filtration (4)
The only important differences to the process described above consist in particle separation
after flocculation by rapid sand filtration and in the future probably by membrane filtration.
Fig. 5. Physical- chemical P-elimination
Effluent TP concentrations ≤ 0.1 mg/l can be achieved. It has to be stressed that the specific
cost for the post precipitation processes (€/kg P removed) are much higher than for the in-
stream processes described earlier.
For all the processes the effluent concentrations of dissolved PO
4
-P are depending on type of
chemicals used, β-value applied, pH and temperature. The percental removal efficiency
strongly depends on the P-influent concentration. Applying the same β-value the removal
efficiency will decrease with decreasing influent concentrations. For the TP effluent
Integrated Waste Management – Volume II
190
concentration particle removal efficiency and the fraction of complex phosphorus
compounds which cannot be precipitated (e.g. phosphonic acids) in the influent is decisive.
2.2.3 Biological phosphorus removal processes
P-removal by normal-uptake of bacteria
Microorganisms need phosphorus for their growth i.e. the excess sludge production. P-
removal from the waste water therefore is a necessary side effect of conventional biological
waste water treatment, depending on the specific sludge production per unit of organic
pollution (e.g. population equivalent of 120g COD/(PE*d). An average P-removal of 0.6 to 1
g P/(PE*d) can be achieved with bacterial growth only. Microorganisms are able to store
phosphorus in order to survive periods with phosphorus deficiency. This is not relevant in
municipal waste water treatment plants, where there is a continuous excess of P in the waste
water. At plants treating P-deficient industrial waste waters this ability of bacteria has to be
considered for an adequate control strategy for the P-dosage (Svardal, 1998).
P-removal by luxury-uptake of bacteria
Luxury uptake is performed by phosphorus accumulating organisms (PAO) able to store
phosphorus up to ≥ 5 % of their dry weight if process configurations are applied which
increase the competitiveness and survival probability of PAOs in biological treatment
plants. The main characteristic of this process is to subject the microorganisms to alternating
anaerobic and aerobic (anoxic) conditions. With this process phosphate storing
microorganisms are enriched in the system (Barnard, 1975; Ludzak, 1972; Nicolls, 1972;
Levin, 1965).
Process description:
Anaerobic conditions are characterized by the absence of dissolved oxygen (DO = 0 mg/l)
and oxidized forms of nitrogen (nitrate and nitrite) and the presence of biodegradable
material causing an oxygen demand. Under anaerobic conditions PAOs are not able to grow
but can accumulate and store organic substrate by converting organic acids to poly-hydroxy
butyrate (PHB) and similar energy rich organic compounds. For this process the bacteria
need energy which they gain under anaerobic conditions from the conversion of stored
energy rich poly-phosphate to dissolved phosphate which is released to the water under
these conditions.
The substrate storage process under anaerobic conditions is controlled by the energy stored
in the bacteria in the form of polyphosphates. The “poly-phosphate energy battery” is
recharged under anoxic or/and aerobic conditions where PAOs use part of the energy
gained from the aerobic degradation of the organic carbonaceous pollution.
The excess sludge withdrawn from or after the aerobic (anoxic) zone contains the stored
polyphosphate load which increases the P-removal from the waste water via the excess
sludge. Dry solids of conventional activated sludge have a TP contents of 1 - 1.5 %, while
those of enhanced biological P removal plants can achieve up to > 4 % TP.
As substrate availability in the aeration tank is low the growth rate of the bacteria is low due
to substrate limitation (low effluent concentration). Under such conditions PAOs gain an
increased competitiveness as they can additionally grow using the stored accumulated
substrate. The best indicator for P luxury uptake in an activated sludge plant is the increase
of the dissolved phosphate load in the anaerobic tank (figure 3).