Integrated Waste Management Volume II Part 7 pdf
Bạn đang xem bản rút gọn của tài liệu. Xem và tải ngay bản đầy đủ của tài liệu tại đây (843.05 KB, 35 trang )
Phosphorus in Water Quality and Waste Management
201
insufficiently investigated. Depending on their properties the substances can have
genotoxic/immunotoxic/neurotoxic, carcinogenic and endocrine impact on living
organisms (Gangl, 2001). Table 8 shows different micro-pollutants of concern:
Organic pollutants AOX, LAS, PAH, PCB, PCDD/F, DEHP, HC, NPE
Pharmaceutical substances Antibiotics, endocrine hormonal drugs, psychotropic
drugs, cytostatic
Table 8. Micro-pollutants in waste water and sewage sludge
Up to now there are no scientific reports on negative effects on agriculture and food if
controlled sludge application on land is used even for decades in several regions. Whether
they represent a long term risk for humans and the environment it is still a matter of
scientific research and discussion.
2.4 Recovery, treatment and disposal of sewage sludge
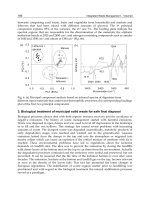
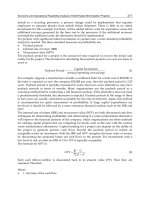
The following figure shows the current situation of sewage sludge recovery, treatment and
disposal in Europe and North America (Emscher Lippe, 2006; WEF, 2011; CCME, 2011).
Fig. 18. Sewage sludge recovery, treatment and disposal in the EU and North America
2.4.1 Direct land application
Direct application of sludge in agriculture is closing the nutrient cycle especially for
phosphorus. Sewage sludge contains also valuable other nutrients (nitrogen), organic matter
and many macro- and micronutrients which are essential for plant growth.
Use of stabilised sewage sludge on land
The use of stabilised sewage sludge on agricultural land has a long tradition and is subject to
strict legal requirements for quality control, monitoring and documentation (see section 1).
Especially for small treatment plants in rural areas this method represents an easy and
economically favourable solution for P-recycling. For national agriculture use of sludge in
agriculture is of of low economic relevance (Kroiss et al., 2007). For farmers able to substitute
mineral phosphorus fertiliser free of charge by sewage sludge this is economically interesting
Integrated Waste Management – Volume II
202
(Kroiss, 2005). For the treatment plants it has the important consequence that a sludge storage
capacity for up to 6 months has to be provided, as during wintertime fertilising is not allowed.
For large treatment plants the main problem of this disposal route is the restricted reliability
(legislation, public perception) as well as increasing costs for storage and transport.
Sludge can be composted if additional carbonaceous material (e.g. wood chips) is added.
The compost can be applied in agriculture and for landscaping as it is possible for sludge
depending on national regulations. If sludge or compost made of sludge is used for
landscaping in most of the cases the area specific phosphorus dosing is much too high as
compared to the uptake if relevant area specific mass of organic material is applied. This is
detrimental for P-resource protection and may contribute to eutrophication by erosion
products. In EU15 currently 40 % of sewage sludge produced (4 Mio t/a) are directly
applied in agriculture. 17 % are used for recultivation. In North America 61 % (4.6 Mio t/a)
were applied on land.
Problematic of harmful substances
In principle the application of sewage sludge can cause an increase of heavy metals in
soils if removal by harvesting and washout is lower than supply. There is continuous loss
of HM via surface runoff, intermediate runoff and the ground water which is very
difficult to quantify due to the limited analytical and sampling accuracy. Numerous
studies show, that the accumulation of heavy metals is very low as the dilution factor of
sludge in the top soil is in the order of 1:5000 up to 1:10.000 if sludge is applied according
to modern legal requirements. Only monitoring with sophisticated sampling procedures
over several decennia can prove an accumulation. Heavy metal loading of soils has
therefore to be monitored in order to avoid potential risks which are different for several
metals (VDLUFA, 2001).
heavy
metal
soil protection
plant nutrition,
quality of food plants
risk
increase of
soil content
mobility
Cd possible high endangered high
Pb, Cr,
Ni, Hg
possible minimal not endangered medium
Cu, Zn
possible, welcome
by fertiliser need
Cu low,
Zn high
encouraged by fertiliser needs,
otherwise no risk
low
Table 9. Assessing heavy metals concerning their possible risk
Plants have “root barriers” which inhibit or even stop the uptake of certain heavy metals
(Pb, Cr, Ni, Cu, Hg) and many organic micro-pollutants. With the exception to Cd and Zn,
plants are protected concerning the uptake of high concentration of these substances. Zn is
also an important trace element for plant growth and human nutrition, Cd concentration in
much sludge from Central European and also US treatment plants has dropped below the
soil standards.
Soils contain the most versatile natural microbial communities with high performance
potential in mineralizing organic substances, even so called persistent harmful substances as
PCB and PCDD as could be verified by research Also the adsorption potential as very high
Phosphorus in Water Quality and Waste Management
203
due to the extremely large surface area. As a consequence the controlled application of
sewage sludge on land does not result in acute risks, long term risks by accumulation can be
avoided by adequate monitoring. Sludge is not the only pathway for micro-pollutants to the
soils (air pollution, precipitation).
2.4.2 Incineration and P-recovery
A process enabling P recovery of phosphorus is the incineration of sewage sludge in mono-
incineration plants. All organic compounds will be destroyed, while phosphorus and the
heavy metals are transferred to the ash. The direct application of this ash to agricultural fields
is still a matter of discussion. The availability of P in the ash is restricted. The main goals of
new P-recovery technologies are on the one hand the elimination of pollutants and on the
other hand making phosphorus available to plants. Currently there are only few technologies
available which meet both requirements, but they are still not ready for market introduction.
The following technologies for P-recovery from ash are reported in literature: ASH DEC,
PASCH, Mephrec and ATZ Eisenbadreaktor (Mocker and Faulstich, 2005). An immediately
applicable option could be to store the P-rich ash in a monofill for future recovery The use of
mono-incineration ash for construction material or its dumping in landfills together with other
waste should be avoided as phosphorus recovery will be disabled.
2.4.3 Incineration without P-recovery
Because of the relatively high calorific value (11 - 17 MJ/kg) of dried sewage sludge,
comparable to brown coal and therefore used in the cement industry, in coal power plants
but also in ordinary municipal waste incineration plants. Dried sewage sludges are used in
the cement industry, in coal power plants but also in ordinary municipal waste incineration
plants. In these processes all organic compounds will be destroyed completely, but the
valuable nutrients as P cannot be recovered. End products ash bottom as and fly ash with
low content of pollutants can be used as a construction material or get landfilled. Pollutant
rich filter cake need to be disposed of in underground disposal facilities.
2.4.4 Landfilling
In Europe and North America about 2.5 Mio tons of sewage sludge are currently dumped in
landfills. This causes gaseous emissions as CH
4
and CO
2
from these landfills, which are
climate relevant. Phosphorus in this dumped sewage sludge is lost irretrievable. European
landfill legislation therefore requests a continuous reduction of organic material to be put
to landfill, with the goal to completely stop it in the near future. Several central European
countries have already banned landfill disposal of organic matter in the past (Germany,
Austria).
2.4.5 Possibilities of P-recovery from sewage sludge
Due to the pollutants contained in sewage sludge a great number of research and
development projects have been started to recover phosphorus fertiliser with low pollution
from the sludge, in order to meet the same quality standards as for market fertilisers. Most
of the processes described below have not proved economic viability up to now, some of
them are still lacking full scale experience.
Processes with precipitation
There are three main processes to recover phosphorus fertiliser with low pollution levels
and high plant availability from sewage sludge. Enhanced biological P-elimination without
Integrated Waste Management – Volume II
204
or low use of precipitants during the waste water treatment process is advantageous for
working-recovery by precipitation from the sludge. In sewage sludge phosphorus is bound
to several organic and inorganic solids. By changing the pH using acids, phosphorus can be
brought into solution. Particulate matter will be separated and the pH is increased to about
8.5 by adding alkalinity. If e.g. MgCl is used as precipitant for MAP a fertiliser rich in
phosphorus with high plant-availability and low heavy metal content will be produced.
(Airprex, Seaborne, Stuttgarter Verfahren)
Wet oxidation process
During the wet oxidation process the organic fraction of sewage sludge is oxidized with
pure oxygen at super-critical conditions (pressure > 221 bar, T > 374 °C). Phosphorus
concentrates in a highly reactive form and will be extracted by precipitation with calcium
hydroxide. (Aqua Reci)
Thermal hydrolysis with following precipitation
Sewage sludge will be heated under pressure up to 140 C and treated with sulphuric acid to
reach a pH of 1 - 3. Part of the inorganic material dissolves and is separated from the
particulate matter. By increasing the pH in the liquid phase phosphorus is precipitated by
adding iron salts. The plant availability of P is comparable to simultaneous precipitation.
(KREPRO)
2.4.6 Discussion
The direct application of sewage sludge on land is a well-established method of nutrient
and organic substance recovery. The sludge treatment processes applied (storage,
dewatering, drying) have to be adapted to the specific local situation including the legal
requirements for, monitoring and reporting and the whole logistics. Sludge composting is
also a well-established sludge disposal method. If sludge compost is used according to the
requirements for organic material (land reclamation or soil conditioning in agriculture
normally the P-addition is much higher than plant uptake which is detrimental for P-
recovery and eutrophication abatement. The relevance of the potentially harmful
substances in the sewage sludge applied on land for long term soil protection and related
health effects are still a matter of research and discussion. It finally can only be solved by
a political agreement on an acceptable risk at acceptable costs. The processes to recover
phosphorus from sewage sludge with a quality as market fertilisers with new
technologies, as described in section 1.4.1, use large quantities of chemicals (acids, bases)
and energy. The remaining waste fraction after phosphorus extraction still contains
potentially harmful compounds and will have to be disposed or reused. Currently these
technologies are not competitive economically. Incineration is applied to recover the
energy contained in the organic fraction of the sludge. During incineration micro-
pollutants are destroyed and phosphorus is concentrated in the ash if mono-incineration
of sludge is applied. Co-incineration of sludge with coal (power plants) or solid waste
therefore should not be used in the future, the same is with sludge incineration in cement
factories. Whether the ash of mono-incineration plants can directly be applied on land (P-
contents similar to market fertiliser) is still a matter of discussion because of the heavy
metal content and the reduced P-availability.
Sludge from nutrient removal plants with bio P and/or aluminium P-precipitation can be
used as raw material for phosphate fertiliser industry (Schipper et al., 2004)
Phosphorus in Water Quality and Waste Management
205
3. Phosphorus in waste management
Vegetable and animals wastes contain significant quantities of phosphorus. Major sources
for such wastes are agriculture, the food processing industry and private households.
3.1 Private households
The average P-content in mixed household waste is reported with 0.9 g P/kg fresh mass
(FM) in Schachermayer et al. (1995) and 1.4 g P/kg FM in Skutan & Brunner (2006). This
translates into a P-load of 190.000 to 300.000 tons/a for the EU15. The proportion
of organic waste at the whole municipal solid waste generation is up to 35 %. In EU15 this
corresponds to 75 Mio tons every year and a P-load of about 150.000 (Figure 19). Thereof
only about 30 % or 22 Mio tons are collected separately. This separately collected organic
waste fraction consists of kitchen- and garden waste from households and park-
and garden waste from public area. The current waste treatment options are shown in
Figure 19.
Fig. 19. a) MSW generation in households; b) Waste treatment of biowaste (Arcadis
Eunomia, 2010)
Taking the loss of composting into account, 11 Mio tons of compost can be generated and
therefore 50.000 tons of phosphorus can be recovered every year at current collection rates.
The potential amount is ca. three times higher under real conditions. If this potential can be
exploited, up to 150.000 tons P could be recovered from biowaste annually. In Europe
approximately 50 % of the produced composts are applied on agricultural fields. The
remaining quantities are used in landscaping, gardens or in humification processes. Another
appropriate treatment for organic waste, especially pasty wastes is anaerobic fermentation.
The resulting biogas slurry can be used as an organic fertiliser.
3.2 Food industry (vegetable and animal waste)
The amount of organic waste generated by manufactures of food products, beverages and
tobacco products is about 150 kg per habitant and year in Europe (EU15) (Oreopoulou, 2007;
EU STAT, 2011). This corresponds to a total of 59 Mio tons. Because of the heterogeneity of
these wastes the P-recovery potential is difficult to determine. Under the assumption of an
average phosphorus concentration of 0.5 %, the recovery potential of vegetable and animal
waste is about 290.000 t/a. Due to the high P-concentration, especially in bones and teeth,
animal wastes contain most of the phosphorus load from the food industry. Waste from
slaughtering and meat processing are treated in animal cadaver utilization plans. Therefore
Integrated Waste Management – Volume II
206
annually approximately 9 kg (Nottrodt, 2001; ASH DEC, 2008) of carcass meal emerge per
inhabitant in Europe. Related to all inhabitants in the EU15 3.5 Mio tons of carcass meal
arise every year. Calculated with a P-concentration of about 5 to 6 % the recovery potential
is approx. 200.000 tons of phosphorus. This P-load corresponds to about 70 %of the total
wastes from food industry.
3.3 Ash from energy wood
According to the statistics of EU STAT, 60 Mio tons (dry matter) of energy woods like
firewood, wood chips and wood residues (including pellets) are used as alternative energy
source. With an assumed ash content of 1.5 % and a P-concentration in ash of 1.2 % a
potential P-load of 10.000 tons/a can be calculated.
3.4 Steal production
In steel production P is viewed as harmful to the production of high-quality steel. P occurs
in coal, iron ore, and limestone, which are the main raw materials for iron making. During
the steelmaking process P is transferred from the molten pig iron to the slag. Yoon and Shim
(2004) report P concentrations in dephosphorization slag of 1 - 3 % (P
2
O
5
). Jeong et al. (2009)
demonstrate the potential of such slag for P recovery by a P balance for South Korea where
they show that steelmaking slag contains about 10 % of the domestic P consumption. They
argue that technologies to recover this waste flow could substantially reduce the
dependence on imports of phosphate rock.
3.5 Recovery processes for organic waste
3.5.1 Composting
The main treatment option of separately collect organic waste in households is composting.
During this aerobic treatment process, the organic fraction gets stabilized through microbial
decay and volume and mass are reduced while the concentration of nutrients increases.
Composting requires three key activities: aeration (by regularly turning the compost pile),
moisture, and a proper carbon to nitrogen (C:N) ratio. A ratio between 25:1 and 35:1 is
generally considered as optimal.
3.5.2 Biogas plants
Biogas plants are a well-known technology to transform organic wastes into a useful
fertiliser, to gain electricity and thermal energy from them and to increase their nutritive
characteristics. Through biologic decomposition under anaerobic conditions methane
bacteria produce biogas. The methane is used for combustion either in a gas motor or
combined heat and power plant to produce electricity and heat (e.g. for district heating). The
resulting biogas slurry can be used as an organic fertiliser.
3.5.3 Thermal treatment
Utilization of carcass meal as animal feed has been banned as a consequence to the BSE
crisis and therefore most of the carcass meal is utilized as a substitute fuel in the industry
(mainly in cement kilns and coal-fired power plants). This treatment does not allow a
recovery of phosphorus since it is either diluted in the product (cement) or in the coal ash. A
possibility could be the co-incineration with sewage sludge in mono-incineration plants and
recovering phosphorus from ash (Driver, 1998).
Phosphorus in Water Quality and Waste Management
207
3.5.4 Conclusion
The present amount of organic waste from households and food production waste will not
change significantly. But there is additional P-recovery potential concerning the separately
collected organic waste. By tapping these potential the amount of P could theoretically rise
from 50.000 to approx. 150.000 tons of P. In the sector of food production the recovery
(anaerobic and aerobic treatment, fodder) is nearly 100 % and therefore there is no
additional potential. As demonstrated in section 3.2, phosphorus is highly concentrated in
animal wastes, but the present treatment (mainly incineration without P-recovery) does not
allow using the possible P-quantities of over 200.000 t. Mono-incineration would allow the
future recovery of the containing phosphorus if the ashes are stored in monofills. The
potential phosphorus in ashes from energy wood is not practical for the production of a
secondary P fertiliser because of the low phosphorus amount and the decentralized
occurrence of these ashes. However, these ashes can be applied directly to the soil if the
contents of heavy metals are moderate.
4. Scenario evaluation for European P-management
Figure 20a shows a simplified P-balance for the EU15. The dominating process is
“agriculture” consuming 1.9 Mio t of P per year. Less than 0.4 Mio t/a of it reach the
consumer (“Household”), showing that the P-chain is characterized by low efficiency and
large losses such as accumulation of P in soils and landfills, losses to the hydrosphere by
erosion, leaching, and waste water discharges. Figure 20b shows a partly optimized system,
where the following adjustments or assumptions are made:
Integrated Waste Management – Volume II
208
Fig. 20. Simplified phosphorus balance for the EU15: a) current situation (average year in the
period 2005-2008); b) optimized scenario
50 % erosion reduction by implementing an efficient erosion abatement strategy for
Europe
mono-incineration of contaminated sewage sludge combined with carcass meal and
production of a P-fertiliser from the ash
no ocean dumping of sludge (already forbidden)
85 % P removal at all waste water treatment plants
the amount for sewage sludge recycled in agriculture is maintained
The result as shown in Figure 20b is that losses to landfills and the hydrosphere are reduced
significantly (-69 % and -60 %, respectively) and the import of P to the EU15 decreases by
45 %. Such scenarios show that there is considerable potential to optimize P management
whereby optimization is a mixture of the implementation of new technologies and
management practices in agriculture and waste management.
5. References
Austermann-Haun, U.; Lange, R., Seyfried, C.F. & Rosenwinkel, K.H. (1998). Upgrading an
anaerobic/aerobic wastewater treatment plant, Water Science and Technology 37/9, pp.
243-250.
Phosphorus in Water Quality and Waste Management
209
Arcadis-Eunomia (2010). Assessment of the options to improve the management of bio-waste in
the European union – Final Report, European Commission Directorate-General
Environment.
ATV-DVWK (2004). "Arbeitsblatt ATV-DVWK-A 202 Chemisch-physikalische Verfahren zur
Elimination von Phosphor aus Abwasser."
ATV (1997). ATV-Handbuch: Biologische und weitergehende Abwasserreinigung - 4. Auflage
1997, Abwassertechnik Vereinigung, Ernst & Sohn.
Baccini, P. & Brunner, P.H. (1991). The metabolism of the anthroposphere, Springer, New York.
Barnard, J.L. (1974). Cut P and N without chemicals, Water Wastes Eng. 11, pp. 33-36 and pp.
41-44)
Barnard, J.L. (1976). A review of biological phosphorus removal in the activated sludge process,
Water SA. 2, pp. 136 – 144.
BAWP (2009) Bundesabfallwirtschaftplan, Bundesministerium für Land- und Forstwirtschaft,
Umwelt und Wasserwirtschaft Abteilung VI/3. Wien.
Bischof, F. & Paris, S. (n.d). New aspects for waste water treatment after urine separation,
University of Applied Sciences, Department of Environemental Engineering.
Amberg.
Blume, H. P.; Brümmer, G. W.; Horn, R.; Kandeler, E.; Kögler-Knabner, I.; Kretzschmar, R.;
Stahr, K. & Wilke, B. M. (2010). Scheffer/Schachtschabel - Lehrbuch der Bodenkunde, 16.
Auflage. Spektrum Akademischer Verlag.
Böhm, R. (2006). Seuchenhygienische Anforderungen an organische Düngemittel - Schwerpunkt
kommunale Klärschlämme, Präsentation, BMU-Fachtagung „Perspektiven der
Klärschlammverwertung - Ziele und Inhalte einer Novelle der
Klärschlammverordnung“ am 06 07. Dezember 2006 in Bonn.
Brunner, P.H.; Capri, S.; Marcomini, A. & Giger, W. (1988). Occurrence and behaviour of linear
alkylbenzenesulphonates, nonylphenol, nonylphenol mono- and dieth-oxylate in sewage and
sewage sludge treatment, Water Research, 22, pp. 1465-1472.
Burke, R.; Dolb, P.L. & Marais, G. (1986). Biological excess phosphorus removal in short sludge
age activated sludge, Research Report No. W58, University of Cape Town. S.A.
CCME (2011). Canadian Council of Ministers of the Environment,
Chaudri, A.M.; Lawlor, K.; Preston, S.; Paton, G.I.; Killham, K. & McGrath, S.P. (2002).
Response of a Rhizobium-based luminescence biosensor to Zn and Cu in soil solutions from
sewage sludge treated soils, Soil Biology and Biochemistry, 32, pp. 383-388.
CEC – Commission of the European Community Council (1986). Directive 12 on the
protection of the environment, and in particular soil, when sewage sludge is used in
agriculture. Official Journal of the European Community, No. L181 (86/278/EEC),
pp. 6-12.
Cecchi, F. (2003). Phosphate Cristallisation Process for P-Recovery applied at Treviso Municipal
Wastewater Treatment Plant (Italy), Università degli Studi di Verona.
Cordell, D.; Drangert, J.O. & White, S. (2009). The story of phosphorus: Global food security and
food for thought, Global Environmental Change 19, pp. 292-305.
De-Bashan, L. & Bashan, Y. (2004). Recent advances in removing phosphorus from wastewater and
its future use as fertiliser (1997–2003). Water Research 38 (2004), pp. 4222-4246.
Integrated Waste Management – Volume II
210
Driver, J. (1998). Phosphates recovery for recycling from sewage and animal wastes, Phosphorus &
Potassium, Issue No: 216.
-
darmstadt.de/index.php?option=com_content&task=view&id=46&Itemid=1
EFMA (2000). Understanding phosphorus and its use in agriculture – phosphorus. Essential
Element for Food Production, European Fertiliser Manufacturers’ Association
(EFMA), Brussels, Belgium (in German: thermal treatment of sewage sludge: co-
incineration, bulletin DWA-M 387, draft May 2009).
Engelhart, M.; Kruger, M.; Kopp, J. & Dichtl, N. (2000). Effect of disintegration on anaerobic
degradation of sewage excess sludge in downflow stationary fixed film digesters, Water Sci.
Technol., 41, pp. 171-179.
EUROSTAT (2010). Generation of waste by waste category. Statistical data of the European
Commission,
EUROSTAT (2010). Waste generation (tons). Statistical data of the European Commission,
EUROSTAT (2010). Roundwood, fuelwood and other basic products, Statistical data of the
European Commission.
FAO (2000). Fertiliser Requirements in 2015 and 2030, Food and Agriculture Organisation of
the United Nations (FAO), Rome, Italy.
Gangl, M.; Sattelberger, R.; Scharf, S. & Kreuzinger, N. (2001). Hormonell wirksame Substanzen
in Klärschlämmen, Monographie, Band 136, Umweltbundesamt. Wien.
Gaskin, J.W.; Robert, B.B.; Miller, W.P. & Tollner, E.W. (2003). Long-Term biosolids application
effects on metal concentrations in soil and bermudagrass Forage, J. Environ. Qual. 32, pp.
146 - 152.
Giam, C.S.; Atlas, E.; Powers Jr., M.A., & Leonard, J.E. (1984). Phthalate esters, In: Hutzinger,
O. (Ed.), Anthropogenic Compounds. Springer-Verlag, Berlin, Heidelberg,
Germany, pp. 67–142.
Giesen, A. (2002). The Crystalactor® – Abwasserbehandlung mittels Kristallisation ohne Abfälle,
DHV Water BV, Amersfoort, The Netherlands. Link: www.dhv.com.
Giller, K.E.; Witter, E. & McGrath, S.P. (1998). Toxicity of heavy metals to microorganisms and
microbial processes in agricultural soils: a review, Soil Biol. Biochem., Vol 30, No. 10/11,
pp. 1389-1414.
Giger, W.; Brunner, P.H. & Schaffner, C. (1984). 4-nonylphenol in sewage sludge: accumulation
of toxic metabolites from non-ionic surfactants, Science, 225, 1984, pp. 623-625.
Gutser, R. (1996). Klärschlamm und Biokompost als Sekundärrohstoffdünger, VDLUFA-
Schriftenreihe, Kongreßband 1996, 44, pp. 29-43.
Harold, F. M. (1966). Inorganic polyphosphates in biology structure, metabolism and function,
Bacteriological Reviews 89: pp. 772 - 794.
Henke, U. (2001). Auswertung des Klärschlammkatasters für die Jahre 1997 bis 1999, Fachberichte
aus dem Untersuchungswesen, Schriftenreihe der TLL.
Henze, M.; Loosdrecht, M.V.; Ekama, G. & Brdjanovic, D. (2008). Biological Wasterwater
Treatment - Principles, Modelling and Design, IWA Publishing.
Herring, J.R. & Fantel, R.J. (1993). Phosphate rock demand into the next century: Impact on world
food supply, Nonrenewable Resources (2)3, pp. 226-246.
Phosphorus in Water Quality and Waste Management
211
Janssen, P.M.J.; Meinema, K. & Van Der Roest, H.F. (2002). Biological Phosphorus Removal
Manual for Design and Operation, IWA Publishing ISBN: 9781843390121, 224 pages
Jasinski, S. (2010). 2008 - Minerals Yearbook, Phosphate Rock (advanced release)
Jeong, Y-S.; Matsubae-Yokoyama, K.; Kubo, H.; Pak, J-J. & Nagasaka, T. (2009). Substance
flow analysis of phosphorus and manganese correlated with South Korean steel industry;
Resources, Conservation and Recycling; 53, pp. 479-489.
Joikinen, R. (1990). Effect of phosphorous precipitation chemical on characteristics and agricultural
value of municipal sewage sludges. Part 3. Analytical results of sludge treated soils, Acta
Agric. Scand. 40, pp. 141–147.
Kratz, S. & Schnug, E. (2006). Rock phosphates and P fertilisers as sources of U contamination in
agricultural soils, In: MERKEL, B.J., HASCHE-BERGER, A. (eds.), Uranium in the
environment: mining impact and consequences, Springer, Berlin Heidelberg, pp.
57-68.
Kratz, S.; Diemer, K.; Fleckstein, J.; Rienitz, O.; Schiel, D. & Schnug, E. (2007). Fingerprinting
the origin of rock phosphates with special regard to U and Sr isotope ratios, Proceedings of
the 9th Dahlia Greidlinger Symposium, Grand Water Research Institute, Technion-
Israel Institute of Technology, March 12-13, Haifa.
Krogstad, T.; Sogn, T.A.; Asdal, A. & SAEBO, A. (2005). Influence of chemically and biologically
stabilized sewage sludge on plant-available phosphorous in soil, Ecological Engineering
25, pp. 51-60.
Kroiss, H. (2004). What is the potential for utilizing the resources in sludge? Wat. Sci. & Tech. 49
(10) pp 1–10
KROISS, H. & ZESSNER, M. (2007). Ecological and Economical Relevance of Sludge Treatment
and Disposal Options, IWA Conference on “Moving Forward Biosolids
Sustainability”, June 24 to 27, Moncton, Canada.
Kunst, S. (1991). Untersuchung zur biologischen Phosphoreliminierung im Hinblick auf ihre
abwassertechnische Nutzung, Veröffentlichung des Institutes für
Siedlungswasserwirtschaft und Abfalltechnik der Universität Hannover, Heft 77,
Hannover 1991.
Lemmer, H.; Griebe, T. & Flemming, H.C. (1996). Ökologie der Abwasserorganismen, Springer-
Verlag Berlin Heidelberg New York.
Levin, G. V. & Shapiro, J. (1965). Metabolic uptake of phosphorus by wastewater organisms, Water
Pollution Control Journal 37, pp. 800 - 821.
LFU (2003). Schadstoffe in Klärschlammgedüngten Ackerböden Baden-Württembergs,
Landesanstalt für Umwelt, Messungen und Naturschutz Baden-Württemberg.
Maderner, W.; Schachermayer, E.; Bauer, G.; Ritter, E. & Brunner, P.H. (1995). Messung der
Güter- und Stoffbilanz einer Müllverbrennungsanlage, Monographie Band 56,
Bundesministerium für Umwelt.
Matsché, N. (1989). Phosphorentfernung, In: Kroiss, H. (1989). Wiener Mitteilungen Wasser
Abwasser Gewässer, Band 81. Fortbildungskurs biologische Abwasserreinigung
des ÖWAV vom 27.2 - 1.3.1989. Wien.
Integrated Waste Management – Volume II
212
Moriyama, K.; Kojima, T.; Minawa, Y.; Masumoto, S. & Nakamachi, K. (2001). Development of
artificial seed crystal for crystallization of calcium phosphate, Environ. Technologies 22,
pp.1245–1252.
Nikolavcic, B.; Zessner, M. & Nowak, O. (1998). Maßnahmen zur Phosphorentfernung, In:
Kroiss, H. (1998) Wiener Mitteilungen, Band 145, pp.205-259. Institut für
Wassergüte. TU Wien.
Nottrodt, A. (2001). Technische Anforderungen und allgemeine Empfehlungen für die Entsorgung
von Tiermehl und Tierfett in Verbrennungsanlagen, Im Auftrag des
Bundesministeriums für Umwelt, Naturschutz und Reaktorsicherheit
Nowka, O.; Wandl G. & Svardal K. (1999). Long-term experience with biological pretreatment of
rendering plant effluent, Wat. Sci. Tech. 40 (1), pp 37-44.
Oreopoulou, V &, Russ, W. (2007). Utilization of by-products and treamtment of waste in food
industry, Springer.
OEWAV (2004). Regelblatt 17. Landwirtschaftliche Verwertung von Klärschlamm, Österrr.
Wasser- und Abfallwirtschaftsverband (.)
Pathak, A.; Dastidar, M.G. & Sreekrishnan, T.R. (2009). Bioleaching of heavy metals from sewage
sludge: A review, Journal of environmental management 90, pp. 2343-2353.
Petruzzelli, D. (2003). A new phosphate-selective sorbent for the Rem Nut® process. Laboratory
investigation and field experience at a medium size wastewater treatment plant. Water
Science & Technology 48/1, pp 179–184.
Pinnekamp, J.; Montag, D.; Gethke, K.; Goebel, S. & Herbst, H. (2007). Rückgewinnung eines
schadstofffreien, mineralischen Kombinationsdüngers „Magnesiumammoniumphosphat –
MAP“ aus Abwasser und Klärschlamm, Text 25/07. Abschlussbericht für das
Umweltbundesamt. Institut für Siedlungswasserwirtschaft RWTH Aachen.
Pradr, D. (2003). Verfügbarkeit und Vermarktung von Roh- und Recyclingmaterial aus der Sicht
der Düngemittelindustrie, In: Tagungsband zum Symposium “Rückgewinnung von
Phosphor in der Landwirtschaft und aus Abwasser und Abfall“,
Umweltbundesamt, Berlin Feb. 6-7, pp. 2/1-5.
Peter, A. & Sarfert, F. (1991). Operation Experiences with Biological Phosphorus Removal at the
Sewage Treatment Plants of Berlin (West), Wat. Sci.Tech. 24, (7), 133–148 ©
Prendl, L. & Nikolavcic, B. (2000). Aerobic treatment of industrial waste water – experiencies with
the dosage of nitrogen and phsophorus, Wat. Sci. Tech. 41 (9), 241-249
Rabinowitz, B. & Marais, G.v.R. (1980). Chemical and biological phosphorus removal in the
activated sludge process, M.A.S.c. thesis, Univ. CapeTown, S.A., Res. Rep. No. W32.
Röhling, S. (2007). Wie lange reichen die Rohstoffe für die Mineraldüngerproduktion noch aus? In:
Rohstoffverfügbarkeit für Mineraldünger – Perspektiven unter hohen
Energiekosten und begrenzten Ressourcen, Tagung des Verbandes der
Landwirtschaftskammer und des Bundesarbeitskreises Düngung, April 24-25,
Würzburg, Germany, 2007.
Röske, I. & Uhlmann, D. (2005). Biologie der Wasser- und Abwasserbehandlung, Ulmer
Stuttgart.
Rosmarin, A. (2004). The Precarious Geopolitics of Phosphorus, Down to Earth, Science and
environment Fortnightly, June 30, pp. 27-31.
Phosphorus in Water Quality and Waste Management
213
Sandaa, R A.; Torvik, V. & Enger, Ø. (2001). Influence of long-term heavy-metal contamination
on microbial communities in soil, Soil Biology and Biochemistry, 33, pp. 287-295.
Schipper, W.J.; Klapwijk A.; Potjer, B.; Rulkens, W.H.; Temmink, B.G.; Kiestra, F.D.G. &
Lijmbach, A.C.M. (2004). Phosphate recycling in the phosphorus industry. Phosphorus
Research Bulletin Vol. 15, pp. 47-51.
Seyhan, D. (2006). Development of a method for the regional management and long-term use of non-
renewable resources, PHD-thesis, Vienna University of Technology.
Sjöström, Å.E.; Colins, C.D.; Smith, S.R. & Shaw, G. (2008). Degradation and plant uptake of
nonylphenol (NP) and nonylphenol-12-ethoxylate (NP12EO) in four contrasting
agriculture soils, Environmental Pollution, In Press.
Skutan, S. & Brunner, P.H. (2006). Stoffbilanzen mechanisch-biologischer Anlagen zur Behandlung
von Restmüll (Projekt SEMBA), Institut für Wassergüte, Ressourcenmanagement und
Abfallwirtschaft. TU Wien.
Spatzierer, G., Ludwig, C. & Matsché, N. (1985). Biological Phosphorus Removal in Combination
with Simultaneous Precipitation, Wat. Sci. Tech. 17, (11-12), 163–176
Sreeramachandran, S. (2006). Feasibility of nitrogen and phosphorous recovery from human urine,
Master Thesis at Hans Huber AG, not public.
Steen, I. (1998). Phosphorus availability in the 21
st
century. Management of a non-renewable
resource, Phosphorus and Potassium, 217, pp. 25-31.
Ueno, Y. (2000). Development of phosphorus resource recycling process from sewage, Paper
presented at the First World Water Congress, International Water Association.
UN (2008). World Population Prospects: The 2006 Revision Population Database, Population
Division of the Department of Economic and Social Affairs of the United Nations
(UN) Secretariat, New York, USA. Available online: <
(accessed 05.07.09).
Van Kauwenbergh, S.J. (1997). Cadmium and other minor elements in world resources of
phosphate rock, Proceedings of The International Fertiliser Society No 400, York, UK.
VDLUFA (2001). Nachhaltige Verwertung von Klärschlämmen, Komposten und
Wirtschaftsdüngern in der landwirtschaftlichen Pflanzenproduktion. Grundlagen zur
Beurteilung möglicher Risiken, Fakten, sachlogische Zusammenhänge und
Positionen. Verband Deutscher Landwirtschaftlicher Untersuchungs- und
Forschungsanstalten. Darmstadt.
Villabla, G.; Liu, Y.; Schroder, H. & Ayres, R.U. (2008). Global phosphorus flows in the industrial
economy from a production perspective, Journal of Industrial ecology, 12 (4), pp. 557-
569.
Vinneras, B (2004). Guidelines on the use of faeces in crop production, EcoSanRes Report 2/2004.
Wagner, M. (2005). Rohphosphat – Verfügbarkeit und Verbrauch, 38. Essener Tagung für
Wasser- und Abfallwirtschaft, Aachen March 11, 2005.
WEF (2011). Water Environment Federation. A Guide to Understanding Sewage sludge
Issues. />8&sourceid=navclient&gfns=1&q=A+Guide+to+Understanding+Sewage
sludge+Issues
Yoon, J.K. & Shim, J.D. (2004). Ferrous metallurgy for specialists, Seoul: Daewoong Pub; 2004.
Integrated Waste Management – Volume II
214
Zessner, M. & Aichinger, K. (2003). Wertstoffe und Schwermetalle im Klärschlamm, In: Kroiss,
H. (2003) Wiener Mitteilungen, Band 184, pp.109-138. Institut für Wassergüte. TU
Wien.
12
Anaerobic Processes for Waste
Treatment and Energy Generation
Melanie Sattler
University of Texas at Arlington
United States
1. Introduction
As global population increases and developing countries industrialize, energy demand around
the world is increasing markedly. World energy consumption is expected to increase by 50%
to 180,000 GWh/year by 2020 (Fernando et al., 2006), due primarily to increases in demand
from rapidly growing Asian countries such as China and India (Khanal, 2008). According to
the Intergovernmental Panel on Climate Change (IPCC, 2007), fossil fuel combustion already
contributes 57% of emissions that cause global warming. Thus, to address future energy needs
sustainably, renewable sources of energy must be developed as alternatives to fossil fuels.
To aid in developing such renewable energy alternatives, environmental scientists and
engineers should consider anaerobic processes for waste treatment as alternatives to aerobic
processes. When aerobic processes are used for waste treatment, the low energy compounds
carbon dioxide and water are formed; much energy is lost to air – about 20 times as much as
with an anaerobic process (Deublein and Steinhauser, 2008). Anaerobic processes produce
products of high energy like methane. Methane can be captured and burned as an energy
source, and used to power gas-burning appliances or internal combustion engines, or to
generate electricity.
Anaerobic processes have been applied for decades in developed countries for wastewater
treatment plant sludge stabilization. In recent years, considerable interest has developed in
use of anaerobic treatment for a variety of other applications, due to the potential to
generate renewable energy. Methane from anaerobic processes is being increasingly utilized
as an alternative energy source in developed countries, via large projects that extract
methane from landfills or wastewater treatment plants. Smaller plants, on the scale of an
individual household or village, can also be a particularly important energy source in rural
sectors of developing countries; transportation costs in these locations may limit use of fossil
fuels, and lack of cheap and adequate energy hampers rural development. When generated
from biomass, especially at a small scale, methane is often called biogas (FAO, 1984;
Deublein and Steinhauser, 2008).
In addition to providing a renewable source of energy, anaerobic processes provide some of
the simplest and most practical methods for minimizing public health hazards from human
and animal wastes – pathogens are destroyed or greatly reduced. Anaerobic processes have
been proven for treatment of a variety of organic wastes: solid wastes at landfills, industrial
wastewater, human excrement and sludges at wastewater treatment plants, human
excrement in rural areas, animal manure, agricultural wastes, and forestry wastes. The
Integrated Waste Management – Volume II
216
residue is a valuable fertilizer, which is stabilized and almost odorless. This fertilizer is
especially a benefit in developing countries, due to its potential to boost crop yields.
This chapter will discuss:
basics of the anaerobic degradation process,
methane production: quantities and rates,
gas production system design, and
benefits and limitations of anaerobic waste treatment processes.
2. Anaerobic process basics
Anaerobic degradation of organic material (biomass) involves decomposition by bacteria
under humid conditions where contact with molecular oxygen is eliminated. The overall
process of anaerobic degradation can be represented as (Deublein and Steinhauser, 2008):
C
c
H
h
O
o
N
n
S
s
+ y H
2
O x CH
4
+ (c-x)CO
2
+ n NH
3
+ s H
2
S (1)
where x = 1/8 * (4c + h -20 – 3n – 2s) and y = ¼ * (4c – h – 20 + 3n + 3s).
The above equation can be used to estimate the theoretical methane (CH
4
) yield, if the
chemical composition of the substrate is known. Primary sludge substrate can be
approximated as C
10
H
19
O
3
N, and waste activated sludge (biomass) can be approximated as
C
5
H
7
O
2
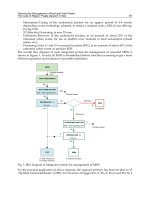
N. The overall process in Eq. 1 can be broken down into stages:
Fig. 1. Anaerobic digestion of organic matter (adapted from Khanal, 2008)
Anaerobic Processes for Waste Treatment and Energy Generation
217
Stage 1: Polymer Breakdown (Hydrolysis) – carbohydrates, lipids, and proteins are
broken down into soluble monomers;
Stage 2: Acid Production (Acidogenesis) – soluble monomers are converted to volatile
fatty acids (lactic, propionic, and butyric acids);
Stage 2.5: Acetic Acid Production (Acetogenesis) - Volatile fatty acids are converted to
acetic acid;
Stage 3: Methane Production (Methanogenesis) – Acetic acid is converted to methane;
carbon dioxide and hydrogen are also converted to methane.
Figure 1 shows a schematic of the overall process of anaerobic digestion of organic matter.
The stages are now discussed in more detail.
2.1 Stage 1: Polymer breakdown (hydrolysis)
The primary components of waste organic matter are carbohydrates, lipids, and proteins, as
shown in Figure 1. In Stage 1, these components are broken down by cellulolytic, lipolytic,
and proteolytic bacteria, respectively, into soluble monomers via hydrolysis (NAS, 1977). In
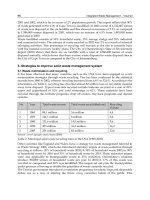
hydrolysis, covalent bonds are split in a chemical reaction with water, as shown in Fig. 2
below.
Fig. 2. Hydrolysis (adapted from Deublein and Steinhauser, 2008)
Bacteria of genera Bacteroides, Lactobacillus, Propioni-bacterium, Sphingomonas, Sporobacterium,
Megasphaera, Bifidobacterium are most common in hydrolysis, including both facultative and
obligatory anaerobes. More details concerning bacteria involved in hydrolysis, as well as the
subsequent stages of anaerobic digestion, are given by Deublein and Steinhauser (2008).
The rate of hydrolysis is typically described using first-order kinetics according to (Sharma,
2008):
r
h
= dC
x
/dt = -k
h
* C
x
(2)
where
r
h
= rate of hydrolysis, mass/(unit volume * time)
C
x
= concentration of hydrolysable substrate x in the reactor, mass/volume
k
h
= hydrolysis rate constant, time
-1
k
h
depends on the specific substrate and temperature. This stage can be rate-limiting for
difficult-to-degrade wastes (containing lipids and/or a significant amount of particulate
matter, such as sewage sludge, animal manure, and food waste) (Henze and Harremos,
1983; van Haandel and Lettinga, 1994).
2.2 Stage 2: Acid production (acidogenesis)
In Stage 2, acid-forming bacteria (acidogens) convert the products of Stage 1, the soluble
monomers, into short-chain organic acids (volatile fatty acids with C>2, such as lactic,
Integrated Waste Management – Volume II
218
propionic, and butyric acids) (Khanal, 2008). Alcohols such as ethanol, hydrogen (H
2
), and
carbon dioxide (CO
2
) are also produced.
The acid formers include both facultative and obligate anaerobic fermentative bacteria,
including Clostridium spp., Peptococcus anaerobus, Bifidobacterium spp., Desulphovibrio
spp., Corynebacterium spp., Lactobacillus, Actinomyces, Staphylococcus, and Esherichia
coli (Metcalf & Eddy, 2004). Deublein and Steinhauser (2008) provide examples of
degradation pathways.
The rate of growth of the acidogens can be described according to (Metcalf & Eddy, 2004;
Sharma, 2008):
r
g
= X (3)
where
r
g
= rate of bacterial growth, mass/(unit volume * time)
= specific growth rate, time
-1
X = concentration of microorganisms, mass/unit volume
The microbial specific growth rate can be described via Monod kinetics (Metcalf & Eddy,
2004; Sharma, 2008):
=
max
* S/(K
S
+ S) (4)
where
= specific growth rate, time
-1
max
= maximum specific growth rate, time
-1
S = concentration of growth-limiting substrate in solution, mass/unit volume
K
S
= substrate affinity constant, or half velocity constant, which represents the substrate
concentration at which the growth rate becomes one half of the maximum growth rate,
mass/unit volume
Substituting Eq. 4 into Eq. 3 gives:
r
g
=
max
* X * S/(K
S
+ S) (5)
The relationship between the rate of soluble monomer (substrate) utilization and rate of
growth of the acidogens is given by (Metcalf & Eddy, 2004; Sharma, 2008):
r
g
= -Yr
su
(6)
where
Y = maximum yield coefficient, mg/mg (defined as the ratio of the mass of cells formed to
the mass of substrate consumed)
r
su
= substrate utilization rate, mass/(unit volume * time)
The substrate utilization rate r
su
can then be written as:
r
su
= -r
g
/Y
= -
max
* X * S/[Y * (K
S
+ S)] (7)
max
/Y is often replaced by k
m
, defined as the maximum rate of substrate utilization per unit
mass of microbes. r
su
is then:
r
su
= - k
m
* X * S/(K
S
+ S) (8)
Anaerobic Processes for Waste Treatment and Energy Generation
219
A system of mass balance equations for each substrate and type of microorganism can be
solved to obtain substrate and biomass concentrations as functions of time. More detail is
provided by Sharma (2008). Monod kinetics can also be used to describe microbe growth
and utilization of substrates in Stages 2.5 and 3.
2.3 Stage 2.5: Acetic acid production (acetogenesis)
In Stage 2.5, acetogenic microbes convert the volatile fatty acids and ethanol formed in Stage
2 into acetic acid (CH
3
COOH)/acetate (CH
3
COO
-
), H
2
, and CO
2
. Examples include (Dolfing,
1988):
Propionate acetate (G = +76.1 kJ)
CH
3
CH
2
COO
-
+ 3H
2
O CH
3
COO
-
+ H
+
+ HCO
3
-
+ 3H
2
(9)
Butyrate acetate (G = +48.1 kJ)
CH
3
CH
2
CH
2
COO
-
+ 2H
2
O 2CH
3
COO
-
+ H
+
+ 2H
2
(10)
Ethanol acetate (G = +9.6 kJ)
CH
3
CH
2
OH + H
2
O CH
3
COO
-
+ H
+
+ 2H
2
(11)
The Gibb’s free energy changes for the above reactions are positive, so the reactions are not
thermodynamically favorable. However, in a co-culture of H
2
-producing acetogenic bacteria
and H
2
-consuming methanogenic bacteria, a symbiotic relationship exists. Methanogenic
bacteria keep the H
2
partial pressure low, which provides a thermodynamically favorable
condition for formation of acetic acid/acetate (Khanal, 2008).
Acetic acid is also generated by homoacetogenic microbes, according to (Khanal, 2008):
2CO
2
+ 4H
2
CH
3
COOH + 2H
2
O (12)
Other homoacetogenic microbes can convert organic substrates such as formate and
methanol into acetic acid/acetate according to (Khanal, 2008):
4COOH CH
3
COOH + 2CO
2
+ 2H
2
O (13)
4CH
3
OH + 2CO
2
3CH
3
COOH + 2CO
2
(14)
The homoacetogenic mesophilic bacteria Clostridium aceticum and Acetobacterium woodii have
been isolated from sewage sludge (Novaes, 1986).
2.4 Stage 3: Methane production (methanogenesis)
Methanogenic bacteria, strictly anaerobic, can use the acetic acid/acetate from Stage 2.5 to
form methane, according to:
CH
3
COOH CH
4
+ CO
2
(15)
The above reaction accounts for up to about 70% of methane produced from anaerobic
processes (NAS, 1977; Gujer and Zehnder, 1983). Acetotrophic (also called acetogenic or
aceticlastic) methanogens, including bacteria from the genera Methanosarcina and
Integrated Waste Management – Volume II
220
Methanosaeta, perform the conversion (Khanal, 2008). At high substrate concentrations,
Methanosarcina will dominate. By converting acetic acid to the gaseous products CH
4
and
CO
2
, Stage 3 reduces the oxygen demand (BOD, COD) of the remaining waste.
Some species, called hydrogenotrophic methanogens, can produce methane from the CO
2
and H
2
formed as products in previous stages, according to:
4CO
2
+ H
2
CH
4
+2H
2
O (16)
The above reaction accounts for up to 30% of methane produced from anaerobic processes
(NAS, 1977; Khanal, 2008).
Methanogens can also use formic acid (methanoic acid, HCOOH), methanol (CH
3
OH), and
methylamines ((CH
3
)
3
N) as substrates, according to (Metcalf and Eddy, 2004):
4HCOOH CH
4
+ 3CO
2
+ 2H
2
O (17)
4CH
3
OH 3CH
4
+ CO
2
+ 2H
2
O (18)
4(CH
3
)
3
N + H
2
O 9CH
4
+ 3CO
2
+ 6H
2
O + 4NH
3
(19)
Besides Methanosarcina and Methanosaeta, other genera of methanogens include
Methanobacterium, Methanobacillus, Methanococcus. Methanogens have very low growth rates;
their metabolism is usually rate-limiting in anaerobic treatment processes (Metcalf and
Eddy, 2004). Long detention times are thus required, which has historically been a drawback
of anaerobic processes compared with aerobic ones, although methods of overcoming this
drawback have been developed in the last decade (Metcalf and Eddy, 2004). However, since
only a small portion of the organic waste is synthesized into new cells, the amount of cells
that must be wasted is small, which is an advantage (Metcalf and Eddy, 2004).
Not all of the carbon dioxide produced during Stage 3 (or Stage 2) is released as gas, since it
is water soluble. CO
2
in solution reacts with hydroxyl ion (OH
-
) to form bicarbonate:
CO
2
+ OH
-
HCO
3
-
(20)
The bicarbonate concentration depends on alkalinity, temperature, and the presence of other
materials in the liquid phase. Conditions favoring bicarbonate production will lower the
percent CO
2
in the gas phase, and increase the percent methane. Bicarbonate acts to buffer
the solution pH (NAS, 1977).
3. Methane production: Quantities and rates
Factors associated with the waste impact the ultimate quantity of methane that can be
produced. Factors associated with the waste, as well as the environment and reactor design,
impact how fast methane is produced. This section discusses the impact of waste and
environmental factors on methane production. The impact of reactor design will be
discussed in the “Gas Production System Design” section. This section also discusses
models for estimating methane production, as well as experimentally measured values of
methane production.
3.1 Waste factors impacting methane production
Various factors associated with the waste impact both the quantity and rate of methane
production:
Anaerobic Processes for Waste Treatment and Energy Generation
221
Waste composition/degradable organic content
Particle size
Organic loading rate (kg/(m
3
*d) )
The maximum quantity of methane that can be produced depends on waste composition,
and in particular the degradable organic content. The theoretical maximum methane yield
can be estimated from Eq. 1 above; however, all of the organic content may not actually be
able to be degraded by the bacteria. Degradability of the substrate decreases as lignin
content increases. The practical amount of methane that can be generated from various
wastes is given in Table 2 in Section 3.4.
Waste composition and particle size (along with the environmental factors moisture content,
ambient temperature, and pH) have been observed to impact methane production rates. The
smaller the waste grain size, the faster methane will be produced, since increased surface
area is exposed to bacterial attack. Shredding the waste can increase the rate of methane
formation, particularly for wastes with a high content of structural materials (e.g. cellulose,
lignin), which make it difficult for microbes to access and degrade the substrate. The yield
for substrates like hay and foliage can be increased by up to 20% by shredding (Deublein
and Steinhauser, 2008). Shredding should be considered for large lumps of excrement, green
cuttings, straw, and other agricultural residuals. Slow-running multiple screw mills, used
also in composting technology, are often used.
The methane quantity generated also depends on organic loading rate, as will be discussed
in the “Gas Production System Design” section.
3.2 Environmental factors impacting methane production
Environmental factors impacting the rate of methane generation include:
Temperature
pH
Moisture content
Nutrient content
Concentration of toxic substances
Each of these factors will be discussed in turn.
3.2.1 Temperature
Anaerobic systems can be designed for temperatures appropriate for mesophilic bacteria
(30-40C) or thermophilic bacteria (50-60C). Higher temperatures increase microbial
activity, with activity roughly doubling for every 10C increase within the optimal range
(Khanal, 2008). Thermophilic systems thus produce methane 25-50% faster, depending on
the substrate (Henze and Harremoes, 1983). Below 15C, almost no methane will be
generated (FAO, 1984). The digestion rate temperature dependence can be expressed using
the Arrhenius equation (Khanal, 2008):
r
t
= r
30
(1.11)
(t-30)
(21)
where
t = temperature in C
r
t
, r
30
are digestion rates at temperature t and 30C, respectively.
Operating systems in the thermophilic range improves pathogen destruction. However,
start-up is slower, and systems are more susceptible to changes in loading variations,
substrate, or toxicity (Khanal, 2008).
Integrated Waste Management – Volume II
222
3.2.2 pH
Acidogens prefer pH 5.5-6.5; methanogens prefer 7.8-8.2. When both cultures coexist, the
optimal pH range is 6.8-7.5 (Khanal, 2008). If the pH drops below 6.6, methanogens are
significantly inhibited, and pH below 6.2 is toxic (Metcalf and Eddy, 2004). When acid-
forming bacteria of Stage 2 and methanogenic bacteria of Stage 3 have reached equilibrium,
the pH will naturally stabilize around 7, since organic acids will be removed as they are
produced, unless a problem develops. Normally, alkalinity in anaerobic systems ranges
from 1000 to 5000 mg/L, which provides sufficient buffering to avoid large drops in pH
(Metcalf and Eddy, 2004).
3.2.3 Moisture content
Many landfill studies have confirmed that methane generation rate increases as waste
moisture content increases (Barlaz et al., 1990; Chan et al., 2002; Chugh et al., 1998; Faour et
al., 2007; Filipkowska and Agopsowicz, 2004; Gawande et al., 2003; Gurijala and Suflita,
1993; Mehta et al., 2002; Tolaymat et al., 2010; Vavilin et al., 2004; Wreford et al., 2000) . In
many anaerobic systems, the digester is fed a water/waste mixture called slurry, as
discussed in “Gas Production System Design”. As long as typical rules of thubfor water
addition are followed, moisture content does not limit methane production.
3.2.4 Nutrient content
Methanogens require macronutrients P and N, as well as micronutrients. The amount of P
and N required can be calculated by assuming the empirical formula for a bacterial cell to be
C
5
H
7
O
2
N (Speece and McCarty, 1964). P and N requirements can also be estimated using
COD/N/P ratios, with a minimum ratio of 350:7:1 COD/N/P needed for highly loaded
systems (0.8-1.2 kg COD/(kg VSS*day), and a minimum ratio of 1000:7:1 COD/N/P needed
for lightly loaded systems (<0.5 kg COD/(kg VSS*day) (Henze and Harremoes, 1983).
Phosphoric acid or phosphate salts are commonly used to supply needed additional
phosphorous, and urea, aqueous ammonia, or ammonium chloride are used to supply
nitrogen (Khanal, 2008).
Trace metals that have been found to enhance methane production include iron, cobalt,
molybdenum, selenium, calcium, magnesium, sulfide zinc, copper, manganese, tungsten,
and boron in the mg/L level and vitamin B
12
in g/L (Speece, 1988).
3.2.5 Toxic substance concentration
High levels of ammonia, soluble sulfides, soluble salts of metals, and alkali and alkaline-
earth metal salts in solution (e.g. those of sodium, potassium, calcium, or magnesium) can
be toxic to methanogens (NAS, 1977). Maximum allowable concentrations of various
substances are given in Table 1 below. In addition, the methanogens are strict anaerobes;
thus, their growth is inhibited by even small amounts of oxygen, or highly oxidized material
(like nitrates).
3.3 Models for estimating methane production
Anaerobic Digestion Model No. 1 (ADM1), published by the International Water
Association, provides a generic model and common platform for dynamic simulations of a
variety of anaerobic processes. The model can be used as a tool for research, design,
operation and optimization of anaerobic processes. It can be used for a variety of
Anaerobic Processes for Waste Treatment and Energy Generation
223
Constituent
Maximum
Recommended
Concentration
Ammonia (NH
3
) 1500-3000 mg/L
Calcium (Ca) 2500-4500 mg/L
Chromium (Cr) 200 mg/L
Copper (Cu) 100 mg/L
Cyanide (CN
) <25 mg/L
Magnesium (Mg) 1000-1500 mg/L
Nickel (Ni) 200-500 mg/L
Potassium (K) 2500-4500 mg/L
Sodium (Na) 3500-5500 mg/L
Sodium chloride (NaCl) 40,000 ppm
Sulfate (SO
4
2-
) 5000 ppm
Table 1. Maximum recommended concentrations of toxic substances in anaerobic slurries
(adapted from OLGPB, 1976)
applications, from domestic (wastewater and sludge) treatment systems to specialized
industrial applications. Outputs from the model include gas flow and composition, pH,
separate organic acids, and ammonium.
Other specialized models for estimating methane production are available. For example, the
U.S. Environmental Protection Agency’s (EPA’s) LandGEM “Landfill Gas Emission Model”
and the IPCC CH
4
generation model are two of the most widely used models for estimating
methane generation from landfills.
3.4 Experimental measurements of methane production
Maximum biogas yields for a variety of common materials are given in Table 2. The yields
are maximum specific yields of biogas for a given waste, or q
waste
(maximum biogas
produced per total organic solids, volume/mass). Although wood is organic, it is not listed
because lignin, the main component of wood, degrades slowly. When values in the table are
not given, they could be estimated from similar type wastes. Deublein and Steinhauser
(2008) provide biogas yields for additional categories of substrates.
Typically, biogas is 60%-70% methane and 30-40% CO
2
(NAS, 1977; Biogas). The fraction of
methane in the biogas increases as the number of C-atoms in the substrate increases
(Deublein and Steinhauser, 2008).
For economic reasons, biogas reactors are designed so that 75% of the maximum degradable
organic matter is actually decomposed (Deublein and Steinhauser, 2008). This means that
the maximum yield values from Table 2 should be multiplied by 0.75 to give an estimate of
the practical biogas yield. For large scale plants, laboratory tests using reactors of 4-8 L, and
then a pilot plant with reactors of size >50L, should be used to determine the practically
attainable methane yield and rate of gas production. More details are given in Deublein
and Steinhauser (2008).
4. Gas production system design
This section focuses on design of larger-scale centralized biogas plants designed for energy
generation in developed countries, such as Germany, and smaller-scale units, that may be used
Integrated Waste Management – Volume II
224
in rural areas of developing countries. In either case, the microbiology and design elements are
the same. Metcalf and Eddy (2004) and Deublein and Steinhauser (2008) provide a thorough
discussion of design of suspended-growth anaerobic digesters for treatment of high-strength
industrial organic wastes and sludges from wastewater treatment plants, so these systems will
not be discussed in detail here. Design of anaerobic systems specifically at landfills is also
discussed elsewhere (e.g. Bagchi, 2004; Rushbrook and Pugh, 1999).
A complete anaerobic system for waste treatment and energy generation includes 3 major
components:
Gas production system
Gas use system
Sludge/liquid product use system
This section focuses on design of the gas production system, for which an example
schematic is shown in Fig. 3. More information about design of the gas use system can be
found in Deublein and Steinhauser (2008) and Khanal (2008). Steps in design of the gas
production system include:
1. Determine biogas production requirements,
2. Select waste materials and determine feed rates; size waste storage; determine rate of
water addition and size the preparation tank,
3. Design the digester/reactor,
4. Design the gas storage system,
5. Determine system location.
Each of these steps will now be discussed in detail.
Fig. 3. Schematic of a small-scale biogas production system (adapted from NAS, 1977)
Substrate Dry
Matter
(DM, %)
% of Dry
Matter that
is Organic
(oDM)
Biogas Yield
(m
3
/kg
oDM)
Hydraulic
Retention
time (days)
C/N
Wastes from households and gastronomy
Bio waste 40-75 30-70 0.3-1.0 27
Leftovers (overstored
food)
14-18 81-97 0.2-0.5 10-40
Sewage sludge
(households)
5 (night
soil)
3.4* (night
soil)
0.20-0.75 35-45 2.9-6
Sewage sludge
(industry)
0.30 20
Flotation sludge 5-24 90-98 0.7-1.2 12
Anaerobic Processes for Waste Treatment and Energy Generation
225
Animal waste
General manure from
livestock
0.26-0.28 14 (farmyard
avg)
Manure from cows 7-20 85-90 0.20-0.50
(per DM)
28-38 18-25
Manure from pigs 5-27.5 90 0.56 22-28 13
Manure from horses 0.2 – 0.3 24-25
Manure from poultry 15-75 75 0.31-0.54 17-22
Manure from sheep 0.37-0.61
(per DM)
20 29
Cow dung 0.33 (per
DM)
Slaughterhouse waste 0.3-0.7 2
Animal fat 1.00 33
Stomach content of
pigs
12-15 80-84 0.3-0.4 62
Greens, grass, vegetable wastes
Vegetable wastes 5-20 76-90 0.4 8-20
Leaves 82 0.6 8-20 41
Leaves from trees 0.210-0.294
Grass cuttings from
lawns
37 93 0.7-0.8 10 19
Market wastes 8-20 75-90 0.4-0.6 30
Straw from cereals 86 89-94 0.2-0.5 128 (wheat
straw)
Maize straw 86 72 0.4-1.0 53
Rice straw 25-50 70-95 0.55-0.62 67
Wastes from the food and fodder industry
Potato pulp, potato
peelings
6-18 85-96 0.3-0.9 3-10 25 (potato
tops)
Mash from
distillations
2-8 65-85 0.42 14
Wheat flour 88 96 0.7
Oilseed residuals
(pressed)
92 97 0.9-1.0
Cereal mash 6-8 83-90 0.9 3-10
Wastes from other industries
Egg waste 25 92 0.97-0.98 40-45 173
Waste from paper and
carton production
0.2-0.3
Pulp 13 90 0.65-0.75
* % of total that is organic
Dry matter is equivalent to total solids.
Table 2. Maximum biogas yields and C/N of various substrates (adapted from Deublein and
Steinhauser, 2008; OLGPB, 1976; NAS, 1977; Metcalf & Eddy, 2004)