Nuclear Power Operation Safety and Environment Part 4 ppt
Bạn đang xem bản rút gọn của tài liệu. Xem và tải ngay bản đầy đủ của tài liệu tại đây (1.89 MB, 30 trang )
Geodetic Terrestrial Observations
for the Determination of the Stability in the Kr{ko Nuclear Power Plant Region
79
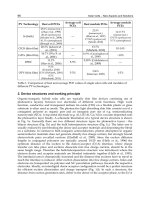
Fig. 1. Stabilisation and signalisation of the reference and control points
3.2.2 The Libna network
The measuring points were determined by a set of two physically stabilised points. The
measuring points, onto which the reflector was forced-centred, presented the points
monitored for displacements. In all measurement epochs we used the same reflectors - Kern
ME 5000. All the measurements were carried out on the points that were – according to the
reference measuring points – set up ex-centrally. The term ex-central stand was introduced.
The distance from the ex-centre to the centre point was 10 – 20 m (Figure 2).
The reference points were stabilised by combining the methods described above (Figure 3).
However, the implementation was simplified and the costs were lower. A mass-produced
concrete tube with Φ = 0.25 m in diameter and 1 m length was used. A hole of the same
diameter was drilled into the pillar, and a concrete tube was put into the hole. The tube was
filled in with concrete and a device for forced-centring was built in. The cylinder top was
covered with a mass-produced cover for full protection.
Fig. 2. Ground stabilisation of the centre and the ex-central stand
Nuclear Power – Operation, Safety and Environment
80
Fig. 3. Signalisation of the centre and the ex-central stand
The instrument stand was stabilised with the usual ground stabilisation by means of a
concrete square stone with a built-in plug. Above the instrument stand, a tripod was set-up,
centred and levelled. The centring accuracy did not influence the end results, since the co-
ordinates of the measuring point onto which the reflector was forced-centred were of crucial
importance, not the co-ordinates of the instrument stand. However, the tripod's stability
during the measurements was essential.
The procedure of ensuring the appropriate network geometry and required precision for the
determination of the horizontal coordinates of points in this way is theoretically and
practically described in the article (Kogoj, 2004).
3.3 History of measurements and measuring accuracy
3.3.1 The Krško network
Due to the changed measuring instrument, in 2004 also the method of measurements based
on simulation of observations was changed in the combined Krško micro network. We chose
a combination of triangulation and trilateration, which provides a larger number of
redundant observations. Since periodic measurements of the dam are foreseen twice a year
(in spring and in autumn), so far 14 independent measurements have been conducted.
In the Krško micro trigonometric network the classic terrestrial surveying was chosen. The
measurements were performed with the precision of electronic total station Leica Geosystems
TC2003 intended for precise angle and distance measurements in precision terrestrial
geodetic networks (Savšek-Safić et al., 2007). Measuring accuracy for angle measurements is
DIN18723-Theo (Hz-V)
= 0.5" and for distance measurements
S
: 1 mm; 1 ppm. Forced centring of
the instrument, signalisation of measuring points and measurement of meteorological
parameters were performed by tested and calibrated supplementary equipment (reflectors,
footplate with reflector mounts, psychrometer, barometer). The first measurement in 2009
was due to changed instrument performed by precise electronic tachymeter Leica Geosystems
TCRP 1201. Measuring accuracy for angle measurements is
DIN18723-Theo (Hz-V)
= 1.0" and for
distance measurements
S
: 2 mm; 2 ppm. In the same year we bought the most advanced
electronic tachymeter by the manufacturer Leica Geosystems TS30, with which we performed
Geodetic Terrestrial Observations
for the Determination of the Stability in the Kr{ko Nuclear Power Plant Region
81
the last three measurements. The measuring accuracy for angle measurements is
DIN18723-Theo
(Hz-V)
= 0.5" and for distance measurements
S
: 0,6 mm; 1 ppm.
The measuring accuracy was determined on the basis of Ebner' s method of the a–posteriori
weight determination (Vodopivec & Kogoj, 1997). The results included position accuracy
and are given in Table 1.
Epoch
σ
a
[''] σ
s
[mm]
August 2004 1.51 0.33
December 2004 1.89 0.23
August 2005 1.35 0.32
November 2005 2.96 0.37
July 2006 2.34 0.40
November 2006 1.23 0.15
May 2007 1.71 0.23
October 2007 2.05 0.32
April 2008 1.88 0.43
September 2008 1.60 0.37
May 2009 0.53 0.21
September 2009 0.80 0.27
May 2010 0.48 0.27
October 2010 0.53 0.10
Table 1. Measuring accuracy achieved in the Krško network
3.3.2 The Libna network
The Libna network was stabilised in 1998. So far, we have realised seven measurement
epochs.
To determine horizontal coordinates of the net points, we used the combination of angle and
distance measurements. The measuring method was a combination of triangulation and
trilateration. In each epoch we realised measurements on all eccetrical stands.
We used the best instrumentation available. For the first six measuring epochs Electronic
theodolite Kern E2 was used for angle measurements. The instrument is one of the first most
precise electronic theodolites of the first generation. Its construction and accuracy stability is
excellent. The measuring accuracy defined on DIN standard procedure is
DIN18723-Theo (Hz-V)
=
0.5" For distance measurements we used precise distancemeter Kern Mekometer ME 5000.
This instrument was constructed in the 1980's but it has been so far considered as the most
precise geodetic electrooptical distance meter in series production. Measuring accuracy is
S
: 0.2 mm; 0.2 ppm.
In last two measuring epochs electronic total station Leica Geosystems TC2003 was used. This
instrument is designed for the most precise angle and distance measurements. With the
selected additional accessories the highest accuracy can be achieved. The measuring
accuracy for angle measurements is
DIN18723-Theo (Hz-V)
= 0.5" and for distance measurements
S
: 1 mm; 1 ppm.
For temperature and humidity measurements we used 2 precise psyhrometers, and for air
pressure measurements we used digital barometer Paroscientific, model 760-16B.
Nuclear Power – Operation, Safety and Environment
82
Similar as in the Krško network, the measuring accuracy was determined on the basis of
Ebner's method of the a–posteriori weight determination (Vodopivec & Kogoj, 1997). The
results included position accuracy and are given in Table 2.
Epoch
σ
a
[''] σ
s
[mm]
November 1998 1.03 0.45
December 1999 0.53 0.23
December 2000 0.62 0.52
November 2001 1.81 0.60
March 2003 0.94 0.72
April 2005 1.09 0.31
February 2008 3.30 0.62
Table 2. Measuring accuracy achieved in the Libna network
3.4 Determination of point displacements
3.4.1 The Krško network
3.4.1.1 The adjustment
The geodetic datum of the horizontal network was determined by two given assumingly
stable points – reference points O1 and O5. To preserve the identical network geometry, as
well as measurement and observation methods, the reference points were first tested for
stability. The comparison of changes in coordinates between the last campaigns indicated
that pillars O1 and O5 were statistically stable. In this way, the determination of the datum
in the network enabled us to determine the statistically significant displacements of control
points with a higher probability (Savšek-Safić et al., 2007).
The horizontal coordinates were calculated into the existing local co-ordinate system of the
network to the level of the lowest point (reference point O4). The observations were tested
for the potential presence of gross error, following the Danish method. The input data for
the horizontal adjustment were the reduced averages of three sets of angles and the slope
distances reduced to the chosen level. The reduction of distances took into account the
instrumental, meteorological, geometric and projection corrections (Kogoj, 2005). The zenith
angles were observed to establish the height stability of the reference and control points. The
observations in the horizontal network were adjusted following the method of indirect
observations. First, the adjustment of the free network was performed, which gave us an
unbiased estimate of observations (Figure 4). Then the S-transformation was used, where
the geodetic datum was determined by two statistically stable reference points O1 and O5.
The results of the horizontal adjustment are the most probable values of horizontal
coordinates of measuring points in the local system with the corresponding accuracy
estimates.
3.4.1.2 The displacements
In the area of NEK the horizontal stability of the Sava River dam was investigated based on
fourteen consecutive epochs. In December 2003, the transition to a new way of
measurements (measurement method, instrument, network geometry) and the
determination of a new geodetic datum in the micro network of Krško enabled a higher
reliability of the determination of statistically significant displacements. Based on an expert
Geodetic Terrestrial Observations
for the Determination of the Stability in the Kr{ko Nuclear Power Plant Region
83
geological opinion we decided that the geodetic datum in the Krško network would be
represented by two assumingly most stable reference points O1 and O5.
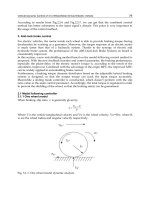
Fig. 4. Position accuracy for single epochs – Helmerts error ellipses - free net adjustment of
the Krško network
After the adjustment of at least two epochs, it was possible to determine the displacement of
point d and displacement variance
2
d
. The probability function for the test statistic (15)
was determined empirically with simulations, and then compared to the critical value
considering the chosen significance level
. Displacements could be identified as
statistically significant according to the distribution of test statistic and chosen significance
level
. If the test statistic was smaller than the critical value at the chosen significance level
, we assumed that the displacement was statistically insignificant. If the test statistic is
higher than the critical value, the hypothesis was justifiably rejected and we could confirm
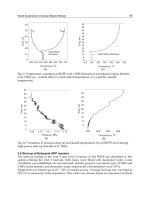
the statistical significance of the displacement. In Figure 5 the regression coefficient defines
the displacement velocity in meters per day with transformation S on points O1 and O5.
Nuclear Power – Operation, Safety and Environment
84
Fig. 5. The displacements of control point H3 in the directions of coordinate axes with the
belonging standard deviations in time.
The time line of horizontal displacements of points on the Sava River dam was represented
with the displacements of control points and the corresponding relative displacement
ellipsoids referring to the two-epoch displacements. The relative displacement ellipsoids are
calculated from the point determination accuracy in a single epoch.
3.4.2 The Libna network
3.4.2.1 The adjustment
For the adjustment we need mean values of six sets measured in horizontal directions. In
each epoch a priori statistical analyses was made for the elimination of gross errors and for
the computation of measuring accuracy.
The horizontal coordinates of net points are determined on the local level. We considered
meteorological, geometrical and projectional reductions of measured distances (Kogoj,
2005). On the basis of measuring differences in both directions we also estimated the
accuracy of the distances.
In zero epoch measurement the local datum of the net was determined. The orientation of
the coordinate axes is nearly parallel with the Slovenian national Gauß-Krüger coordinate
system.
The adjusted coordinates of ground points A, B C and D of zero epoch in 1998 are
approximate coordinates for all other epochs. The definitive coordinates of points A, B, C
and D for each epoch were determined on the basis of the adjustment process. We supposed
that the accuracy of horizontal directions was the same for each instrumental standing point.
The distances in the net were short. Based on this, we should determine the weights of the
distances on the basis of only the constant part of the error. We always used the software
GEM4 for simultaneous angle and distances network adjustment. The final results were the
horizontal coordinates of the net points and the accuracy estimation (elements of error
ellipses).
First we adjusted the net as a free network for all epochs. Based on the results we analysed
the measuring accuracy and the position accuracy of the net points. The reason for this is
that free network adjustment gives the most objective results of measuring accuracy because
there is no influence of the datum parameter.
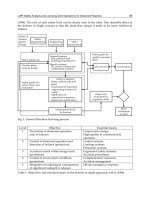
The following Figure 6 shows the size of the semi-major axis of the error ellipses (worst
case), obtained in each epoch. Comparison of the absolute values of the ellipses is due to
Point H3
y = -0.0000000618x + 0.0020861015
-0.005
0.000
0.005
jan.04
jan.05
jan.06
jan.07
jan.08
jan.09
jan.10
time
dy [m]
Point H3
y = 0.0000002183x - 0.0086003688
-0.007
-0.002
0.003
jan.04
jan.05
jan.06
jan.07
jan.08
jan.09
jan.10
time
dx [m]
Geodetic Terrestrial Observations
for the Determination of the Stability in the Kr{ko Nuclear Power Plant Region
85
high precision level questionable. The increase in value from 0.2 mm to 0.3 mm means a loss
of numerical precision of about 50%. From geodetic point of view we know that between
these values there are practically no differences!
Fig. 6. Position accuracy for single epochs – Helmerts error ellipses - free net adjustment of
the Libna network
3.4.2.2 The displacements
The main problem in the displacement determination process is the choice of stable points.
The defect of the geodetic datum was 3, so we needed at least one and a half given points.
On the basis of geological situation there were two logical possibilities. We could choose
points A and B or C and D.
The differences of the coordinate values of points A and B between single epochs were
minimal. We once again adjusted each epoch on four different datums of the net. The main
conclusions, based on the results, are:
Nuclear Power – Operation, Safety and Environment
86
the size of proven displacements on points C and D are practical invariants on the
datum of the net based on points A and B,
from the aspect of minimal influence of the accuracy of given points on the final
parameters of displacement vectors the best choice is the determination of the datum
based on the S-transformation.
We used our own software Premik. The elements of the displacement vectors for all epochs
combinations were calculated.
In further analyses we computed the displacement velocity. The displacement velocities of
points C and D in y and x directions with standard deviations determined on the basis of the
S-transformation on points A and B are computed on the basis of linear regression analyses.
We used the same procedure also for the determination of the datum on the basis of points
C and D. In Figure 7 the regression coefficient defines the displacement velocity in meters
per day with the S-transformation on points C and D.
Point A
y = 0.0000013870x - 0.0498787602
-0.0250
-0.0200
-0.0150
-0.0100
-0.0050
0.0000
0.0050
0.0100
0.0150
jan.98
jan.99
jan.00
jan.01
jan.02
jan.03
jan.04
jan.05
jan.06
jan.07
jan.08
jan.09
time
dy
Point A
y = -0.0000014265x + 0.0520573856
-0.0250
-0.0200
-0.0150
-0.0100
-0.0050
0.0000
0.0050
0.0100
0.0150
jan.98
jan.99
jan.00
jan.01
jan.02
jan.03
jan.04
jan.05
jan.06
jan.07
jan.08
jan.09
time
dx
Point B
y = 0.0000011880x - 0.0434505643
-0.0250
-0.0200
-0.0150
-0.0100
-0.0050
0.0000
0.0050
0.0100
0.0150
jan.98
jan.99
jan.00
jan.01
jan.02
jan.03
jan.04
jan.05
jan.06
jan.07
jan.08
jan.09
time
dy
Point B
y = 0.0000002060x - 0.0085908821
-0.0250
-0.0200
-0.0150
-0.0100
-0.0050
0.0000
0.0050
0.0100
0.0150
jan.98
jan.99
jan.00
jan.01
jan.02
jan.03
jan.04
jan.05
jan.06
jan.07
jan.08
jan.09
time
dx
Fig. 7. The displacements of points A and B in the directions of coordinate axes with the
belonging standard deviations in time.
4. Conclusion
A contractor of geodetic works is expected to present not only data on point displacements,
but also to provide assurance in terms of the quality of displacement estimation. In addition
to the assumed null hypothesis
0:
0
dH and the chosen significance level
, the actual
risk of rejecting the true null hypothesis is crucial. The participation of the commissioning
Geodetic Terrestrial Observations
for the Determination of the Stability in the Kr{ko Nuclear Power Plant Region
87
party in the process of evaluating the estimated displacements is highly recommended. The
decision upon risk acceptability is then in the hands of the commissioner.
The Sava River dam has a specific place among the NEK buildings, since it is subjected to
the great force of the Sava River flow and to the differences in filling and emptying of the
reservoir, i.e. the difference between high flow and low flow. Periodically larger
displacements of the entire dam are to be expected.
The Libna network was stabilised in such way that two points are located on one and two
points on the other side of the fault. The purpose of several years of continuous
measurements was to determine tectonic activities of the fault in question.
Due to expected small displacements in both networks we were mainly focused on:
precise ground stabilisation (example Libna) or concrete observation pillars (example
Krško), which allows forced centering of the instrument or reflector;
use of precise measuring instruments and additional measuring equipment;
meeting the condition of as large number of redundant observations as possible to
assure quality measurements and results;
consideration of all influences on the measured quantities;
analysis of the precision of measurements and detection of any major errors (outliers) in
the measurements;
transformation of adjusted coordinate points into geodetic datum of assumingly stable
points, where the displacement of other points can be measured.
As shown, test statistic (15) along with the empirical cumulative distribution function is
appropriate tools for testing the significance of point displacements in a geodetic network.
Since the displacement and its respective accuracy are acquired by a simple method, the
suggested procedure is appropriate and provides good results that furnish a good first
estimate of the situation in the discussed network. The test example illustrates that the
estimation of displacement significance is directly dependent upon the critical value at a
chosen significance level
. Accurate displacement estimation is achieved only if the critical
value is determined according to the actual distribution function of the test statistic. Having
in mind the difficulty level of the assignment and its consequences, the decision must be
made whether there is the need for a detailed deformation analysis to be carried out using
one of the known approaches.
5. Acknowledgment
We gratefully acknowledge the help of the company IBE d.o.o., specifically Mr. Božo
Kogovšek, the expert responsible for the NEK technical monitoring.
6. References
Box, G.E.P. & Müller, M.E. (1985). A note on the generation of random normal deviates.
Annals of Mathematical Statistics, Vol. 29, pp. 610-611, ISSN 0003-4851
Caspary, W.F. (2000). Concepts of Network and Deformation Analysis, Kensington, School of
Surveying, The University of New South Wales, ISBN 0-85839-044-2, Kensington,
N.S.W., Australia
Kogoj, D. (2004). New methods of precision stabilization of geodetic points for displacement
observation. Allgemeine Vermessungs-Nachrichten, Vol.111, No.8/9, pp. 288-292,
ISSN 0002-5968
Nuclear Power – Operation, Safety and Environment
88
Kogoj, D. (2005). Merjenje dolžin z elektronskimi razdaljemeri, UL-FGG, ISBN 961-6167-47-2,
Ljubljana, Slovenia (in Slovene)
Mierlo, J. van (1978). A testing Procedure for Analysing Geodetic Deformation
Measurements, Proceedings of the 2nd FIG Symposium on Deformation Measurements by
Geodetic Methods, pp. 321-353, Bonn, Germany
Press, W.H.; Teukolsky, S.A.; Vetterling, W.T. & Flannery, B.P. (1992). Numerical recipes in
Fortran 77: the art of scientific computing (Second Edition), Cambridge University
Press, ISBN 0-521-43064-X, Cambridge, USA
Rubinstein, R.Y. (1981). Simulation and the Monte Carlo Method, John Wiley & Sons, ISBN 0-
471-08917-6, New York, USA
Savšek-Safić, S.; Ambrožič, T.; Stopar, B. & Turk, G. (2006). Determination of point
displacements in the geodetic network. Journal Of Surveying Engineering-ASCE,
Vol.132, No.2, pp.58-63, (May 2006), ISSN 0733-9453
Savšek-Safić, S.; Kogoj, D.; Marjetič, A. & Jakljič, S. (2007). 49. geodetska izmera horizontalnih
premikov geodetskih točk NEK, UL-FGG, Ljubljana, Slovenia (in Slovene)
Vodopivec, F. & Kogoj, D. (1997). Ausgleichung nach der Methode der kleinsten Quadrate
mit der a posteriori Schätzung der Gewichte. Österreichische Zeitschrift für
Vermessungswesen und Geoinformation, Vol.85, No.3, pp. 202-207, ISSN 0029-9650
5
Low Power and Shutdown PSA for the Nuclear
Power Plants with WWER440 Type Reactors
Zoltan Kovacs
RELKO Ltd, Engineering and Consulting Services
Slovakia
1. Introduction
Two nuclear power plants (NPPs) are in operation in Slovakia equipped with
WWER440/V213 type reactors. The Jaslovske Bohunice V2 NPP has two reactors in
operation, the Mochovce NPP has also two reactors in operation and another two reactor
units are under construction which will be given into operation in 2013. Full power and
shutdown level 1 and level 2 probabilistic safety assessment (PSA) as part of the plant safety
report were performed for these plants by the RELKO PSA team.
The role of PSA for NPPs is an estimation of the risks in absolute terms and in comparison
with other risks of the technical and the natural world. Plant-specific PSAs are being
prepared for the NPPs and being applied for detection of weaknesses, design improvement
and backfitting, incident analysis, accident management, emergency preparedness,
prioritization of Research & Development and support of regulatory activities.
There are three levels of PSA, being performed for full power operation and shutdown
operating modes of the plant:
Level 1 PSA: The dominant accident sequences leading to the core damage are
identified and the core damage frequency is calculated. The strengths and weaknesses
of the safety systems and procedures to prevent the core damage are also provided as
results.
Level 2 PSA: The ways in which radioactive releases from the plant can occur are
identified and the magnitudes and frequency of release are calculated. Detailed
analyses of the containment are performed. Safety measures are proposed to minimize
the release of radioactive materials into the environment after a severe accident.
Level 3 PSA: The public health and other societal risks such as contamination of land or
food are estimated. Damage to people (number of fatalities, the number of injured,
reduction of life expectancy) and damage to property (loss of agricultural products and
of natural resources, destruction, the cost of relocating the population and
decontaminating effecting areas, etc.) are identified and safety measures are proposed
to be implemented to minimize the risk. The Nuclear Regulatory Authority does not
require the level 3 PSA for NPPs in Slovakia, however, the performance of analyses is
strongly recommended.
There are two basic types of the plant outage: unplanned maintenance outages due to the
repair of the components and planned refuelling outages. The differences are in:
Nuclear Power – Operation, Safety and Environment
90
Safety systems availability,
Duration of outage,
Neutron and thermal-hydraulic conditions,
Reactor coolant system (RCS) and containment configuration.
For the unplanned shutdowns, the operation can continue after several hours. In general, for
these shutdown modes it is not necessary to achieve the cold shutdown state or to open the
reactor vessel. Preparing of the action schedule is required for each shutdown of the unit,
where the individual actions done by the personnel are indicated.
During these outages the reactor subcriticality is achieved by the insertion of all control rods
into the core. Operational records of the WWER440 type reactors have shown us, that there
are several events during the year where it is necessary to decrease the power for urgent
repairs. The unplanned unit trip also occurred.
The outage of the reactor is planned once per year for the refuelling. These are the planned
yearly outages for the refuelling of the reactor and the general plant maintenance. The
reactor is cooled down to cold state and the reactor vessel is open. Only a fraction of the fuel
is replaced by the new fuel (typically about 25% of the total number) in the short refuelling
outage. The rest of the fuel elements remains in the reactor vessel during the outage. The
refuelling is performed according to the approved refuelling program. These are the
planned outages for the refuelling of the reactor and extended plant maintenance.
Long refuelling outage is performed every fourth year, and involves in-service inspection of
the reactor vessel. The difference between the short and the long outage is mostly in the
scheduled inspection of the reactor vessel. However, the whole reactor core is transferred to
the spent fuel pool.
The risk from nuclear power plants was assumed for many years to be dominated by the
risk during full-power operation. The deterministic licensing process, the PSA focused on
full power. It seemed clear that shutdown was the safe condition.
After all, the reactor is shutdown, the decay heat is low, substantial time is available for
recovery, and many recovery options are possible. On the other hand, a growing number of
incidents during shutdown, some of them leading to substantial loss of reactor coolant
through draining, began to focus attention on the possibility of significant risk during
shutdown conditions. In fact, although decay heat is low, it can still be substantial and must
be removed.
In addition, much equipment is unavailable due to maintenance, there may be unusual
plant configurations, automatic safety features may be disabled, and manual response is
required (often with little guidance from procedures and training). Also, knowledge of
timing and success criteria is limited.
During last few years, operational experience and performance of the low power and
shutdown PSA highlighted the magnitude of the risk contribution from those, previously
considered safe operating modes. This risk was found to be significant. Many studies such
as the shutdown PSA for PWR in Western Europe (France and Switzerland) and WWER
plants in Central Europe (Slovak, Hungary and Czech Republic) as well as latest industry
events, such as Paks NPP shutdown fuel damage accident, demonstrated that the core
damage frequency (CDF) from an accident occurring during shutdown or low power
operation modes was higher (up to 100% of CDF for some plants) than the one at power.
This risk is not related to the plant design. It is rather related to the unavailability of
equipment due to maintenance activities undertaken during an outage, presence of
Low Power and Shutdown PSA for the Nuclear Power Plants with WWER440 Type Reactors
91
additional (contractor) personnel who may not be fully aware of the safety issues, presence
of additional heavy loads and flammable materials, etc. All of these items increase the risk
during plant outage.
Adequate planning and preparation of activities during outages can reduce both the
probability and the consequences of possible events. In other words, there are a lot of
possibilities for safety improvements in those operating modes. To decide what kind of
improvements are the best on safety and cost beneficial grounds, a variety of analytical
approaches could be used.
One of these is administrative control based on the experience of individuals involved in the
outage planning. While any careful analysis will find ways to improve safety during
outages, it is felt that this approach would not be best suited to very well handle a more
complex interface, since critical configurations may not always be recognised.
Another approach is a PSA-type modelling, which considers a variety of interactions and
dependencies of important systems. Performance of PSA for shutdown and low power
operating modes (SPSA), may support the enhancement of the safety during plant outage,
and may contribute to reduction of the outage duration. Thus a detailed analysis of
shutdown operation may:
contribute to a more economical plant operation,
improve plant safety and
decrease the consequences of incidents.
The full power PSA is no longer representative of the actual plant risk profile during the
operational condition when the configuration of safety and support systems has changed
extensively. This usually happens when the reactor power is below a certain level and
automatic actuation of safety systems is being interlocked. Therefore, contribution of the risk
during plant outage deserves a special attention and a shutdown PSA appears to be an ideal
tool to improve safety during plant outage.
This chapter gives the view of level 1 and 2 SPSA modelling issues and results for the Slovak
NPPs. The lessons learned in this area are presented and the PSA applications are described.
The PSA models were developed in the RISK SPECTRUM PSA code.
2. Modelling issues related to Level 1 SPSA
The level 1 PSA study of the plant calculates the CDF and identifies the dominant initiating
events (IE) and accident sequences that contribute to the core damage. The main modelling
issues related to SPSA are described in this part of the chapter:
Plant operating modes and plant operational states,
Initiating events,
Screening analysis,
Modelling of accident sequences (fault trees and event trees),
Human reliability analysis (HRA),
Quantification of accident sequences and
Application of SPSA.
2.1 Plant operating modes and plant operational states
The definition of the plant operating mode varies from country to country. The Slovak plants
have adopted the USA definitions. There are seven operating modes, numbered 1 to 7.
These are:
Nuclear Power – Operation, Safety and Environment
92
1. Full power operation,
2. Reactor criticality,
3. Hot shutdown,
4. Semi-hot shutdown,
5. Cold shutdown – reactor vessel is closed,
6. Cold shutdown – reactor vessel is open and
7. Empty reactor vessel (the fuel is removed from the reactor vessel and located to the
spent fuel pool).
Understanding of plant operating modes and its characteristics in terms of systems available
and the general plant conditions is essential for the development of the low power and
shutdown PSA model. Operating modes are also highly important for defining the interface
between power PSA and low power and shutdown PSA. For an integrated PSA model of a
plant, it is significant to adequately define the interface between power PSA and low power
and shutdown PSA. This interface does not necessarily coincide with the definition of the
operating modes. Typically, the full power PSA considers 100% nominal power.
In terms of the thermal hydraulic response to an initiating event, there is not much
difference between 100% power and lower power levels, expect that at lower power levels
the time available for selected corrective actions may be somewhat greater. The 100% power
case is therefore conservatively a representative of the whole spectrum of power levels.
When the reactor power reaches a certain power level, the automatic actuation of the safety
systems is disabled. Depending on the reactor design, and in some cases on operating
practice, this could be between 0-10% nominal power. This point is the natural interface
between the full power PSA and SPSA (see Fig. 1).
While the reactor is on low power, even without automatic actuation of safety systems, the
power PSA models (with appropriate modifications) could be used to determine the risk
level. This is generally true also for the hot stand-by mode.
Once the reactor is in the shutdown mode, and especially when the decay heat is removed
via residual heat removal system (RHR), the state of the plant is such that most of the power
PSA models are not applicable without major modifications.
Plant operating modes are important from the standpoint of the conduct of the plant
operation. For a SPSA the plant operating modes do not mean much. Due to extensive
changes in plant configuration during a shutdown period, it is necessary to define plant
operational states (POSs) which will properly reflect the plant configuration during an
outage evolution.
The POS is used to define boundary conditions within which there would be no changes in
major characteristics which are important for PSA modelling.
The POS is defined as a period during a plant operating mode when important
characteristics are distinctively different from another plant operating state. The important
characteristics describing a plant operating state are:
- RCS temperature and pressure,
- RCS water level (inventory),
- Decay heat removal,
- Availability of safety and support systems,
- Containment integrity,
- System alignments and
- Reactivity margins.
Low Power and Shutdown PSA for the Nuclear Power Plants with WWER440 Type Reactors
93
0%
10%
20%
30%
40%
50%
60%
70%
80%
90%
100%
REACTOR POW
E
LOW POWER & SHUTDOWN PS
A
SHUTDOWN
LOW
POWER
LOW
POWER
FULL POWER PSA FULL POWER PSA
RHR COOLING
POWER
GENERATION
POWER
GENERATION
REDUCE
POWER,
COOL
DOWN
HEATUP,
INCREASE
POWER
REACTOR POWER
Fig. 1. Full power, low power and shutdown PSA
Some or all characteristics indicated above should be considered in defining the plant
operational states. It is obvious that defining the POSs for every possible plant condition
may result in a very large number of POSs. The attempt to define all the POSs which are
relevant for SPSA could result in several hundreds POSs. One of the initial activities related
to defining the POSs is their grouping to reduce the number of POSs to a manageable level.
The grouping process shall consider issues like specific success criteria, typical IEs and
system availability. The actual practice varies among PSA practitioners, but the general
guidance is always to distinct POS in their main characteristic. A typical number of POSs
considered in SPSA varies from 10 to 15. Newer studies tend to have more POSs than the
early ones. It should bee noted that the scope and objectives of a SPSA have a dominant
effect on the selection of the POSs.
Examples of POSs for a WWER440 type reactor are shortly described below:
1. POS1. The reactor is sub-critical. The RCS pressure is between the nominal pressure and
4 MPa. The RCS temperature is between nominal and 180°C. All trains of the safety
systems are available (exceptions are allowed by the limiting conditions of operation).
All SGs are connected to the reactor vessel. The primary to secondary side heat removal
operates in the steam-water regime using the auxiliary feedwater system and steam
removal via the steam dump station to the condenser initially and via the technological
condenser at the end of POS. In this POS the containment is closed.
2. POS2. RCS temperature is below 180°C but above 100°C. The RCS pressure is 1-4 MPa.
All trains of the safety systems are available (exceptions are allowed by the limiting
conditions of operation). Some ESFAS signals are disconnected when the RCS
temperature is below 180°C. All SGs are connected to the reactor vessel. In the first part
of this POS the secondary side heat removal is in the steam-water regime. At the end of
Nuclear Power – Operation, Safety and Environment
94
POS the RHR is working in the water-water regime, RHR pump is running and the heat
removal is performed via the technological condenser. At the end of this POS the
containment is open.
3. POS3. The RCS temperature is between T
brittle fracture
and 40°C. The HPSI pumps are
disconnected. These pumps are available in this POS for the accident mitigation only
under the conditions defined in the limiting conditions of operation. However,
exceptions are possible in case of the severe accidents (for example if primary bleed and
feed is needed). One train of the safety systems is unavailable due to preventive
maintenance. Two SGs are connected to the reactor vessel for residual heat removal in
natural circulation, one loop is in reserve mode of operation (with one main isolation
valve (MIV) fully closed and one MIV fully open). The RHR is working in the water-
water regime and the heat is removed via the technological condenser.
4. POS4. The RCS temperature is 40°C. The RCS pressure is the atmospheric pressure. The
reactor vessel is being open (drainage of vessel level is needed). One train of the safety
systems is in the planned maintenance. Two SGs are connected to the reactor vessel;
one SG is in the reserve mode. The RHR is working in the water-water regime and the
heat is removed via the technological condenser. The water level is increased in the
refuelling cavity in the end of POS.
5. POS5S. The RCS temperature is 40°C. The RCS pressure is the atmospheric pressure.
The reactor vessel is open and the refuelling cavity is filled to the refuelling level. One
train of the safety systems is unavailable due to the planned maintenance. Two SGs
are connected to the reactor vessel; one SG is in the reserve mode. The RHR is
working in the water-water regime and the heat is removed via the technological
condenser.
6. POS5L. RCS temperature is 40°C. RCS pressure is the atmospheric pressure. The reactor
vessel is open and the refuelling cavity is filled to the refuelling level. All fuel elements
are located into the spent fuel pool. One train of the safety systems is unavailable due to
the planned maintenance. This POS occurs only once per four years during the long
refuelling outage. This POS contains all steps of POS5S. In addition, the reactor vessel
inspection is being performed.
7. POS6. The RCS temperature is 40°C. The RCS pressure is the atmospheric pressure. In
this POS the reactor vessel is being closed (drainage of the reactor vessel level is
needed). One train of the safety systems is in the planned maintenance. Two SGs are
connected to the reactor vessel; one SG is in the reserve mode. The RHR is working in
the water-water regime and the heat is removed via the technological condenser.
8. POS7. The RCS temperature is between T
brittle fracture
and 40°C. The RCS pressure is
between the atmospheric pressure and 2 MPa. There is a peak pressure of 3.5 MPa
during a pressure test. The HPSI pumps are disconnected. These pumps are available
for the accident mitigation only under the conditions defined in the limiting conditions
of operation. Exception is possible during the severe accident (for example if primary
bleed and feed is needed). Initially two SGs are connected to the reactor vessel; one SG
is in the reserve mode. The RHR is working in the water-water regime and the heat is
removed via the technological condenser. At the end of POS the RCS is heated by five
main coolant pumps and the containment is closed.
9. POS8. The RCS pressure test is performed at the pressure of 13.7 MPa. Also the high
pressure dynamic test at the pressure of 17.2 MPa is being performed (once per four
years or if new welding is performed in the RCS). The RHR is stopped. If the pressure
Low Power and Shutdown PSA for the Nuclear Power Plants with WWER440 Type Reactors
95
test is not successful the plant is returned to POS7. Given the test successful the plant
goes to POS9 and the containment is closed.
10. POS9. RCS temperature and pressure is gradually increasing to 200°C and to 12.26 MPa.
The RCS coolant is heated by the main coolant pumps. At 180°C the interlocked ESFAS
signals are becoming available. All trains of the safety systems are available (exceptions
are based on the limiting conditions of operation). The primary to secondary side heat
removal is performed in the steam-water regime by the AFW system. All SGs are
connected to the reactor vessel.
11. POS10. The reactor is on the power. The RCS pressure is nominal. The temperature is
increasing from 200°C to 260°C. All trains of the safety systems are available (exceptions
are based on the limiting conditions of operation). At the RCS temperature of 245°C
another ESFAS signals are becoming available. At the end of POS the reactor power is
2% of the nominal power.
Examples of POS duration in hours per year are presented in Table 1. Power 1 and 2 is
duration of low power operation.
POS
Planned refuelling
outages
Unplanned
outages
+
Planned and
unplanned outages
Power 1
18.47 2.91 21.38
POS 1
13.71 3.68 17.39
POS 2
8.96 3.75 12.71
POS 3
34.58 23.61 58.19
POS 4
206.91 206.91
POS 5S
224.66 224.66
POS 5L
1 094.29 1 094.29
POS 6
259.77 259.77
POS 7
107.51 1.89 109.40
POS 8
19.05 0.40 19.45
POS 9
29.41 3.19 32.60
POS 10
79.82 6.61 86.43
Power 2
123.88 7.69 131.57
POS 1-10
j
= 984.38/1854.01*
j
= 43.13
j
= 1027.51/1897.14*
Power 1-2
j
= 142.35
j
= 10.60
j
= 152.95
+
) Unplanned outages caused by component/system failures and initiated reactor shutdown to
corresponding POS.
*) The first number is applicable for short refuelling outage; the second number is applicable for long
refuelling outage.
Table 1. Duration of POS
2.2 The initiating events
Defining a list of initiating events is the major step, which influence the whole SPSA
development process. While the main aim is similar to power PSA, actual initiators
considered in a SPSA are different from those of the power PSA. The profile of initiators also
Nuclear Power – Operation, Safety and Environment
96
highly depends on the actual outage considered (lengths and type forced, refuelling, etc.).
Three broad categories of internal initiators are typically considered in a SPSA, and they are
as follows:
Loss of cooling,
Loss of coolant (LOCA) and
Reactivity events.
LOCA represents a group of events which result in loss of heat removal from the core. When
the core is cooled by the RHR system, its failure is the main initiator in that group.
Loss of coolant events are a challenge to the RCS integrity in the same way as during full
power operation. However, the profile and the causes of LOCAs are significantly different
in the shutdown mode. In the shutdown mode breaks of pipes and reactor vessel rupture
are still possible, but the dominant sources for LOCAs are the drain-down events, including
inadvertent opening of valve and similar, both drain-downs to the plant rooms inside the
containment or to another system (intersystem LOCA outside the containment) should be
considered in a SPSA. Cold over-pressurisation events which are challenging the integrity of
primary circuit may be broadly grouped with this category.
Reactivity events are a specific category due to their specific issues and consequences.
Reactivity accidents can lead to a local or a full core criticality. Examples like boron dilution,
unintentional withdrawal of control rods or refuelling errors are considered in the SPSA.
Experience has shown that many such events occurred at NPPs, and their frequencies are
high, though the consequences are low (recoveries are possible in many of those events).
Some phenomena, like unborated slug of water entering the core and its consequences, are
still being analysed.
Like in a full power PSA, hazards can be divided into two groups, internal hazards and
external hazards. Internal events include fires, floods and events like drop of heavy loads.
These events in comparison to power state are differently treated in a SPSA due to their
specific attributes. Internal fire can have higher frequencies in comparison to the power
operation. The possible fire locations increase during an outage due to maintenance
activities. A fire during an outage is usually initiated by some repair work like welding,
while fires during the power operation are usually initiated by electric circuits. Flooding has
increased frequency due to maintenance activities where floods would be caused by
opening isolation valves and similar activities. Drop of heavy load is an event which is
seldom considered in the power PSA but it could have significant impact on the SPSA
results. Numerous operations with overhead cranes has actually been analysed in several
studies, although the results were not found to dominate the risk profile.
In addition, the external hazards must be taken into consideration: aircraft crash, external
meteorological conditions, seismic events and impact of the neighbouring industry.
2.2.1 Grouping of the IE
The initiating event grouping was performed based on the qualitative criteria. Some
modifications in grouping are possible later when the frequency of the initiating events is
calculated and accident sequence modelling and fault tree modelling is performed.
The qualitative criteria applied for grouping at this stage are the following:
In order to take benefit from the existing event trees and fault trees, the initiating event
groups were selected as much as possible consistently with the list of the initiating
event groups for the full power PSA.
Low Power and Shutdown PSA for the Nuclear Power Plants with WWER440 Type Reactors
97
Plant response and core cooling requirements associated with each of the LOCA
categories are conservatively assumed to be the same as for the full power conditions.
However, this assumption was revised within the system analysis task as one train of
the safety systems is unavailable in some POSs. Core cooling requirements can also be
relaxed taking into account that at the shutdown conditions the residual heat rate of the
core is lower than at the full power conditions.
Frequency of the initiating events was not taken into account in the first step of
grouping. Some of the groups can be screened out due to an extremely low frequency of
the events (provided that they do not lead to a severe plant degradation, i.e. they are
not expected to have a high risk impact).
Some of the events with different consequences (risk impact) were assigned to the same
group when the consequences did not differ very much. In this case the group is
defined based on the event with the highest consequences.
When the consequences of the events (groups) are expected to be different at least in
one POS, such events (groups) are listed separately. However, for some POS these
differences may be negligible and many events can be grouped together.
All events grouped together are not necessarily applicable to the same POS.
Special cases of the event defined as a group representative may have a slightly different
consequences. Bounded events have also different consequences than the event defined as a
group representative as well as a different origin (contrary to the special cases). List of the
events provided as examples is not necessarily exhaustive. Other events that are not
indicated as a special cases or examples are expected to be exhaustive.
Further grouping was possible based on the result of data quantification and system
analysis tasks. Initiating event frequency was one of the aspects on which further grouping
could depend. Generally, it was assumed that the initiating events or IE group could be
conservatively included into another group with similar but worse consequences if its
frequency was not higher than the frequency of the main event representative for the group.
This assumption was verified and the grouping confirmed when the initiating event
frequency was finally determined.
Combination of the individual groups was also possible when the plant response and
mitigation system requirements were defined more precisely.
2.2.2 Assignment of IE to POS
The first stage of POS assignment was done mostly on the basis of possibility of an
occurrence. For instance, the breaks were not considered unless there was an overpressure
in the circuit, the human errors associated with a maintenance were not considered unless
some maintenance activities were conducted in the specific POS, etc.
In general, the assignment of an applicable POS to the initiating event group was carried out
by the considering each event included into the group. In many cases the applicability of
POS was dependent on the particular scenario either through a particular plant
configuration or through specific maintenance activities associated with a certain POS.
In general, the frequency of IE was not taken into account in the POS assignment process.
However, in some cases the frequency was considered in a qualitative way.
For some POS the risk impact of the event was expected to be very low either due to a low
frequency or small consequences or both. However, only a qualitative and subjective
judgement could be provided to justify such observations. Therefore, the event credibility
level is not indicated in the POS assignment results.
Nuclear Power – Operation, Safety and Environment
98
However, a credit was given to the fact that during a specific POS the conditions for IE may
change (e.g. the pressure is decreasing to atmospheric, so the credibility of a LOCA is
diminished). Another aspect that was addressed explicitly was the case when an event was
applicable to a part of POS only (but not a negligible part). This aspect was also
subsequently considered in an estimating of IE frequency.
Since the selection of POS for IE calculation also depends on the expected frequencies and
consequences, another stage of grouping was needed in a co-operation with other PSA
tasks. In this stage a consideration was given to the assumptions taken during the accident
sequence modelling and to the frequency estimation.
For some POS to which an initiating event was applicable the consequence of this event was
considered negligible. The accident sequence task revealed such cases and these events were
screened out for these POS. Typical examples of such screening include: events related to
loss of the reactor core cooling in POS5S (because of a large inventory of the water in the
reactor refuelling pool) and in POS8 (because the system does not need any cooling and the
RHR is switched off) or the loss of working cooling pump in any POS (because of a
relatively low decay heat generation in the spent fuel pool (exception is POS5S).
Initiating events were considered for the deletion if they lead to the core damage in a time
period greater than 24 h. However, it should be noted that simply exceeding this 24 h
window was not, by itself, considered to be sufficient reason for deleting initiating events.
Frequency of the events during particular POS was not taken into account in the initial stage
of the grouping and POS assignment tasks. For some assigned POS an initiating event (or
even a whole group of events) was screened out later due to a low frequency (provided that
it was not expected to have a very high risk impact).
The duration of some POS is very short comparing with other POS, so an initiator or even
the whole group can be screened out on that basis as well (see Table 1). Example for IE
assignment to POS is provided in Table 2.
IE group Event description POS number
1 2 3 4 5S 5L 6 7 8 9 10
RT(RBD) Rapid boron dilution
RT(SBD) Slow boron dilution
RAT
Uncontrolled
reactivity addition
Applicable to the POS Non-applicable to the POS
Table 2. IE assignment to POS – reactivity events
2.2.3 IE frequency calculation
The basic principles for calculation the IE frequencies are the same as for the full power PSA.
However, the determination of the IE frequencies for shutdown events is much more plant
specific due to configuration, maintenance practices and other issues. In SPSA the frequency
of an IE is dependent on POS, and it must be determined for every POS individually.
Low Power and Shutdown PSA for the Nuclear Power Plants with WWER440 Type Reactors
99
There are three basic approaches to calculate the IE frequency in a given POS:
calculation of frequency based on plant specific data,
calculation of frequency by quantifying a logical model of an initiator and
considering the full power PSA frequencies of IE with additional recalculation.
Determination of the IE frequencies based on actual operating experience (plant specific
data) could be the most accurate approach but in the same time it is the most difficult one. A
thorough evaluation of the records on various occurrences during outages is essential in
determining the IEs frequencies. It is very important that the evaluation of experience is
performed together with the plant personnel who could correctly interpret the information
contained in the historical records. The outage schedule as well as POS defined in the
previous step should be evaluated to identify the possibility of the occurrences of each
specific IE in every POS.
The SPSA studies found that human interactions are a high contributor to the frequencies of
many IEs. HRA is used for IE frequency calculation. The IE frequencies considered in the
full power PSA may be only the starting point in defining the IE frequencies for SPSA. Many
of the full power IEs are not directly applicable and the frequencies may be significantly
different during an outage.
In many SPSA studies the frequencies for LOCAs are just adopted from the full power PSA.
Such approach causes some controversy as whether:
LOCAs frequencies should be modified to reflect that the systems are operating at
much lower pressure (some analysts argue that non-pressurised primary piping will
have the reduced pipe ruptures failure rate).
LOCAs frequencies should not be modified to be conservative.
In fact, the contribution to CDF from LOCAs caused by pipe rupture is found to be
negligible in the SPSAs. LOCA caused by human errors is much more important.
The following approaches were applied for initiating event frequency calculation:
1. For the initiators that were quantified based on the plant operational history the
applicable events are uniformly distributed across all applicable POS. For the time
dependent events uniform distribution of the events is assumed within the applicable
time period. The following formula is applied for the annual frequency calculation:
f
i,k
= (N
i
/T) x (t
k
/t
j
)
where
f
i,k
- frequency of initiating event „i“ per reactor year per POS „k“,
N
i
- number of the applicable operating events reported during exposure time period
T,
T - exposure time in reactor years,
t
k
- duration of POS „k“, hours,
t
j
- total duration of applicable POS, hours.
2. For the events that were quantified based on full power data it is assumed that the
initiating event frequency per hour of the full power operational states is the same for
the applicable shutdown states. The following formula is applied for the annual
frequency calculation:
f
i,k
= f
i,FP
x t
k
/T
FP
where
Nuclear Power – Operation, Safety and Environment
100
f
i,k
- frequency of initiating event „i“ per reactor year per POS „k“,
f
i,FP
- frequency of initiating event „i“ per reactor year for full power operational states
(generic or based on full power operational statistics),
t
k
- duration of POS „k“, hours,
T
FP
- exposure time for full power operation in hours per reactor year.
3. Human reliability analysis is applied for several initiators that involve human actions
and never occurred in the plant. These included the initiating events related to the cold
over-pressurization, man induced LOCA and boron dilution. In the most cases there is
the inadvertent actuation leading to the initiating events. The frequency is calculated
based on HRA. In general, the probability of the inadvertent actuation is calculated
from the following formula:
P
IC
= P
I
x P
C
where P
IC
is the probability of not corrected inadvertent actuation, P
I
is the probability
of the inadvertent actuation and P
C
is the conditional probability that the error is not
corrected.
The commission error probability or probability of the inadvertent actuation
(opening) is P
I
= 3.0E-3, the conditional probability that the error is not corrected
P
C
=
0.1. The probability of the inadvertent actuation is P
IC
= 3.0E-4.
4. Bayesian approach is applied to calculate the initiating event frequency for the events
which never occurred in the plant and the IE frequency can not be calculated using
HRA. After updating the prior frequency by the plant specific frequency the posterior
frequency is received.
2.3 The screening process
IE with available recovery times longer than 24 hours could be screened out without much
danger of leaving out important results. IE with very short recovery times, which are those
earlier in an outage and which involve very specific system availability, shall not be
screened-out because of their generally high importance.
Screening process can be performed in two phases:
After screening-out the clearly unimportant events, the draft event trees can be
developed for remaining sequences.
The remaining sequences then could be analyses qualitatively or/and quantitatively.
The main idea of the whole process is to select events of higher safety significance and to
reduce the level of details in modelling work for sequences with lower safety impact. The
final step in the screening process is re-grouping of POSs and initiators. The result of the
whole process is a list of safety important POSs and IE groups. The SPSA requires iterative
processing for re-defining and re-grouping POSs and IEs several times during the process.
Development of detailed accident sequences (including supporting TH analysis, HRA, etc.)
is the most labour intensive part of the SPSA. Its aim is to focus on essential issues only.
Establishment of a systematic screening procedure is the best way of removing unimportant
accident sequences.
2.4 The accident sequences
2.4.1 The fault trees
The fault tree models developed for the full power PSA could be used, with exceptions, as a
basis for SPSAs as well. Revision of the models is necessary due to the following reasons:
- system is operational in shutdown (it is in the standby mode during power operation),
Low Power and Shutdown PSA for the Nuclear Power Plants with WWER440 Type Reactors
101
- system actuation is manual (it is automatic during power operation),
- mission time is different,
- system success criteria changes with POS,
- redundancies are different in different POSs,
- recovery possibilities are different and
- system alignment is different for individual POSs.
2.4.2 The event trees
The accident sequence modelling is usually performed using event trees. The event trees
developed for full power PSA may be modified for use in SPSA. The modification will
typically include removal of some headings (i.e. reactor trip) and relaxation of the others
due to lower decay heat levels. Some new headings may be added to reflect operator actions
which may not be possible during power operation.
Shutdown state also has some specific characteristics which are not modelled in the full
power PSA. Operation of the RHR system and related operator responses often requires
development of new sequence models. A longer time is available to operators to recover
from initial failures. Possibilities to establish non-conventional accident mitigation (as an
example, supplying water into the open reactor vessel) require from the PSA analysts to
consider options which have not been addressed in the full power PSA.
2.5 The human reliability analysis
Human reliability analysis is the most important issue in a SPSA. Both the plant outage and
the start-up activities involve a large number of operator actions, functional tests and
maintenance activities. All of those have to be correctly introduced in a SPSA.
In a SPSA different types of human actions are considered:
human actions before initiating event, affecting availability of equipment,
human actions as an IE,
procedure based post-accident human interactions to terminate an IE,
human recovery actions to recover the failed equipment or to terminate an event.
Compared to the full power PSA, human interaction analysis in a SPSA is much more
complex since they require identification of actual ways the work is being done and
consideration of interactions which are not obvious.
The following issues needed to be addressed when evaluating the human interactions
during outage safety analysis:
operating procedures,
supervision on maintenance activities,
appreciation of risk during shutdown and
comprehensive and appropriate training.
The following steps are important for considering human interactions:
identify all possibly important human interactions during plant outage,
screen these human interactions and prioritise them from the risk perspective, and
collect information from plant experience during shutdown operating mode, and
establish human error data base.
During an outage, the dependencies between human errors tend to be much more complex
than during power operation. Testing and maintenance activities during shutdown
operation create new dependencies which need to be identified and documented. Cross-
Nuclear Power – Operation, Safety and Environment
102
connections and support system status may cause hidden dependencies which need to be
taken into account.
2.6 Quantification of accident sequences
Quantification of accident sequences is performed for all POSs. First, the total CDF is
presented for an average refuelling outage, short refuelling outage and long refuelling
outage. Then, the dominant initiating events, accident sequences, minimal cut sets and
dominant categories of the basic events are identified. Results of the importance and
sensitivity analyses are also summarized.
The task is similar to quantification in the power PSA. However, the sources of data as well
as the procedure to develop a data base may be different. Data for component unavailability
for SPSA have significantly different emphases than for the power PSA. While in the power
PSA the unavailability of safety components are (often) dominated by the failures in stand-
by, in SPSA they are clearly dominated by maintenance unavailability. Maintenance
schedules and actual duration of various tests and maintenance actions are carefully
evaluated to determine the actual equipment availability. Quantification of accident
sequences, uncertainty and sensitivity analysis follow the same methodological approach as
for the full power PSA. Due to various influences, it was shown that the SPSA results
typically have higher uncertainties.
The dominant initiating events identified for all POSs are presented in Table 3. This is
graphically depicted in the pie chart in Fig. 2. Instantaneous CDF for each POSs is presented
in Fig. 3. The dominant contributions to the total CDF are from POS6, POS4, POS7, POS5S,
POS3 and POS5L. The combined contribution of these POSs is 98.1% of total CDF.
No.
Initiating
event
Description
CDF
[1/y]
mean value
Contribution
to total
CDF (%)
1 LOSW(OP) Loss of service water 1.14E-5 20.5
2 LNC(GP)
Loss of natural circulation - gas
penetration
1.12E-5 20.3
3 L(MI-SL) Man-induced small LOCA 9.81E-6 18.0
4 LOP Loss of offsite power 7.77E-6 14.1
5 LRHR Loss of residual heat removal 5.95E-6 10.8
6 COVPR Cold over-pressurisation 1.87E-6 3.4
7 LVBB Loss of vital 6 kV bus bar 1.43E-6 2.6
8 LNC(OD)
Loss of natural circulation - over-
draining
1.32E-6 2.4
9 LBA(B) Leakage in the spent fuel pool 1.32E-6 2.4
10 LNVBB Loss of non-vital bus bar 1.27E-6 2.3
Table 3. The dominant IE for all POSs
Low Power and Shutdown PSA for the Nuclear Power Plants with WWER440 Type Reactors
103
Fig. 2. The average core damage frequency with dominant IE for a WWER440 plant for all
POSs
Fig. 3. Instantaneous CDF for each POS
2.7 Application of SPSA
The following applications of SPSA model and results are considered:
outage planning and scheduling,
optimization of operating and maintenance procedures,
CORE DAMAGE FREQUENCY = 5.54E-5/y
Other events
0.14%
LL-LOOP2,5
0.06%
RHRI
0.1%
LAF
0.1%
LNC(MIV)
0.2%
SGTM
0.4%
FIRE-TGHALL
0.5%
RHRI-SL
0.5%
RT(RBD)
0.5%
SE
0.7%
LRHR
10.8%
COVPR
3.4%
LVBB
2.6%
LNC(OD)
2.4%
LBA(B)
2.4%
LNVBB
2.3%
L(MI-SL)
18.0%
LOP
14.1%
LOSW(OP)
20.5%
LNC(GP)
20.3%
1E-05
POS1
POS2
POS3
POS4
POS5S
POS5L
POS6
POS7
POS8
POS9
POS10
17.39
12.71
58.19
206.91
224.66
217.40
259.77
109.40
19.45
32.60
86.43
2.71E-6
2.43E-6
7.96E-5
9.63E-5
2.24E-5
7.50E-6
1.04E-4
8.47E-5
2.64E-5
2.92E-6
7.66E-6
POS
POS
Dur at ion
(h)
Instant aneous
CDF
2E-05
3E-05
4E-05
5E-05
6E-05
7E-05
8E-05
9E-05
1E-04
1.1E-04
0
0 400 600 800 1000 1200 1400200
Time
(
hours
)
POS 2
POS 1
POS 3
POS 4
POS 5S
POS 5L
POS 6
POS 7
POS 8
POS 9
POS 10