Nuclear Power Operation Safety and Environment Part 8 docx
Bạn đang xem bản rút gọn của tài liệu. Xem và tải ngay bản đầy đủ của tài liệu tại đây (3.53 MB, 30 trang )
Imaging of Radiation Accidentsand Radioactive Contamination Using Scintillators
199
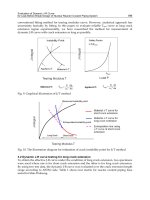
Fig. 15. Streak camera image of the fluorescence from ZnO. This is a 50000-shot integrated
signal excited by 56 nm. The vertical axis is wavelength (nanometer) and the horizontal axis
is time (nanosecond). The dominant fluorescence peak was centered at around 380 nm.
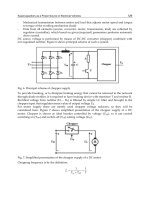
Fig. 16. Temporal profiles of the ZnO fluorescence excited by (a) 51nm, (b) 56nm, and (c) 61
nm. The observed profiles can be fitted by double exponential decays described as I=A
1
exp(−t/
1
)+A
2
exp(−t/
2
) (dotted line). The fitting parameters are A
1
=0.75, A
2
=0.25,
1
=70ps, and
2
=222ps.The estimated instrumental function was plotted with a dot line in
each graph. (d) Slit image (dotted line) and a calculated curve of a convolution of the slit
image and a normal distribution function (solid line).
Nuclear Power – Operation, Safety and Environment
200
Initially, the response time of Fe-ion doped ZnO scintillator was evaluated using the third
harmonics of a mode-locked Ti:sapphire femtosecond laser at 290nm. The typical band-to-
band ultraviolet fluorescence at 380nm was successfully observed, with a decay time of
~80ps. This is significantly faster compared with the previously reported 1-ns decay time for
the 380-nm fluorescence of undoped ZnO. The 1x1cm
2
, 0.5-mm thick double-side polished
ZnO crystal was mounted in a vacuum chamber, and the third harmonics of a neodymium-
doped YAG (Nd:YAG) laser was initially used as excitation for alignment purposes. The
sample was illuminated from the backside, in a counter propagation configuration with the
beam path of the SCSS test accelerator, as shown in Fig. 14. The SCSS test accelerator having
200-fs pulse duration, 10-µJpulse energy, and 20-Hz repetition rate, was focused by an
oblique mirror (Mimura et al., 2008). With a mirror focal length of 1m, the spot size at the
focus was about 20 µm. To minimize the risk of damage, however, the sample was placed 5
cm away from focus, and the radius of the beam at this location was estimated to be 500 µm.
The emission wavelength of the SCSS test accelerator can be tuned from 51 to 61 nm.
Fluorescence was collected and focused to the entrance slit of a spectrograph using quartz
lenses. The fluorescence spectrum and the lifetime of the ZnO sample were measured using
a 25-cm focal-length spectrograph (groovedensity600gr/mm) coupled to a streak camera
unit (HAMAMATSUC1587) and a charge coupled device camera.
The ZnO fluorescence, excited by light pulses of the SCSS test accelerator at 51, 56, and 61
nm with 50000 shots was measured using the spectrograph coupled to the streak camera
system. Figure 15 shows the streak camera image of the fluorescence using 56-nm excitation
from the SCSS test accelerator. The dominant fluorescence peak was centered at around 380
nm (Chen et al., 2000). The temporal profiles of this image at 51-, 56-, and61-nm excitation
are shown in Figs. 16(a)–10(c), respectively. The measured decay profiles can be well-fitted
to a double exponential decay with time constants of 70 and 222 ps for the fast and slow
decay-time constants, respectively. These two decay constants have been previously
reported in several works involving UV-excited ZnO single crystals, where the fast decay
time is attributed to the lifetime of free excitons, while the slower decay time is assigned to
trapped carriers (Wilkinson et al., 2004). This measured response time is currently the fastest
for a scintillator operating in the 50–60 nm region. In addition, the fluorescence intensity and
time decay profile appears to be independent of the excitation wavelength within the 50–60
nm range. This flat response makes the Fe-doped ZnO scintillator ideal for operation both
for UV and in soft x-ray excitation schemes.
5.3.2 Neodymium-doped lanthanum fluoride (Nd
3+
:LaF
3
)
Scintillators in the vacuum ultraviolet (VUV) region are continuously being developed for
various applications. In this section, the scintillation properties of Nd
3+
:LaF
3
is discussed.
Characterization was performed by exciting the sample with the third harmonics of a
Ti:sapphire regenerative amplifier having 1-KHz repetition rate, 10-J pulse energy, and
200-fs pulse duration. The excitation wavelength in this case is at 290 nm; while the reported
fluorescence wavelength of Nd
3+
:LaF
3
is at 175 nm. With the unavailability of ultrashort-
pulse EUV sources, we attempt to demonstrate the scintillation properties of this crystal for
ultrafast excitation using possibly a multiphoton process. Spectroscopic studies have
revealed that the absorption edge of this crystal is at ~168 nm (Nakazato et al., 2010a).
Pulses were focused by a 20-cm lens onto the sample inside a vacuum chamber. A VUV
spectrometer and streak camera system was used to evaluate fluorescence from this sample.
Imaging of Radiation Accidentsand Radioactive Contamination Using Scintillators
201
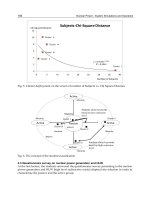
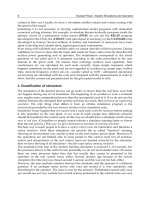
The streak camera image of fluorescence is shown in Fig. 17 (a). The streak camera image of
the 290-nm, fs excitation is also shown in the same figure as Fig. 17 (b) for reference. On the
other hand, the spectral and temporal profile obtained by sweeping across the vertical axis
is shown in Fig. 18. The fluorescence peak is centered at around 175 nm with a decay time of
about 7.1 ns.
The absorption spectrum of the sample from 200 to 400 nm revealed the presence of
multiple absorption bands, particularly at 290 nm. Moreover, the slope of fluorescence
intensity as a function of pump fluence was experimentally verified to be equal to unity. In
this aspect, frequency up-conversion by energy transfer could have been the governing
mechanism [3], owing to the absorption band at 290 nm. Since fluorides have low phonon
energies, the lifetimes of intermediate levels are long enough (order of μs) for the
accumulation of electrons in an intermediate excited state. Existing solid-state, inorganic
scintillators in the ultraviolet region typically have decay times of a few tens of
nanoseconds. As such, the Nd
3+
:LaF
3
fluorescence decay time of about 7.1 ns would be
among the fastest solid-state, inorganic scintillators.
Fig. 17. (a) Streak camera image of fluorescence from a cuboid Nd
3+
:LaF
3
excited by 290-nm
femtosecond pulses shown in (b).
Fig. 18. (a) Spectral and (b) temporal profiles of the fluorescence shown in Fig. 17 (a).
(a)
(b)
(a)
(b)
Nuclear Power – Operation, Safety and Environment
202
6. Conclusion
In the field of fusion research, understanding the plasma dynamics could very well be the key
in feasibly attaining controlled fusion. The time-resolved fluorescence spectra of Ce:LLF when
excited by SRFEL tuned at 243 nm and 216 nm and by the 290-nm emission of a Ti:sapphire
laser were measured to determine the feasibility of using this material as a scintillator for fast-
ignition laser fusion. Two peaks were observed, one at 308 and another at 329 nm, which can
be attributed to transitions from the lowest energy level of the 4f
2
5d excited state configuration
to one of the two energy levels in the 4f
3
ground state configuration of Ce
3+
. The relatively flat
spectral and temporal response across its absorption bands makes Ce:LLF an attractive
scintillator material for various excitation sources. Scintillation decay time of Ce:LLF might be
few ns slower, however, it is still acceptable for measurements of ignition timing in fast-
ignition, inertial confinement nuclear fusion using laser.
In response to the need for a fast-response scintillator for precise time-resolved radiation
measurement, we have succeeded in developing a fast-response
6
Li glass scintillator
material suitable for scattered neutron diagnostics of the ICF plasma, with a response time
of about 20 ns. Using this custom-developed material, fusion-originated neutrons were
successfully observed using the GEKKO XII laser at the Institute of Laser Engineering,
Osaka University. These results could pave the way for a new class of scintillator devices,
optimized for neutron detection. In particular, after proper growth and device design
considerations are carried out, future discrimination between primary and low-energy
scattered neutrons using this material could be realized.
Due to the increasing demand for scintillators with fast response time, several materials are
currently being investigated. In this aspect, vacuum ultraviolet fluorescence from a
Nd
3+
:LaF
3
crystal excited by 290 nm femtosecond pulses from a Ti:sapphire laser is reported.
Peak emission at 175 nm with 7 ns lifetime is observed. This decay time would be one of the
fastest among fluoride scintillators. On the other hand, a hydrothermal-method grown ZnO
scintillator exhibited an over one-order of magnitude faster response time by intentional Fe
ion doping. The rise and decay time constants of the fluorescence are measured to be less
than 10 ps and 100 ps, respectively. Its fluorescence is also sufficiently bright to be detected
by a streak-camera system even in single shot mode without any accumulation.
Meanwhile, mapping of radiation sources is very useful to detect and characterize invisible
radiation accidents and/or radioactive contamination. For this purpose, bundles composed
of well-designed and regularly arranged scintillation fiber-segments or thin cylinders have
been developed to detect and display the radiation sources as a map, using the directional
sensitivity of the segments or cylinders for locating sources of incident radiation. In this
case, the more important attribute would be scintillation intensity, regardless of decay time,
since available moving picture systems are usually 30 frames per second. A bundle
composed of several kinds of thin cylinder or fiber segment scintillators has appropriate
sensitivity for several kinds of incident radiation and thus serves as a panchromatic
detector; whereas a bundle made from a single type of scintillator functions as a
monochromatic detector. By combining several types of scintillating elements into a bundle,
we have developed a “panchromatic” detector that is suitable for use against radiation from
different types of sources.
7. Acknowledgment
Work on Pr
3+
-doped glass scintillator was supported by the Japan Society for the Promotion
of Science under the contracts of Grant-in-Aid for Scientific Research (S) (GrantNo.18106016),
Imaging of Radiation Accidentsand Radioactive Contamination Using Scintillators
203
Grant-in-Aid on Priority Area (GrantNo.16082204),Open Advanced Research Facilities
Initiative, and Research Fellowship for Young Scientists (GrantNo.3273).
Work on Ce:LLF was in part performed by auspice of MEXT Japanese Ministry of
Education, Culture, Sports, Science, and Technology project on “Development of Growth
Method of Semiconductor Crystals for Next Generation Solid-State Lighting” and “Mono-
energetic quantum beam science with PW lasers” and Scientific Research Grant-in Aid
(17656027) from the MEXT. The results were achieved under the joint research project of the
Institute of Laser Engineering at Osaka University, Extreme Photonics project from the
Institute for Molecular Science.
For the work on ZnO, we are also grateful to the SCSS Test Accelerator Operation Group at
RIKEN for continuous support in the course of the studies and Fukuda Crystal Laboratory
for support in sample preparation.
8. References
Arikawa, Y., Yamanoi, K., Nakazato, T., Estacio, E. S., Shimizu, T., Sarukura, N., Nakai, M.,
Norimatsu, T., Azechi, H., Murata, T., Fujino, S., Yoshida, H., Kamada, K., Usuki,
Y., Suyama, T., Yoshikawa, A., Sato, N., & Kan, H. (2009), Pr3+-doped fluoro-oxide
lithium glass as scintillator for nuclear fusion diagnostics, Review of Scientific
Instruments, Vol. 80, Issue 11, (November 2009), pp. 113504-113504-4, ISSN: 0034-
6748
Azechi, H., Jitsuno, T., Kanabe, T., Katayama, M., Mima, K., Miyanaga, N., Nakai, M., Nakai,
S., Nakaishi, H., Nakatsuka, M., Nishiguchi, A., Norrays, P. A., Setsuhara, Y.,
Takagi, M., & Yamanaka, M. (1991). High-density compression experiments at ILE,
Osaka, Laser and Particle Beams, Vol. 9, Issue 2, (June 1991), pp.193–207, ISSN: 0263-
0346
Cadatal, M., Seo, Y.S., Ono, S., Furukawa, Y., Estacio, E., Murakami, H., Fujimoto, Y.,
Sarukura, N., Nakatsuka, M., Suyama, T., Fukuda, K., Simura, R., & Yoshikawa. A.
(2007), Nd3+:(La1-xBax)F3-x Grown by Micro-Pulling Down Method as Vacuum
Ultraviolet Scintillator and Potential Laser Material, Japanese Journal of Applied
Physics, Vol. 46, No. 40, (October 2007), pp. L985-L987, ISSN: 0021-4922
Cadatal, M., Furukawa, Y., Seo, Y. S., Ono, S., Estacio, E., Murakami, H., Fujimoto, Y.,
Sarukura, N., Nakatsuka, M. , Fukuda, K., Simura, R., Suyama, T., Yoshikawa, A.,
& Saito, F. (2008), Vacuum ultraviolet optical properties of a micro pulling-down-
method grown Nd3+:(La0.9,Ba0.1)F2.9, Journal of the Optical Society of America B,
Vol. 25, No. 7 (July 2008), pp. B27-B31, ISSN: 0740-3224
Cheon, M. S., Pac, S., Lee, F. G., Bertalot, L., & Walker, C. (2008). In-vessel design of ITER
diagnostic neutron activation system, Review of Scientific Instruments, Vol. 79, Issue
10, (October 2008), pp.10E505-10E505-3, ISSN: 0034-6748
Combes, C. M., Dorenbos, P., van Eijk, C. W. E., Pedrini, C., DenHartog, H. W., Gesland, J.
Y., & Rodnyi. P. A. (1997). Optical and scintillation properties of Ce3+ doped LiYF4
and LiLuF4 crystals, Journal of Luminescence, Vol. 71, Issue 1, (January 1997), pp. 65-
70, ISSN: 0022-2313
Dubinskii, M.A., Abdulsabirov, R.Y., Korableva, S.L., Naumov, A.K., & Semashko, V.V.
(1992). New solid-state active medium for tunable ultraviolet lasers, Proceedings of
the 18th International Quantum Electronics Conference, Moscow, Russia, June 1992
Nuclear Power – Operation, Safety and Environment
204
Ehrlich, D., Moulton, P., & Osgood, R. (1979). Ultraviolet solid-state Ce:YLF laser at 325 nm,
Optics Letters, Vol. 4, Issue 6, (Jun 1979), pp. 184-186, ISSN: 0146-9592
Fairley, E. J. & Spowart, A. R. (1978). Neutron Scintillating Glasses Part Iii Pulse Decay Time
Measurements At Room Temperature, Nuclear Instruments and Methods, Vol. 150,
Issue 2, (April 1978), pp. 159-163, ISSN: 0168-9002
Fukuda, T. & Chani, V. I. (2007). In: Shaped Crystals, Tsuguo Fukuda & Valery I.Chani, pp. ,
Springer-Verlag, ISBN: 978-3-540-71294-7, Berlin Heidelberg New York
Fukuda, T., Rudolph, P. & Uda, S. (2004). In: Fiber Crystal Growth from Melt, Tsuguo Fukuda
Peter Rudolph Satoshi Uda, pp. ,Springer-Verlag, ISBN: 3-540-40596-8, Berlin
Heidelberg New York
Glebov, V. Yu., Meyerhofer, D. D., Sangster, T. C., Stoeckl, C., Roberts, S., Barrera, C. A.,
Celeste, J. R., Cerjan, C. J., Dauffy, L. S., Eder, D. C., Griffith, R. L., Haan, S. W.,
Hammel, B. A., Hatchett, S. P., Izumi, N., Kimbrough, J. R., Koch, J. A., Landen, O.
L., Lerche, R. A., MacGowan, B. J., Moran, M. J., Ng, E. W., Phillips, T. W., Song, P.
M., Tommasini, R., Young, B. K., Caldwell, S. E., Grim, G. P., Evans, S. C., Mack, J.
M., Sedillo, T. J., Wilke, M. D., Wilson, D. C., Young, C. S., Casey, D., Frenje, J. A.,
Li, C. K., Petrasso, R. D., Séguin, F. H., Bourgade, J. L., Disdier, L., Houry, M.,
Lantuejoul, I., Landoas, O., Chandler, G. A., Cooper, G. W., Leeper, R. J., Olson, R.
E., Ruiz, C. L., Sweeney, M. A., Padalino, S. P., Horsfield, C., & Davis, B. A. (2006).
Development of nuclear diagnostics for the National Ignition Facility (invited),
Review of Scientific Instruments, Vol. 77, Issue 10, (October 2006), pp. 10E715-1-
10E715-7, ISSN: 0034-6748
Hosaka, M., Koda, S., Katoh, M., Yamazaki, J., Hayashi, K., Takashima, K., Gejo, T., & Hama,
H. (2002). From the operation of an SRFEL to a user facility, Nuclear Instruments and
Methods in Physics Research Section A: Accelerators, Spectrometers, Detectors and
Associated Equipment, Vol. 483, Issues 1-2, (May 2002), pp. 146-151, ISSN: 0168-9002
Ishii, M. & Kobayashi M. (1991). Single crystals for radiation detectors. Progress in Crystal
Growth and Characterization, Vol. 23, (1992), pp. 245-311, ISSN: 0960-8974
Izumi, N., Lerche, R. A., Phillips, T. W., Schmid, G. J., Moran, M. J., Koch, J. A., Azechi, H., &
Sangster, T. C. (2002). Development of a gated scintillation fiber neutron detector
for areal density measurements of inertial confinement fusion capsules, Review of
Scientific Instruments, Vol. 74, Issue 3, (March 2003), pp. 1722–1725, ISSN: 0034-6748
Kobayashi, M & Ishii, M. (2007). Chapter 7 Phosphors for X-ray and ionizing radiation, In:
Phosphor handbook, William M. Yen , Shigeo Shionoya & Hajime Yamamoto, pp.
619-633, CRC Press, ISBN 978-084-9335-64-8, Florida, USA
Lerche, R. A., Phillion, D. W., & Tietbohl, L. (1994). 25 ps neutron detector for measuring
ICF-target burn history, Review of Scientific Instruments, Vol. 66, Issue 1, (January
1995), pp. 933–935, ISSN: 0034-6748
Liu, Z., Shimamura, K., Nakano, K., Mujilatu, N., Fukuda, T., Kozeki, T., Ohtake, H., &
Sarukura, N. (1999). Direct Generation of 27-mJ, 309-nm Pulses from a
Ce3+:LiLuF4 Oscillator Using a Large-Size Ce3+:LiLuF4 Crystal, Japanese Journal of
Applied Physics, Vol. 39, No. 2A, (February 2000), pp. L88-L89, ISSN: 0021-4922
Murata, T., Fujino, S., Yoshida, H., Arikawa, Y., Nakazato, T., Shimizu, T., Sarukura, N.,
Nakai, M., Norimatsu, T., Azechi, H., Kamada, K., Usuki, Y., Suyama, T.,
Yoshikawa, A., Sato, N., & Kan, H. (2010). Custom-Designed Fast-Response
Praseodymium-Doped Lithium 6 Fluoro-Oxide Glass Scintillator With Enhanced
Imaging of Radiation Accidentsand Radioactive Contamination Using Scintillators
205
Cross-Section for Scattered Neutron Originated From Inertial Confinement Fusion,
IEEE Transactions on Nuclear Science, Vol. 57, No. 3, (June 2010), pp. 1426-1429,
ISSN: 0018-9499
Nakazato, T., Cadatal-Raduban, M., Furukawa, Y., Pham, M., Estacio, E., Shimizu, T.,
Sarukura, N., Fukuda, K., Suyama, T., Yanagida, T., Yokota, Y., Yoshikawa, A., &
Saito, F. (2010), Nd3+:LaF3 as a Step-Wise Excited Scintillator for Femtosecond
Ultraviolet Pulses, IEEE Transactions On Nuclear Science, Vol. 57, Issue 3, (June
2010), pp. 1208-1210, ISSN: 0018-9499
Nakazato, T., Furukawa, Y., Cadatal-Raduban, M., Pham, M., Tatsumi, T., Saiki, A.,
Arikawa, Y., Sarukura, N., Nishimura, H., Azechi, H., Mima, K., Fukuda, T.,
Hosaka, M., Katoh, M., & Kosugi, N. (2010), Systematic Study on Ce:LuLiF4 as a
Fast Scintillator Using Storage Ring Free-Electron Lasers, Japanese Journal of Applied
Physics, Vol. 49, No. 12, (December 2010), pp. 122602-122602-4, ISSN: 0021-4922
Ogawa, T. (2007). Patent Application PCT/JP2007/062817
Ogawa, T., Sarukura, N., Watanabe, M., Fukuda, T., Nango, N. (2010), Two dimensional
imaging of radiation accidents and radioactive contamination, Optical Materials,
Vol. 32, Issue 7, (May 2010), pp. 753-755, ISSN: 0925-3467
Petrizzi, L., Barnsley, R., ertalot, L., Esposito, B., Haskell, H., Mainardi, E., Marocco, D.,
Podda, S., Walker, C., & Villari, S. (2007). Neutronic design of the ITER radial
neutron camera, Fusion Engineering and Design, Vol. 82, Issues 5-14, (October 2007),
pp.1308–1314, ISSN: 0920-3796
Rambaldi, P., Moncorge, R., Wolf, J. P., Pedrini, C., & Gesland, J. Y. (1998). Efficient and
stable pulsed laser operation of Ce:LiLuF4 around 308 nm, Optics Communications,
Vol. 146, Issues 1-6, (January 1998), pp. 163-166, ISSN: 0030-4018
Ranieri, I. M., Shimamura, K., Nakano, K., Fujita, T., Liu, Z., Sarukura, N., & Fukuda, T.
(2000). Crystal growth of Ce : LiLuF4 for optical applications, Journal of Crystal
Growth, Vol. 217, Issue 1-2, (July 2000), pp. 151-156, ISSN: 0022-0248
Ress, D., Lerche, R. A., Ellis, R. J., & Lane, S. M. (1988). Neutron imaging of inertial
confinement fusion targets at Nova, Review of Scientific Instruments, Vol. 59, Issue 8,
(August 1988), pp. 1694–1696, ISSN: 0034-6748
Saint-Gobain Ceramics & Plastics, Inc. (2007-2008). Lithium glass scintillators, In: Saint-
Gobain Ceramics & Plastics, Inc., March 4, 2011, Available from:
<
Sarukura, N., Dubinskii, M.A., Liu, Z., Semashko, V.V., Naumov, A.K., Korableva, S.L., Yu
Abdulsabirov, R., Edamatsu, K., Suzuki, Y., Itoh, T., & Segawa, Y. (1995). Ce3+-
activated fluoride crystals as prospective active media for widely tunable
ultraviolet ultrafast lasers with direct 10-ns pumping, IEEE Journal of Selected Topics
in Quantum Electronics, Vol. 1, Issue 3, (September 1995), 792-804, ISSN: 1077-260X
Sarukura, N., Liu, Z., Segawa, Y., Edamatsu, K., Suzuki, Y., Itoh, T., Semashko, V. V.,
Naumov, A. K., Korableva, S. L., Abdulsabirov, R. Yu., & Dubinskii, M. A. (1995),
Ce3+:LuLiF4 as a broadband ultraviolet amplification medium, Optics Letters, Vol.
20, No. 3 (February 1995), pp. 294-296, ISSN: 0146-9592
Sarukura, N., Liu, Z., Izumida, S., Dubinskii, M.A., Abdulsabirov, R.Y., Korableva, A.K., &
Stella, L. (1998) All-Solid-State Tunable Ultraviolet Subnanosecond Laser with
Direct Pumping by the Fifth Harmonic of a Nd:YAG laser, Applied Optics, Vol. 37,
Issue 27, (September 1998), pp. 6446-6448, ISSN: 1559-128X
Nuclear Power – Operation, Safety and Environment
206
Shimizu, T., Yamamoi, K., Estacio, E., Nakazato, T., Sakai, K., Sarukura, N., Ehrentraut, D.,
Fukuda, T., Nagasono, M., Togashi, T., Higashiya, A., Yabashi, M., Ishikawa, T.,
Ohashi, H., & Kimura H. (2010), Response-time improved hydrothermal-method-
grown ZnO scintillator for soft x-ray free-electron laser timing-observation, Review
of Scientific Instruments, Vol. 81, Issue 3, (March 2010), pp. 033102-1 033102-4,
ISSN: 0034-6748
Suzuki, Y., Kozeki, T., Ono, S., Murakami, H., Ohtake, H., Sarukura, N., Nakajyo, T., Sakai,
F., & Aoki, Y. (2002). Hybrid time-resolved spectroscopic system for evaluating
laser material using a table-top-sized, low-jitter, 3-MeV picosecond electron-beam
source with a photocathode, Applied Physics Letters, Vol. 80, Issue.18, (May 2002),
pp. 3280-3282, ISSN: 0003-6951
Tanaka, K. A., Kodama, R., Kitagawa, Y., Kondo, K., Mima, K., Azechi, H., Chen, Z., Fujioka,
S., Fujita, H., Johzaki, T., Lei, A., Matsuoka, T., Miyanaga, N., Nagai, K., Nagatomo,
H., Nishimura, H., Norimatsu, T., Shigemori, K., Shiraga, H., Tanpo, M., Tohyama,
Y., Yabuuchi, T. , Zheng, J., Izawa, Y., Norreys, P. A., Stephens, R., & Hatchett, S.
(2004). Progress and perspectives of fast ignition, Plasma Physics And Controlled
Fusion, Vol. 46, No. 12B, (December 2004), pp. B41–B49, ISSN: 0741-3335
Van Eijk, C.W.E., Andriessen, J., Dorenbos, P., Visser, R. (1994). Ce3+ doped inorganic
scintillators, Nuclear Instruments and Methods in Physics Research Section A:
Accelerators, Spectrometers, Detectors and Associated Equipment, Vol. 348, Issues 2-3,
(September 1994), pp. 546-550, ISSN: 0168-9002
Yamanoi, K., Sakai, K., Nakazato, T., Estacio, E., Shimizu, T., Sarukura, N., Ehrentraut, D.,
Fukuda, T., Nagasono, M., Togashi, T., Matsubara, S., Tono, K., Yabashi, M.,
Kimura, H., Ohashi, H., Ishikawa, T. (2010), Response-time improved
hydrothermal-method-grown ZnO scintillator for XFEL timing-observation, Optical
Materials, Vol. 32, Issue 10, (August 2010), pp.1305-1308, ISSN: 0925-3467
Yoshikawa, A., Kamada, K., Saito, F., Ogino, H., Itoh, M., Katagiri, T., Iri, D., & Fujita, M.
(2008). Energy Transfer to Pr3+ Ions in Pr:Lu3 Al5O12 (LuAG) Single Crystals,
IEEE Transactions on Nuclear Science, Vol. 55, No. 3, (June 2008), pp.1372-1375, ISSN:
0018-9499
Zen, H., Adachi, M., Hayashi, K., Katoh, M., Yamazaki, J., Tanikawa, T., Hosaka, M., Koike,
M., Taira, Y., Uno, Y., & Yamamoto, N. (2009). Design Study of THz & VUV
Coherent Source by Laser Seedomg at UVSOR-II, Proceedings of Free Electron Laser
(FEL) Conference 2009, Liverpool, UK, August 2009
10
Simulation of Ex-Vessel Steam Explosion
Matjaž Leskovar
Jožef Stefan Institute
Slovenia
1. Introduction
A steam explosion is a type of a fuel-coolant interaction (FCI), which results from the rapid
and intense heat transfer that may follow the interaction between the molten material and
the coolant (Berthoud, 2000; Corradini et al., 1988; Sehgal et al., 2008; Turland and Dobson,
1996). Such an interaction can occur when the melt is poured into the coolant, when the
coolant is injected into the melt or when the melt and the coolant interact as stratified layers.
As seen in Fig. 1, the steam explosion phenomenon is divided into the premixing and
explosion phase. The explosion phase is further commonly divided into the triggering,
propagation and expansion phases. The premixing phase covers the interaction of the melt
with the coolant prior the steam explosion. At the interaction the coolant vaporizes around
the melt-coolant interface, creating a vapour film (i.e. film boiling regime due to high melt
temperature). The system may remain in the meta-stable state for a period ranging from a
tenth of a second up to a few seconds. During this time the continuous melt (e.g. jet) is
fragmented into melt droplets of the order of several mm in diameter, which may be further
fragmented by the coarse break up process into melt droplets of the order of mm in
diameter. If during the meta-stable state a local vapour film destabilization occurs, the steam
explosion may be triggered due to the melt-coolant contact. A spontaneous destabilization
could occur due to random processes or other reasons, e.g. when the melt contacts
surrounding structures or if the water entrapped in the melt is rapidly vaporised. The
destabilization can be induced artificially by applying an external trigger (e.g. chemical
explosion, high pressure gas capsule). The destabilization causes the fine fragmentation of
the melt droplets into fragments of the order of some 10 µm in diameter. The fine
fragmentation process rapidly increases the melt surface area, vaporizing more coolant and
increasing the local vapour pressure. This fast vapour formation due to the fine
fragmentation spatially propagates throughout the melt-coolant mixture causing the whole
region to become pressurized by the coolant vapour. If the concentration of the melt in the
mixture is large enough and enough coolant is available, then the propagation velocity of
the interaction front may rapidly escalate and the interaction may be sustained by energy
released behind the interaction front. Subsequently, the high pressure region behind the
interaction front expands and performs work on its surrounding. The time scale for the
steam explosion phase itself is in the order of ms.
Major limitations of the steam explosion strength are due to:
The limitation of the mass of the melt in the premixture. The mass of the melt in the
premixture is limited due to the incomplete melt inflow and the incomplete melt
fragmentation.
Nuclear Power – Operation, Safety and Environment
208
The void production in the premixing phase. The presence of void hinders the steam
explosion propagation and escalation due to the void compressibility and due to water
depletion.
The melt solidification during the premixing phase. The fine fragmentation during the
explosion phase is limited due to the solidification of melt droplets.
Fig. 1. Schematic illustration of the processes during the steam explosion phenomenon,
starting with the melt pour into the coolant.
1.1 Steam explosion issue and nuclear safety
A steam explosion may occur during a hypothetical core melt accident in a light water
reactor (LWR) nuclear power plant, when the molten corium interacts with the water
(Corradini et al., 1988; Sehgal, 2006; Sehgal et al., 2008; Theofanous, 1995). Potentially severe
Simulation of Ex-Vessel Steam Explosion
209
dynamic loadings on surrounding systems, structures and components could be induced by
pressure peaks in the order of 100 MPa and duration in the order of ms. Steam explosions
can therefore jeopardize the reactor vessel and the containment integrity (Esmaili and
Khatib-Rahbar, 2005). Direct or by-passed loss of the containment integrity can lead to
radioactive material release into the environment, threatening the safety of the general
public. Consequently, the understanding of the steam explosion phenomenon is very
important for nuclear safety.
As seen in Fig.2, several FCI situations in LWR were identified in which a steam explosion
could occur (Sehgal et al., 2008). An in-vessel FCI could occur when the molten corium is
poured into water in the lower head of the reactor pressure vessel (poured FCI) or when the
relocated melt in the lower head is flooded (stratified FCI). In-vessel FCI may result in a
steam explosion which causes the failure of the upper or lower head of the pressure vessel.
When the molten corium melts through the vessel, the melt is poured into the cavity. An ex-
vessel steam explosion can occur if the cavity is already filled with water (poured FCI) or if
the cavity is flooded after the relocation of the melt in the cavity (stratified FCI).
Fig. 2. Various FCI scenarios in LWR reactors.
In the past, the issue of in-vessel steam explosions causing the upper head failure of the
reactor vessel was mainly concerned in LWR (WASH-1400, 1975). In this so called alpha
mode containment failure it is considered that the ejected upper head could endanger the
containment integrity. International reviews of the alpha mode failure probability and
experimental investigations have indicated that the upper head and bolts can withstand the
in-vessel steam explosion (Corradini et al., 1988; Krieg et al., 2003; Sehgal et al., 2008).
The importance of the poured in-vessel and ex-vessel steam explosions was recognized also
by the OECD (Organisation for Economic Co-operation and Development), which started
the SERENA (Steam Explosion Resolution for Nuclear Applications) Phase 1 research
programme in the year 2002 (OECD/NEA, 2007). The objective of the SERENA programme
was to evaluate the capabilities of FCI codes in predicting steam explosion induced loads,
reaching consensus on the understanding of important FCI processes relevant to the reactor
simulations, and to propose confirmatory research to bring the predictability of steam
explosion energetics to required levels for risk management. Two main outcomes were
obtained. First, the calculated loads are far below the capacity of a typical intact reactor
vessel in case of an in-vessel steam explosion. However, for ex-vessel poured steam
explosions the programme outcome was that the calculated loads are partly above the
Nuclear Power – Operation, Safety and Environment
210
capacity of typical reactor cavity walls. But due to the large scatter of the simulation results,
which reflects the deficiency in the steam explosion phenomenon understanding and
uncertainties on modelling and scaling, the safety margins for ex-vessel steam explosions
could not be quantified reliably. To resolve the remaining open issues on the FCI processes
and their effect on ex-vessel steam explosion energetics, the SERENA Phase 2 was launched
at the end of the year 2007 (OECD/NEA, 2008). The main objective is to reduce the
uncertainties on the coolant void and the material effect in FCI. The second phase comprises
an experimental and an analytical program. The aim of the experimental program is to
clarify the nature of prototypic material having mild steam explosion characteristics and to
provide innovative experimental data for code validation, aiming to reduce the scatter of
code predictions and to enhance the geometrical extrapolation capabilities of FCI codes to
cover reactor situations. The aim of the comprehensive analytical program is to increase the
capability of FCI models and codes for use in reactor analyses.
Due to the high risk significance of the steam explosion phenomenon for the containment
integrity, the ex-vessel FCI issue is one of the six high priority safety issues, which were
identified in the EU (European Union) network of excellence SARNET (Severe Accident
Research NETwork of Excellence) Phase 1 (Albiol et al., 2008; Schwinges et al., 2010). The
purpose of the SARNET network of excellence, which was founded in the year 2004, is to
integrate European research capabilities on severe accidents in order to enhance the safety
for the existing and future nuclear power plants. In the beginning of the year 2009 the
follow-up SARNET Phase 2 was started. The purpose of the second phase is to focus on
those safety issues, which were classified with high priority in the first phase. Beside the
issue of ex-vessel FCI also the issues of the corium and debris coolability, the molten
corium-concrete interaction, the hydrogen mixing and combustion in the containment and
the source term are investigated.
The issue of stratified steam explosions is not considered being as important as steam
explosions occurring after the pouring of the melt into water. Namely, the mass of the melt
which can participate in the mixing process is limited in stratified cases if compared with
the premixture melt mass in pouring cases (Sehgal et al., 2008).
The final goal of the FCI research related to nuclear safety is to bring the predictability of the
steam explosion strength to required levels for the risk assessment in LWR. This is necessary
for the risk management to be able to implement the optimal severe accident management
approaches (e.g. flooding of reactor cavity, in-vessel retention, core catcher).
This chapter focuses on the simulation of poured ex-vessel steam explosions, which are of
greatest interest. With the FCI code MC3D (Meignen and Picchi, 2005) different scenarios of
ex-vessel steam explosions in a typical pressurized water reactor cavity were analyzed to get
additional insight in the ex-vessel steam explosion behaviour and the resulting pressure
loads. A parametric study was performed varying the location of the melt release (central,
right and left side melt pour), the cavity water subcooling, the primary system overpressure
at vessel failure and the triggering time for explosion calculations. The main purpose of the
study was to establish the influence of the varied parameters on the FCI behaviour, to
determine the most challenging cases and to estimate the expected pressure loadings on the
cavity walls. For the most challenging central, right side and left side melt pour scenarios,
according to the performed simulations, a detailed analysis of the explosion simulation
results was performed. In addition, the influence of the jet breakup modelling and the melt
droplets solidification on the FCI process was analyzed.
Simulation of Ex-Vessel Steam Explosion
211
First, the applied FCI modelling approach is described and the analyzed ex-vessel FCI
scenarios are given. Then the various premixing and explosion phase simulation results are
presented and the most challenging cases established. For the most challenging cases a more
detailed analysis is provided. Finally, for the most challenging central melt pour case the
influence of the jet breakup modelling and the melt droplets solidification on the simulation
results is analyzed and discussed.
2. Modelling
The simulations were performed with the MC3D computer code, which is being developed
by IRSN, France (Meignen and Picchi, 2005). MC3D is a multidimensional Eulerian code
devoted to study multiphase and multi-constituent flows in the field of nuclear safety. It has
been built with the FCI calculations in mind. It is, however, able to calculate very different
situations and has a rather wide field of potential applications. MC3D is a set of two FCI
codes with a common numeric solver, one for the premixing phase and one for the
explosion phase (i.e. triggering phase, propagation phase and initial stage of expansion
phase). In general, the steam explosion simulation with MC3D is being carried out in two
steps. In the first step, the distributions of the melt, water and vapour phases at steam
explosion triggering are calculated with the premixing module. And in the succeeding
second step, the escalation and propagation of the steam explosion through the premixture
are calculated with the explosion module, using the premixing simulation results as initial
conditions and applying a trigger.
The MC3D premixing module focuses on the modelling of the molten fuel jet, its
fragmentation into large drops, the coarse fragmentation of these drops and the heat
transfer between the melt and the coolant (Meignen, 2005). The fuel is described by two
fields, the “continuous” fuel field (e.g. fuel jet or molten pool) and the “droplets” fuel field
(melt droplets), considering the possible continuous or dispersed state of the fuel. The fuel is
transferred between both fields during jet breakup and coalescence. In MC3D two jet
breakup models are provided, a global model and a local model. In the global model the jet
fragmentation rate is deduced from the comparison to a standard case (i.e. typical
conditions in FARO experiments (Magallon and Huhtiniemi, 2001)) and the size of the
created droplets is a user parameter. In the local model the jet fragmentation rate and the
size of the created droplets are calculated based on local velocities applying the Kelvin
Helmholtz instability model. Since the local model is very sensitive and in the process of
being improved, the reference calculations were performed using the global jet breakup
model. The diameter of the created droplets was set to 4 mm, what is the typical size of the
melt droplets in the FARO experiments (Magallon and Huhtiniemi, 2001).
The explosion module focuses on the fine fragmentation of the melt droplets, generated
during premixing, and the heat exchange between the produced fragments and the coolant
(Meignen, 2005). In this module the “continuous” fuel field is not present, but there are two
fields related to the dispersed fuel, i.e. the “droplets” fuel field and the “fragments” fuel
field. During the fine fragmentation process the fuel is transferred from the “droplets” field
to the “fragments” field. Both fine fragmentation processes, i.e. thermal fragmentation,
resulting from the destabilization of the vapour film around the melt droplets, and
hydrodynamic fragmentation, resulting from the velocity differences between the melt
droplets and the surrounding medium, are considered. The diameter of the created
fragments, which is a user parameter, was set to the code standard value 100 µm, which is
Nuclear Power – Operation, Safety and Environment
212
based on KROTOS experiments (Huhtiniemi et al., 1999). The explosion is triggered by
applying a user defined initial local pressure pulse. The trigger pressure was set to 2 MPa
and prescribed to a single mesh cell, as explained in Section 3.1. Simulations showed that the
triggering strength has no significant influence on the explosion strength, once the trigger is
strong enough that it can trigger the explosion.
In MC3D it is conservatively assumed that the melt droplets are completely molten if their
bulk temperature is higher than the corium solidus temperature. This overpredicts the
ability of corium droplets to efficiently participate in the explosion, since in reality, during
premixing, a crust is formed on the corium droplets before the droplet bulk temperature
drops below the solidus temperature (Huhtiniemi et al., 1999; Dinh, 2007). This crust
inhibits the fine fragmentation process and if the crust is thick enough it completely
prevents it.
To be able to perform a series of simulations of different ex-vessel steam explosion
scenarios, the reactor cavity was modelled in a simplified 2D geometry, as is common
practise (Meignen et al., 2003; Kawabata, 2004; Esmaili and Khatib-Rahbar, 2005; Moriyama
et al., 2006; OECD/NEA, 2007). The 2D geometry has to be appropriately defined to assure
that the 2D simulation results reflect qualitatively and quantitatively as closely as possible
the conditions in a real 3D reactor cavity. Therefore, the simulations were performed with
two different 2D representations of a typical pressurized water reactor cavity: the 2D axial
symmetric model (Fig. 3) and the 2D slice model (Fig. 4). The 2D axial symmetric model is
limited on the treatment of axial symmetric phenomena in the cylindrical part of the reactor
cavity directly below the reactor pressure vessel and around it. Consequently, the venting
through the instrument tunnel cannot be directly considered, and therefore conservatively
was not considered. Contrary to the axial symmetric model, which treats only part of the
Reactor pressure vessel
Reactor cavity wall
Fig. 3. Geometry and mesh of 2D axial symmetric model of reactor cavity for central melt
pour. The scales in horizontal and vertical directions are different.
Simulation of Ex-Vessel Steam Explosion
213
reactor cavity, the 2D slice model treats the whole reactor cavity. However it does not take
into account the 3D geometry and the 3D nature of the phenomena. So the cylindrical part of
the reactor cavity and the cylindrical reactor pressure vessel are not treated as cylinders but
as planparallel infinite plates. A similar approach was applied by Esmaili and Khatib-
Rahbar (2005). In the 2D slice model the height of the cavity opening on the left side (Fig. 4)
was adjusted to match the opening area per reactor cavity width of the real 3D reactor cavity
geometry.
The cavity geometry and dimensions were set in accordance with a typical pressurized
water reactor cavity. In the models the dimensions of the cavity are: length x ≈ 10.5 m,
radius of cylindrical part r ≈ 2.5 m, height z ≈ 13 m, and the mesh sizes are: 2D axial
symmetric model—25×35 cells (Fig. 3), 2D slice model: right side melt pour—62×39 cells and
left side melt pour—77×39 cells (Fig. 4). In regions, which are more important for the
modelling of the FCI phenomena, the numerical mesh was adequately refined; therefore the
meshes for the right and left side melt pour are not identical (Fig. 4). The initial pressure in
the domain was set to the containment pressure and a constant pressure boundary condition
at the cavity openings was applied.
Right wall
Middle
wall
Left wall
Fig. 4. Geometry and mesh of 2D slice model of reactor cavity for left and right side melt
pour. The scales in horizontal and vertical directions are different.
3. Simulation
3.1 Simulated cases
In the performed ex-vessel steam explosion study, a spectrum of relevant scenarios has been
analyzed to establish the influence and importance of different accident conditions on the
FCI outcome and to eventually capture the most severe steam explosions. The simulations
have been performed in two steps. In the first step, the premixing phase of the FCI process
has been simulated for selected scenarios and then, in the succeeding second step, the
explosion phase simulations have been performed by triggering the so established
premixtures at different times.
As revealed in the MASCA experiments, the melt pool in the lower head may gradually
stratify in three layers of different melt composition, i.e. a molten oxidic pool with a light
metal layer on top and a heavy metal layer below (Seiler et al., 2007). Therefore the
composition of the poured melt is expected to depend on the location of the reactor vessel
Nuclear Power – Operation, Safety and Environment
214
failure. The melt composition has an important influence on the triggerability and the
energetics of the steam explosion (Huhtiniemi et al., 1999; Corradini, 1991). This material
effect is still not understood in detail, and the uncertainties in its modelling and scaling are
large. Therefore a conservative approach was applied, comprising artificial triggering and
neglecting the inhibiting effects of the melt droplets crust formation on the fine
fragmentation process, as explained in Section 2. Beside the melt composition, also the melt
temperature is expected to depend on the vessel failure location. The temperature of the
molten oxidic pool is estimated to be around 3000 K (OECD/NEA, 2007), whereas the
temperature of the metal layer on top is estimated to be around 2100 K (Esmaili and Khatib-
Rahbar, 2005). The melt temperature defines the thermal energy, which is potentially
available to be partially transferred to mechanical work during the steam explosion. Due to
modelling uncertainties and uncertainties in the composition and temperature of the poured
melt it was however decided to perform all simulations with the same melt composition, i.e.
the standard MC3D oxidic corium (Table 1), and the same initial melt temperature of
3000 K. By this the influence of the varied parameters may be established more directly.
The premixing phase simulations have been performed for the cases presented in Table 2.
The initial conditions were set reasonably according to expected conditions at vessel failure
during a severe accident in a typical pressurized water reactor. They are comparable to the
conditions used in the ex-vessel reactor simulations in the OECD programme SERENA
phase 1, where a central melt pour was analyzed (OECD/NEA, 2007). Central and side melt
pours were considered and a parametric analysis was performed varying the primary
system overpressure (0 MPa, 0.2 MPa) and the water temperature (60–100 °C). The water
saturation temperature at the assumed 0.15 MPa containment pressure is 111.4 °C, so the
cavity water subcooling was in the range of 11.4–51.4 K. The simulated cases were denoted
with three designators defined in Table 2 (e.g. case C2-60 is a central melt pour at 0.2 MPa
primary system overpressure into cavity water with a temperature 60 °C).
Property Value
Liquidus temperature 2800 K
Solidus temperature 2700 K
Latent heat 3.608×10
5
J/kg
Specific heat—liquid 520 J/kg/K
Specific heat—solid 380 J/kg/K
Density 8000 kg/m
3
Thermal conductivity 2.88 W/m/K
Dynamic viscosity 0.008 Pa/s
Table 1. Physical properties of applied standard MC3D oxidic corium.
The premixing phase was simulated 10 s after the start of the melt release. For each
premixing simulation, a number of explosion simulations were performed triggering the
explosion at different times. The explosion triggering times (Table 3) were selected so that
the most important stages of the case specific melt releases were captured. In the central
Simulation of Ex-Vessel Steam Explosion
215
melt pour cases with 0.2 MPa primary system overpressure (C2), when most melt was
released from the reactor vessel, gas started to flow out of the vessel opening and dispersing
the melt jet. To capture this phenomenon the explosion was triggered also at that time. The
side melt pour cases with a depressurized primary system (R0, L0) were not triggered before
1.5 s, since about 1 s was needed for the melt to reach the water surface.
Parameter Value Designator
Melt composition
Standard MC3D oxidic corium
(properties presented in Table 1)
/
Melt temperature 3000 K /
Melt level 1.25 m /
Melt mass 50 t /
Free fall 0.44 m /
Water level 3 m /
Cavity radius 2.5 m /
Annulus thickness 0.11 m /
Containment pressure 0.15 MPa /
Melt pour location Central (Fig. 3) C
Right (Fig. 4) R
Left (Fig. 4) L
Reactor vessel opening size
Central pour: radius 0.2 m
Side pour: height 0.2 m
/
Primary system overpressure 0 MPa 0
0.2 MPa 2
Water temperature 100 °C (11.4 K subcooling) 100
80 °C (31.4 K subcooling) 80
60 °C (51.4 K subcooling) 60
Melt volume flow rate for central pour
(estimated)
0.62 m
3
/s (0 bar overpressure)
1.08 m
3
/s (2 bar overpressure)
/
Melt velocity at water contact for
central pour (estimated)
5.75 m/s (0 bar overpressure)
9.12 m/s (2 bar overpressure)
/
Table 2. Initial conditions for simulated premixing cases (also some estimations of the melt
volume flow rate and the melt velocity at water contact are provided).
Nuclear Power – Operation, Safety and Environment
216
In addition to the triggering times listed in Table 3, for each simulated premixing case the
explosions were triggered also at additional times when the calculated explosivity criteria
were the highest. The explosivity criteria were based on the volume of liquid melt drops in
contact with water as
1
2
0.3
criterion 1 : ,
criterion 2 : ,
0.3
min 1,max(0, ) , ,
0.4
lr
l
dmc
dl
cells
dc
cells with
lr l
mlr
l
g
VCV
VV
C
(1)
where the symbols
l
,
g
,
d
denote the liquid water, void and liquid melt droplets
volume fractions, and
c
V is the mesh cell volume. The explosivity criteria actually represent
the volume of liquid melt drops in cells where the water content is high enough that the
melt may efficiently participate in the steam explosion, and so are a good measure for the
expected strength of the steam explosion. In this way it was tried to capture the strongest
steam explosions. For the most explosive central melt pour case, e.g. case C2-60 (presented
in the next section), a series of explosion simulations were performed triggering the
explosion every 0.2 s during the whole simulated premixing duration in order to get a better
insight in the influence of the triggering time on the steam explosion outcome. The
explosion phase was simulated 0.1 s after triggering, capturing the significant loading
events. The explosion was triggered in the cell, where the local cell explosivity criterion 2
(Eq. 1) was the highest (Meignen and Picchi, 2005).
Cases Triggering times (s)
C0 0.5 1 / 2 / 5 / 10
C2 0.5 1 / 2 / 5 6.5 10
R0, L0 / / 1.5 2 3 5 / 10
R2, L2 0.5 1 / 2 3 5 / 10
Table 3. Triggering times for explosion phase simulations.
3.2 Simulation results
The premixing and explosion simulations were performed with the code MC3D version
3.5 with patch 1 on a network of PC computers with Windows operating system, having
altogether about 30 processors, using the Condor distributed computing system. So a
number of simulations could be performed simultaneously, each simulation running on
its own processor. To establish the best model parameters enabling stable calculations,
first a number of test simulations were performed. In Table 4 some computing
information regarding stability and CPU times of simulations is provided. The water
subcooling had the largest influence on the stability of the simulations. At a water
Simulation of Ex-Vessel Steam Explosion
217
temperature of 50 °C (subcooling ~60 K), the premixing simulations diverged already
shortly after melt-water contact. The stability of premixing simulations could be
significantly increased by increasing the minimum bubble diameter from the default 0.5
mm to higher values, whereas this did not work for explosion simulations. So, if the
premixing simulations did not converge, the minimum bubble diameter was increased
gradually (to 1 mm, 2 mm) up to 5 mm, where most of the problematic simulations
remained stable over the whole simulation time. By increasing the minimum bubble
diameter, the surface area for condensation in subcooled conditions is reduced and so the
heat transfer terms are less stiff, which has a benevolent influence on the numerical
stability. Since the minimum bubble diameter influences the physics of the bubbly flow
regime and the subsequent explosion phase, it was strived to perform the simulations
with an as small as possible reasonable minimum bubble diameter.
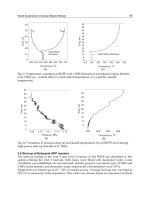
In Fig. 5, the calculated explosivity criteria (Eq. 1) during premixing are presented for
some representative simulated cases. In general, the explosivity criteria are highest in the
beginning of the simulation, when the melt jet enters the water and the void build up is
still low (Figs. 3 and 4). The later evolution of the explosivity criteria however is case
specific. In the depressurized central cases (C0, Fig. 5a) and the pressurized side cases (R2
and L2, Figs. 5d and 5f) the explosivity criteria remain low until the end of the simulation
due to the void buildup. In the pressurized side cases the explosivity criteria at later
stages are additionally reduced since after about 3 s the melt level in the reactor vessel is
reduced to the lower boundary of the vessel opening and so only small amounts of melt
are ejected from the vessel after that time. In the pressurized central cases (C2, Fig. 5b),
after about 5 s when most of the melt is already released from the vessel, gas starts to flow
with high velocity out of the reactor vessel and dispersing the melt jet. Due to the
increased melt dispersal, more melt droplets are created, what results in an increase of the
explosivity criteria (Fig. 5b). In the depressurized side cases (R0 and L0, Fig. 5c and 5e),
more explosivity criteria peaks occur during the melt release since, due to the pressure
buildup in the reactor cavity, the melt outflow from the reactor vessel is interrupted and
so the melt release occurs in intervals. Each melt release interval produces one explosivity
criteria peak.
Parameter
Stability
(more stable to less stable)
CPU time
(shorter time to longer time)
Melt pour location Central > Right > Left
Central < Right < Left
Premixing: C: ~day, L:
~week
Explosion: C: ~hour, L: ~day
Primary system
overpressure
0 bar > 2 bar /
Water temperature 100 °C > 80 °C > 60 °C /
Table 4. Stability and CPU times of performed simulations.
Nuclear Power – Operation, Safety and Environment
218
0
0,02
0,04
0,06
0,08
0,1
0,12
0246810
Volume (m3)
Time (s)
crit1 crit2
0
0,02
0,04
0,06
0,08
0,1
0,12
0,14
0,16
0,18
0,2
0246810
Volume (m3)
Time (s)
crit1 crit2
a) C0-60 b) C2-60 (most explosive central case)
0
0,01
0,02
0,03
0,04
0,05
0,06
0,07
0,08
0,09
0246810
Volume (m3)
Time (s)
crit1 crit2
0
0,005
0,01
0,015
0,02
0,025
0,03
0,035
0,04
0246810
Volume (m3)
Time (s)
crit1 crit2
c) R0-80 (most explosive right side case) d) R2-80
0
0,01
0,02
0,03
0,04
0,05
0,06
0,07
0,08
0,09
0246810
Volume (m3)
Time (s)
crit1 crit2
0
0,01
0,02
0,03
0,04
0,05
0,06
0,07
0,08
0246810
Volume (m3)
Time (s)
crit1 crit2
e) L0-60 (most explosive left side case) f) L2-60 (diverged after 5.06 s)
Fig. 5. Explosivity criteria during premixing for representative central (top), right (middle)
and left (bottom) pour cases at a depressurized (left) and pressurized (right) primary
system.
Simulation of Ex-Vessel Steam Explosion
219
In Fig. 6, the calculated maximum pressures in the cavity and maximum pressure impulses
(integral of pressure over simulation time) at the cavity walls (cavity floor and vertical
walls) are presented for the performed explosion phase simulations. The time axis denotes
the explosion triggering times. In the calculation of the pressure impulses, the initial
containment pressure was subtracted from the calculated absolute pressure since the
dynamic pressure loads on the cavity walls are caused by the pressure difference. For some
cases (e.g. case C0-60) more points are plotted at the same triggering time. This means that,
in these cases, more premixing simulations were performed for the same conditions, using
different minimum bubble diameters in the calculations, mostly due to convergence
problems during premixing or later during the explosion simulation, and so on the figures
the available explosion simulation results based on different premixing simulations are
presented. By this an impression of the uncertainty of the calculation results may be
obtained. The variation of the results for different minimum bubble diameters is quite large,
e.g. in case C0-60 the variation of the maximum pressure and pressure impulse (Fig. 6a-b)
for the triggering times around 1 s is up to a factor of two. It turns out that the influence of
the minimum bubble diameter on the pressure loads is stochastic, what reveals the
complexity of the FCI process. Some explosion simulations did not converge, and the results
for these cases are consequently not presented in the graphs.
The strength of the steam explosion depends on the mass of melt droplets, which can
efficiently participate in the steam explosion – that is the mass of liquid melt droplets in
regions with high water content. In Fig. 7 the mass of liquid melt droplets in regions with
different void fractions is presented for the most explosive cases during premixing. In the
side melt pour cases, represented by 2D slice models (Fig. 4), in the mass calculation a slice
of 1 m thickness was considered, what corresponds to a side melt pour through a fish mouth
opening with a length of about 1 m. During the premixing phase some tons of melt droplets
are formed in the considered scenarios (curve “Total”). A significant amount of these melt
droplets are frozen (compare curves “Total” and “<100%”) and so can not participate in the
steam explosion since they are not able to undergo fine fragmentation. In addition, most of
the liquid corium droplets are in regions with a high void content (compare curves “<100%”
and “<60%”), whereas for the steam explosion development enough water has to be
available for vaporization and for enabling the fine fragmentation process. It is estimated
that the void fraction has to be at least below about 60% for a steam explosion escalation to
develop. Despite these limiting factors, there are still (depending on scenario and triggering
time) up to some hundreds of kilograms of liquid corium droplets available to participate in
the energetic FCI process, resulting in severe pressure loads (Fig. 6).
The pressure curves and pressure impulse curves (Fig. 6) are reasonably correlated to the
corresponding explosivity criteria curves (Fig. 5) and mass of liquid melt droplets curves
(Fig. 7), as was expected. The results for the central melt pour cases show that, in the
initial stage of the melt pour, stronger explosions mainly occur for higher cavity water
subcooling and higher melt pour driving pressure. The reason for this could be that
higher water subcooling results in less void build up and that higher driving pressure
increases the melt fragmentation. On the contrary, at the later stage of the simulations,
stronger explosions mainly occur for lower water subcooling, probably due to less droplet
solidification with lower water subcooling. But the influence of the water subcooling on
the explosion strength is not very clear, indicating that in the considered subcooling range
the effects of void build up and melt droplets solidification nearly compensate. The
results of the side melt pour cases reveal that stronger explosions may be expected with a
Nuclear Power – Operation, Safety and Environment
220
0
50
100
150
200
250
300
350
0246810
Pressure (MPa)
Time (s)
C0-100 C0-80 C0-60 C2-100 C2-80 C2-60
0
0,05
0,1
0,15
0,2
0,25
0,3
0,35
0,4
0,45
0,5
0246810
Impulse (MPa.s)
Time (s)
C0-100 C0-80 C0-60 C2- 100 C2-80 C2-60
a) Central melt pour b)
0
20
40
60
80
100
120
0246810
Pressure (MPa)
Time (s)
R0-100 R0-80 R0-60 R2-100 R2-80 R2-60
0
0,1
0,2
0,3
0,4
0,5
0,6
0,7
0246810
Impulse (MPa.s)
Time (s)
R0-100 R0-80 R0-60 R2-100 R2-80 R2-60
c) Right side melt pour d)
0
20
40
60
80
100
120
140
0246810
Pressure (MPa)
Time (s)
L0-100 L0-80 L0-60 L2-100 L2-80 L2-60
0
0,05
0,1
0,15
0,2
0,25
0,3
0,35
0,4
0,45
0246810
Impulse (MPa.s)
Time (s)
L0-100 L0-80 L0-60 L2-100 L2-80 L2-60
e) Left side melt pour f)
Fig. 6. Calculated maximum pressures in the cavity (left) and maximum pressure impulses
at the cavity walls (right) for performed explosion phase simulations. The time axis denotes
the explosion triggering times.
Simulation of Ex-Vessel Steam Explosion
221
depressurized primary system. The reason for this could be that with a pressurized
primary system the melt is ejected sidewards on the cavity wall, sliding then into water at
the wall, which hinders the formation of an extensive premixture. Moreover, with a
pressurized system, already a tenth of a second after the start of the melt release gas starts
to flow through the vessel opening into the cavity and pushes the water through the
instrument tunnel out of the cavity, creating a highly voided region below the reactor
vessel. For the side melt pour cases the influence of the water subcooling on the steam
explosion strength seems to be somewhat stochastic, probably due to compensation
effects of void buildup and melt droplets solidification in combination with the complex
melt release dynamics.
In general, the highest pressures and pressure impulses were reached in the initial stage of
the melt release (Fig. 6, Table 5). The highest pressure was obtained in case C2-60 (nearly
300 MPa) and the highest pressure impulse in case R0-80 (nearly 0.7 MPa·s). The maximum
pressure and the maximum pressure impulse present only a rough measure of the steam
explosion strength. To reveal the real damage potential of a steam explosion, the space and
time development of the pressure field has to be analysed. Therefore for the most explosive
central and side melt pour cases a detailed analysis was performed. As the criteria for
establishing the most explosive cases, the maximum pressure impulse was taken (Table 5).
For the central melt pour case the highest maximum pressure impulse was predicted for
case C2-80, but since in case C2-60 the maximum pressure impulse is only slightly lower and
remains high over a wide triggering time window (Fig. 6b), the latter was chosen for the
detailed analysis.
Pour location Maximum pressure Maximum impulse
p (MPa) Case I (MPa·s) Case
C 293.7 C2-60 0.47 C2-80
R 105.1 R0-60 0.66 R0-80
L 116.1 L2-80 0.40 L0-60
Table 5. Maximum pressures in the cavity and maximum pressure impulses at the cavity
walls (cavity floor included) for different melt pour locations.
3.3 Detailed analysis
The detailed analysis of the explosion simulation results was performed for the most
explosive central (C2-60), right side (R0-80) and left side (L0-60) melt pour cases. For each
melt pour case the pressure field, the corium fraction and the liquid water fraction during
the explosion were investigated in detail and the pressure development with corresponding
pressure impulses at different wall locations was analyzed. Here only the main results are
briefly presented.
In the central melt pour case C2-60, soon after the triggering of the explosion a high pressure
peak occurs in the centre of the cavity floor. This high pressure peak of short duration is
created due to geometrical reasons, since the pressure field build up in the outer premixture
region is focused in the central part of the cavity due to the applied 2D cylindrical geometry.
Consequently this high pressure peak can not be considered as realistic for a 3D explosion.
Nuclear Power – Operation, Safety and Environment
222
0
1000
2000
3000
4000
5000
6000
7000
8000
9000
0246810
Mass (kg)
Time (s)
<20% <40% <60% <80% <100% Total
a) Central melt pour: most explosive case C2-60
0
500
1000
1500
2000
2500
3000
3500
0246810
Mass (kg)
Time (s)
<20% <40% <60% <80% <100% To t al
b) Left side pour: most explosive case L0-60
0
500
1000
1500
2000
2500
0246810
Mass (kg)
Time (s)
<20% <40% <60% <80% <100% Total
c) Right side pour: most explosive case R0-80
Fig. 7. Mass of liquid corium droplets in regions with different void fractions during
premixing. The results are presented for regions with a void fraction below 20% (<20%) up
to regions with a void fraction below 100% (<100%). In addition also the total (liquid and
solid) corium droplets mass is presented (Total).
Simulation of Ex-Vessel Steam Explosion
223
The highest calculated pressure on the vertical wall is much lower, only up to about 35 MPa.
The maximum pressure impulse on the vertical wall (0.22 MPa·s) is about half of that
calculated in the centre of the cavity floor (0.41 MPa·s). In the right side melt pour case R0-80
the highest pressure is reached at the bottom of the right wall (up to 46 MPa; see Fig. 4 for
wall position), but it decreases quickly with height, so that at higher elevations the
maximum pressure remains below 20 MPa. The whole cavity remains pressurized at around
5 MPa at the end of the explosion simulation, and there is no indication of a pressure
decrease. Therefore, the pressure impulses at the walls are very high (0.66 MPa·s on the right
wall) and rise at the end of the simulation. In the left side melt pour case L0-60 the highest
pressure, nearly 90 MPa, is achieved on the cavity floor below the middle wall, where the
premixture conditions are most favourable for the steam explosion escalation. The peak
pressures on the cavity walls are much lower, only about 23 MPa. Similar to the right side
melt pour case, the cavity remains pressurized at nearly 5 MPa at the end of the explosion
simulation, and there is no indication of a pressure decrease. However the highest
calculated pressure impulses on the walls are lower (0.34 MPa·s on the right wall; see Fig. 4
for wall position) due to the distance between the premixture, formed in the middle of the
cavity, and the cavity walls.
In Table 6 the maximum calculated pressures and pressure impulses at the vertical cavity
walls are given for the most explosive central (C2-60), right side (R0-80) and left side (L0-60)
melt pour scenarios. As expected, the maximum calculated vertical wall pressures are
significantly lower than the maximum calculated pressures in the cavity (Table 5) since the
pressure is reduced during the propagation from the explosion region to the cavity walls.
The maximum pressure impulses are predicted on the cavity walls, which are closest to the
explosion. For the central and left side pours this is the cavity floor, and for the right side
pour this is the right wall. Therefore for the central and left side pours the maximum
pressure impulses in Table 6 are lower than those in Table 5, where also the cavity floor was
considered. This reduction is more expressive for the central pour than for the left side pour
since due to the cylindrical geometry of the central pour the pressure wave weakens faster
and venting is more efficient.
The pressure impulses were calculated as the integral of the excess pressure (initial
containment pressure subtracted) over the entire explosion simulation time. The planned
explosion simulation time was 0.1 s, but due to stability problems some simulations stopped
earlier, and in these cases consequently a shorter integration period had to be applied. The
explosion simulation of the most explosive central pour case (C2-60, triggered at 1.4 s) was
stable, but the most explosive right (R0-80, triggered at 2 s) and left (L0-60, triggered at 2 s)
side pour calculations became unstable at about 0.08 s and 0.06 s, respectively, and so the
corresponding pressure impulses consider this shorter periods.
The pressure impulse is a good measure to estimate the destructive consequences of a steam
explosion if it considers the period with significant loading events. The lasting pressure load
capacity of a typical pressurized water reactor cavity is estimated to be of the order of some
MPa (based on Meignen (2004) and Hessheimer (2006) it was roughly estimated that lasting
pressures of about 3 MPa could cause some damage to the cavity). The cavity may
withstand also higher pressures if their duration is short enough. In this case the
experienced pressure impulse is the decisive factor (Smith, 1994). It is estimated that a
pressure impulse of the order of some tens of kPa·s may induce some damage to the cavity
(OECD/NEA, 2007). However it should be stressed that for an accurate assessment of the
damage caused by a steam explosion the real pressure history has to be taken into account.