Biosensors Emerging Materials and Applications Part 11 pdf
Bạn đang xem bản rút gọn của tài liệu. Xem và tải ngay bản đầy đủ của tài liệu tại đây (2.21 MB, 40 trang )
Biosensors for Monitoring Autophagy
391
deprivation of cells (e.g., nitrogen starvation) PMN is initiated at nuclear-vacuolar (NV)
junctions and promoted by the interaction of specific membrane-bound proteins (Krick et
al., 2008; Kvam & Goldfarb, 2007; Roberts et al., 2003). PMN takes place through a series of
morphologically distinct steps. First, an NV junction forms at which the nuclear envelope,
coincident with an invagination of the vacuolar membrane bulges into the vacuolar lumen.
Later, a fission event releases into the vacuolar lumen a nuclear-derived vesicle (PMN
vesicle) filled with nuclear material enclosed by both nuclear membranes. Eventually, the
PMN vesicle is degraded by resident vacuolar hydrolases (Krick et al., 2008; Kvam &
Goldfarb, 2007; Roberts et al., 2003).
n-Rosella is a variant of Rosella targeted to the nucleus. Under growing conditions, wildtype
yeast cells expressing n-Rosella exhibit fluorescent labelling of the entire nuclear lumen
(nucleoplasm), which appears as a single red and green body (Fig. 4) (Devenish et al., 2008;
Mijaljica et al., 2007; Mijaljica et al. 2010; Rosado et al., 2008). When incubated in nitrogen
starvation medium for 24 h, cells show red and green fluorescence of the nucleus as well as
markedly visible accumulation of red fluorescence in the vacuole indicative of autophagy
(nucleophagy) (Fig. 4A).
n-Rosella labelling allows both the morphology of the nucleus to be readily visualized and
its own accumulation inside the vacuole. The biosensor can also be used to monitor
intermediate steps in the process, using yeast cells lacking expression of particular ATG
genes (Fig 4B). In this example blebbing of the nucleus into the vacuole can be seen. Since
the bleb remains both red and green fluorescent, we can conclude that the bleb has a
relatively high pH, and the membrane structures required to isolate the vesicle within the
acidic vacuolar compartment have not yet been completed. This observation highlights that
the pH sensing capabilities of Rosella can be used to monitor membrane continuity or
integrity, although we do not have the optical resolution in these experiments to observe the
ultrastructural organisation of the membranes themselves.
Mutant yeast cells lacking specific vacuolar enzyme activities required for efficient
disassembly of membranes delivered by autophagy (e.g., atg15Δ) when starved of nitrogen
accumulate a large number of Rosella labelled vesicles (Fig. 4C). Some of these vesicles are
both red and green indicating high pH whilst others appear only red indicating that they
have a low pH-internal environment typical of the vacuole lumen. These results indicate
that autophagic vesicles delivered into the lumen can retain their membrane integrity within
the milieu of the resident hydrolases in the absence of the ATG15 gene product, a putative
lipase (Epple et al., 2001).
2.3.2 Monitoring autophagy in mammalian cells using Rosella.
The yeast vacuole is a relatively large and readily recognisable organelle, often accounting
for much of the cell volume (Fig. 4). Monitoring delivery of fluorescent cargo to the vacuole
therefore is relatively simple. In contrast, the internal membrane structure of the
mammalian cell is considerably more intricate and constitutes a profusion of vesicular
compartments of various sizes. The mammalian lysosome is a much smaller organelle
compared to the vacuole, usually present in large numbers that are distributed throughout
the cytosol. The task of visualising delivery of cellular material to the lysosome is
accordingly more complex and often requires specific labelling of the acidic organelle with
proprietary dyes such as Lysotracker or Lysosensor (Klionsky et al., 2007b). The pH–sensing
capability of Rosella allows the delivery of labelled material to be followed without the use
Biosensors – Emerging Materials and Applications
392
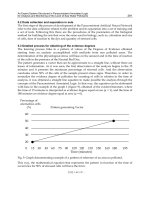
Fig. 4. n-Rosella in yeast: (A) Wild type cells expressing n-Rosella were imaged using
fluorescence microscopy under growing and nitrogen starvation conditions. Accumulation
of diffused red fluorescence in the vacuole after 24 h of commencement of nitrogen
starvation indicates nucleophagy. (B) The absence of expression a particular gene product
essential for nucleophagy influences nuclear morphology and abrogates correct delivery of
n-Rosella to the vacuole. Nuclear blebs remain red and green indicating high pH
environment. (C) The absence of the ATG15 gene abolishes degradation of n-Rosella derived
vesicles in the vacuole. Some intravacuolar vesicles are both red and green (indicating high
pH environment) whereas others are only red (indicating low pH environment). The
schematic (right) represents an interpretation of the image data. White dashed circles
highlight the limits of the vacuole.
of additional probes to highlight the location of the lysosome. We next demonstrate in
mammalian cells that Rosella can be used to monitor delivery of the cytosol or
mitochondrion to the lysosome.
HeLa cells maintained in a replete growth medium and transfected with an expression
vector encoding c-Rosella (Rosella without any additional targeting sequence) (Fig. 3B)
when imaged using fluorescence microscopy showed both strong red and green
fluorescence distributed throughout the cytosol. Rosella appears to have restricted access to
the nuclear compartment (less intense staining) and is completely excluded from other
compartments (Fig. 5). Importantly, only 1-2 red and weakly green puncta/cell were
observed (Fig. 5A, white arrows) suggesting that Rosella has accumulated in a relatively
acidic compartment such as a lysosome. These puncta correspond to autophagolysosomes,
Biosensors for Monitoring Autophagy
393
and represent fusion of an autophagosome carrying the Rosella cargo and a lysosome. Low
numbers of puncta observed under growth conditions are consistent with basal autophagic
activity and the homeostatic role of autophagy under these conditions.
Rapamaycin, an inhibitor of mTor (mammalian Tor), has been used in numerous studies to
induce autophagy in HeLa cells (Ravikumar, et al., 2006). Following 4 h incubation in the
presence of rapamycin (0.2μg/ml) a ~10-fold increase in the number of strongly red
fluorescent puncta that were only weakly green fluorescent and corresponding to
autophagolysosomes was observed (Fig. 5A, white arrows).
The lysosome can be independently labelled using acidotropic dyes that accumulate in the
lumen of the organelle (Klionsky et al., 2007b). The blue fluorescence emission of
LysoTrackerBlue-White (LTBW) in the lysosome can be imaged together with the red and
green emission of Rosella. In a separate experiment, prior to treatment with rapamycin to
induce autophagy, lysosomes in Rosella-transfected HeLa cells were labelled with LTBW
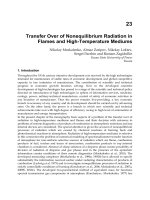
Fig. 5. Rosella can monitor autophagy in HeLa cells.
(A) HeLa cells expressing c-Rosella were imaged 24 h post-transfection for red and green
fluorescence (left panel). 1-2 red puncta (white arrows) lacking green fluorescence and
corresponding to uptake of cytosolic Rosella are visible in each cell. The number of red
puncta lacking green fluorescence increased after incubation in the presence of rapamycin
(0.2μg/ml) for 4 h (right panel). (B) In a separate experiment cells were incubated with
LysoTrackerBlue-White (LTBW) to label lysosomal compartments. The scale bar is 20 μm.
Biosensors – Emerging Materials and Applications
394
(Fig. 5B). The puncta were both red and blue fluorescent, but not green fluorescent
suggesting that these vesicles represent lysosomal derived compartments.
We next investigated whether Rosella was suitable for monitoring mitophagy in HeLa cells.
For these experiments mt-Rosella (a variant of Rosella fused at its N-terminus to the
mitochondrial targeting sequence of subunit VIII of cytochrome c oxidase; Fig. 3B) was
expressed in HeLa cells grown in replete growth medium and visualised by fluorescence
microscopy. Images of individual live cells show both bright red and green fluorescence
restricted to a filamentous network distributed throughout the cell, consistent with a
mitochondrial location (Figs. 6A & 6B).
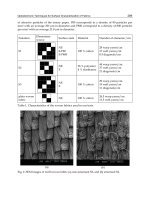
Fig. 6. Rosella can be used to monitor mitophagy in mammalian cells.
(A) DIC and fluorescence images are shown for HeLa cells transfected with an expression
vector encoding m-Rosella. Cells were labelled after transfection with a far-red fluorescent
mitochondrial probe, MitoTracker Deep Red (MTDR), whose emission is distinct from those
of Rosella. (B) HeLa cells were co-transfected with expression vectors encoding m-Rosella
and mCer-LC3, and subsequently incubated for 12 h in growth medium containing
0.2μg/ml rapamycin (+ Rapamycin) to induce autophagy. Control cells were not treated
with the inducer (-Rapamycin). The white outlined inset region is shown enlarged. Yellow
circles highlight red vesicles that co-localise with mCer-LC3, but contain little or no green
fluorescence emission. The scale bar is 20 μm.
Biosensors for Monitoring Autophagy
395
To confirm efficient targeting of mt-Rosella to the mitochondrion, transfected cells were
incubated with the far-red fluorescent mitochondrial probe MitoTracker Deep Red (MTDR)
(Fig. 6A) (Hallap et al., 2005). The far-red fluorescence emission of MTDR was observed to
co-localise with the red and green fluorescence of mt-Rosella. Collectively, these results
show that Rosella is efficiently imported into mitochondria, and subsequently becomes both
red and green fluorescent.
Next, HeLa cells were co-transfected with expression vectors encoding mt-Rosella or a cyan
FP (mCer) fused to the N-terminus of LC3. mCer-LC3 labels the autophagosome for reasons
indicated in Figure 1. Transfected cells were cultured for 12 h without (control) or with the
addition of rapamycin (0.2μg/ml) and imaged by fluorescence microscopy (Fig. 6B). In
control cells not stimulated with rapamycin, the presence of 1-2 cyan puncta per cell
indicates autophagy occurring at a low homeostatic level. Since LC3-II will label
autophagosomes resulting from both non-selective and selective autophagy, both of which
will be induced by rapamycin, it is not expected that the puncta would exhibit the red
fluorescence of mt-Rosella. Images of cells stimulated with rapamycin showed the presence
of numerous cyan puncta indicating the recruitment of the LC3-II to the autophagosome
(Fig. 6B). Selected regions of the image (inset) are enlarged to highlight several
autophagosomes that co-localise with bright red fluorescence, and therefore contain
mitochondrial material labelled with Rosella. Green fluorescence emission is very weak or
non-existent indicating that the pH inside the vesicles is relatively low and suggests that
these autophagosomes have fused with lysosomes to form autophagolysosomes.
Collectively, these data indicate that mt-Rosella can be used to monitor the delivery of
mitochondrial contents to the lysosome.
3. Conclusions and alternative approaches
A better understanding of the molecular mechanism of autophagy in living cells and tissues
is essential for the development of new therapeutic strategies to treat disease (Fleming et al.,
2011). Accordingly, there is a need for the validation of reliable, meaningful and quantitative
assays to monitor autophagy in live cells (Klionsky et al., 2007b; Klionsky et al., 2008;
Mizushima et al., 2010).
Increased interest in selective forms of autophagy highlights the need to develop biosensors
suitable for monitoring autophagy of specific targets. Exploiting components of the
molecular mechanism such as LC3 to follow autophagy have proven to be particularly
useful strategy, and LC3 tagged with a fluorescent protein remains the most commonly
used marker of the autophagosome. However, such approaches involve additional labelling
to identify target material. Labelling the target with Rosella allows delivery of the material
to the acidic vacuole/lysosome to be followed by exploiting the unique pH-sensitive dual
emission properties. Nevertheless, scope remains to improve development of new selective
probes.
Biosensors suitable for high throughput, high content applications such as large scale drug
or genetic screens are required. Although in some experimental regimes (e.g., yeast
nucleophagy) the dual emission output Rosella can be analysed using conventional FACS
analysis, sensitivity is somewhat reduced as the spatial information is lost and the assay
relies on integrating the total red and green fluorescence emission from each cell (Rosado et
al., 2008). New instrument technology such as imaging flow cytometry, an example of which
is manufactured by the Amnis Corporation (
Biosensors – Emerging Materials and Applications
396
would provide access to both spatial and colour information in cell populations (Lee et al.,
2007). Our preliminary experiments in yeast cells suggest that this approach has potential
but requires further validation and improvements under both physiological and autophagy-
induced conditions (Rosado et al., 2008).
The development of biosensors with considerably improved signal-to-noise ratio may be
possible using alternative probe technologies based on fragment complementation.
Fragment complementation for a variety of different fluorescent proteins is now available
(Kerpolla, 2006). The technology might be implemented to measure autophagy in one of
several ways. For example, yeast cells in which one FP fragment is targeted to the
mitochondrion and the complementing fragment targeted to the vacuole might be expected
to have strongly fluorescent vacuoles only when mitophagy has occurred. Delivery of
mitochondrial material including the FP fragment to the vacuole would allow re-
constitution of a functional FP by fragment complementation. Cells would be otherwise
non-fluorescent providing for a high signal-to-noise ratio. A similar and considerably more
sensitive biosensor might be developed along similar lines if the FP is substituted for a
member of the light-emitting luciferase family (Villalobos et al., 2010). Finally, it may be
possible for an inactive pro-enzyme such as acid protease to be used to label targets. The
enzyme would be proteolytically activated in the acidic lumen of the vacuole which would
then be detected by incubation of cells with a cell permeant quenched fluorescent peptide
substrate.
Given the interest in autophagy, it is likely in the near future that some of these ideas will
result in the development of new sensitive and selective probes for this process.
4. Acknowledgment
This work was supported in-part by Australian Research Council Grant (DP0986937)
awarded to R. J. Devenish.
5. References
Axe, E.L., Walker, S.A., Manifava, M., Chandra, P., Roderick, H.L., Habermann, A., Griffiths,
G. & Ktistakis, N.T. (2008). Autophagosome formation from membrane
compartments enriched in phosphatidylinositol 3-phosphate and dynamically
connected to the endoplasmic reticulum. J Cell Biol, Vol. 182, No. 4, (August 2008),
pp. 685-701, PMID: 18725538.
Brown, C.R., Dunton, D. & Chiang, H.L. (2010). The vacuole import and degradation
pathway utilizes early steps of endocytosis and actin polymerization to deliver
cargo proteins to the vacuole for degradation. J Biol Chem, Vol. 285, No. 2, (January
2010), pp. 1516-1528, PMID: 19892709.
Chen, Y. & Klionsky, D.J. (2011). The regulation of autophagy-unanswered questions. J Cell
Sci, Vol. 124, No. Part 2, (January 2011), pp. 161-170, PMID: 21187343.
Devenish, R.J., Prescott, M., Turcic, K. & Mijaljica, D. (2008). Monitoring organelle turnover
in yeast using fluorescent protein tags. Methods Enzymol, Vol. 451, pp. 109-131,
PMID: 19185717.
Epple, U.D., Suriapranata, I., Eskelinen, E.L. & Thumm, M. (2001). Aut5/Cvt17p, a putative
lipase essential for disintegration of autophagic bodies inside the vacuole. J
Bacteriol, Vol. 183, No. 20, (October 2001), pp. 5942-5955, PMID: 11566994.
Biosensors for Monitoring Autophagy
397
Farré, J.C., Krick, R., Subramani, S. & Thumm, M. (2009). Turnover of organelles by
autophagy in yeast. Curr Opin Cell Biol, Vol. 21, No. 4, (August 2009), pp. 522-530,
PMID: 19515549.
Fleming, A., Noda, T., Yoshimori, T. & Rubinsztein, D.C. (2011). Chemical modulators of
autophagy as biological probes and potential therapeutics. Nat Chem Biol, Vol. 7,
No. 1, (January 2011), pp. 9-17, PMID: 21164513.
Hallap, T., Nagy, S., Jaakma, U., Johannisson, A. & Rodriguez-Martinez, H. (2005).
Mitochondrial activity of frozen-thawed spermatozoa assessed by MitoTracker
Deep Red 633. Theriogenology, Vol. 63, No. 8, (May 2005), pp.2311-2322, PMID:
15826692.
He, C. & Klionsky, D.J. (2009). Regulation mechanisms and signaling pathways of
autophagy. Annu Rev Genet, Vol. 43, (2009), pp. 67-93, PMID: 19653858.
He, C., Bartholomew, C.R., Zhou, W. & Klionsky, D.J. (2009). Assaying autophagic activity
in transgenic GFP-Lc3 and GFP-Gabarap zebrafish embryos. Autophagy, Vol. 5, No.
4, (May 2009), pp.520-526, PMID: 19221467.
Amnis.
Iwai-Kanai, E., Yuan, H., Huang, C., Sayen, M.R., Perry-Garza, C.N., Kim, L. & Gottlieb,
R.A. (2008). A method to measure cardiac autophagic flux in vivo. Autophagy, Vol.
4, No. 3, (April 2008), pp. 322-329, PMID: 18216495.
Kabeya, Y., Mizushima, N., Ueno, T., Yamamoto, A., Kirisako, T., Noda, T., Kominami, E.,
Ohsumi, Y. & Yoshimori, T. (2000). LC3, a mammalian homologue of yeast Apg8p,
is localized in autophagosome membranes after processing. EMBO J, Vol. 19, No.
21, (November 2000), pp. 5720-5728, PMID: 11060023.
Kanki, T. & Klionsky, D.J. (2010). The molecular mechanism of mitochondria autophagy in
yeast. Mol Microbiol, Vol. 75, No. 4. (February 2010), pp. 795-800, PMID: 20487284.
Kanki, T., Klionsky, D.J. & Okamoto, K. (2011). Mitochondria autophagy in yeast. Antioxid
Redox Signal, (March 2011), Epub ahead of print, PMID: 21194379.
Katayama, H., Yamamoto, A., Mizushima, N., Yoshimori, T. & Miyawaki, A. (2008). GFP-
like proteins stably accumulate in lysosomes. Cell Struct Funct, Vol. 33, No. 1,
(February 2008), pp. 1-12, PMID: 18256512.
Kerpolla, T.K. (2006). Design and implementation of bimolecular fluorescence
complementation (BiFC) assays for the visualization of protein interactions in living
cells. Nat Protoc, Vol. 1, No. 3, pp1278-1286, PMID: 17406412.
Ketteler, R. & Seed, B. (2008). Quantification of autophagy by luciferase release assay.
Autophagy, Vol. 4, No. 6, (August 2008), pp. 801-806, PMID: 18641457.
Kettele, R., Sun, Z., Kovacs, K.F., He, W.W. & Seed, B. (2008). A pathway sensor for genome-
wide screens of intracellular proteolytic cleavage. Genome Biol, Vol. 9, No. 4, (April
2008), pp. R64, PMID: 18387192.
Kimura, S., Noda, T. & Yoshimori, S. (2007). Dissection of the autophagosome maturation
process by a novel reporter protein, tandem fluorescent-tagged LC3. Autophagy,
Vol. 3, No. 5, (September-October 2007), pp. 452-460, PMID: 17534139.
Klionsky, D.J., Cuervo, A.M., Dunn, W.A. Jr., Levine, B., van der Klei, I. & Seglen PO.
(2007a). How shall I eat thee? Autophagy, Vol. 3, No. 5, (September-October 2007),
pp. 413-416, PMID: 17568180.
Biosensors – Emerging Materials and Applications
398
Klionsky, D.J., Cuervo, A.M. & Seglen, P.O. (2007b). Methods for monitoring autophagy
from yeast to human. Autophagy, Vol. 3, No. 3, (May-June 2007), pp. 181-206, PMID:
17224625.
Klionsky, D.J., Abeliovich, H., Agostinis, P., Agrawal, D.K., Aliev, G., Askew, D.S., et al.
(2008). Guidelines for the use and interpretation of assays for monitoring
autophagy in higher eukaryotes. Autophagy, Vol. 4, No. 2, (February 2008), pp. 151-
175, PMID: 18188003.
Krick, R., Muehe, Y., Prick, T., Bremer, S., Schlotterhose, P., Eskelinen, E.L., Millen, J.,
Goldfarb, D.S. & Thumm. M. (2008). Piecemeal microautophagy of the nucleus
requires the core macroautophagy genes. Mol Biol Cell, Vol. 19, No. 10, (October
2008), pp. 4492-4505, PMID: 18701704.
Kvam, E. & Goldfarb, D.S. (2007). Nucleus-vacuole junctions and piecemeal
microautophagy of the nucleus in S. cerevisiae. Autophagy, Vol. 3, No. 2, (March-
April 2007), pp. 85-92, PMID: 17204844.
Lee, H.K., Lund, J.M., Ramanathan, B., Mizushima, N. & Iwasaki, A. (2007). Autophagy-
dependent viral recognition by plasmacytoid dendritic cells. Science, Vol. 315, No.
5817, (March 2007), pp. 1398-1401, PMID: 17272685.
Legakis, J.E. & Klionsky, D.J. (2006). Overview of autophagy. In: Autophagy in Immunity and
Infection. A Novel Immune Effector, V. Deretic, (Ed.), pp. 3-17. Wiley-VCH, ISBN: 978-
3-527-31450-8 Weinheim.
Lerena, M.C., Vázquez, C.L. & Colombo, M.I. (2010). Bacterial pathogens and the autophagic
response. Cell Microbiol, Vol. 12, No. 1, (January 2010), pp. 10-18, PMID: 19888990.
Lynch-Day, M.A. & Klionsky, D.J. (2010). The Cvt pathway as a model for selective
autophagy. FEBS Lett, Vol. 584, No. 7, (April 2010), pp. 1359-1366, PMID: 20146925.
Meléndez, A., Tallóczy, Z., Seaman, M., Eskelinen, E.L., Hall, D.H. & Levine, B. (2003).
Autophagy genes are essential for dauer development and life-span extension in C.
elegans. Science, Vol. 301, No. 5638, (September 2003), pp. 1387-1391, PMID:
12958363.
Mijaljica, D., Prescott, M. & Devenish, R.J. (2007) Nibbling within the nucleus: turnover of
nuclear contents. Cell Mol Life Sci, Vol. 46, No. 5 (March 2007), pp. 581-588. PMID:
17256087.
Mijaljica, D., Prescott, M. & Devenish, R.J. (2010). The intricacy of nuclear membrane
dynamics during autophagy. Nucleus, Vol. 1, No. 3, (May 2010), pp. 213-223, PMID:
21327066.
Mijaljica, D., Prescott, M. & Devenish, R.J. (2011). Microautophagy in mammalian cells:
revisiting a forty year old conundrum. Autophagy, Vol. 7, No. 7, (January 2011),
Epub ahead of print.
Mizushima, N. (2004). Methods for monitoring autophagy. Int J Biochem Cell Biol, Vol. 36,
No. 12, (December 2004), pp. 2491-2502, PMID: 15325587.
Mizushima, N. & Yoshimori, T. (2007). How to interpret LC3 immunoblotting. Autophagy,
Vol. 3, No. 6, (November-December 2007), pp. 542-545, PMID: 17611390.
Mizushima, N., Yoshimori, T. & Levine, B. (2010). Methods in mammalian autophagy
research. Cell, Vol. 140, No. 3, (February 2010), pp. 313-326, PMID: 20144757.
Nowikovsky, K., Reipert, S., Devenish, R.J. & Schweyen, R.J. (2007). Mdm38 protein
depletion causes loss of mitochondrial K+/H+ exchange activity, osmotic swelling
Biosensors for Monitoring Autophagy
399
and mitophagy. Cell Death Differ, Vol. 14, No. 9, (September 2007), pp. 1647-1656,
PMID: 17541427.
Orenstein, S.J. & Cuervo, A.M. (2010). Chaperone-mediated autophagy: molecular
mechanisms and physiological relevance. Semin Dev Cell Biol, Vol. 21, No. 7,
(September 2010), pp. 719-726, PMID: 20176123.
Otto, G.P., Wu, M.Y., Kazgan, N., Anderson, O.R. & Kessin, R.H. (2003). Macroautophagy is
required for multicellular development of the social amoeba Dictyostelium
discoideum. J Biol Chem, Vol. 278, No. 20, (May 2003), pp. 17636-17645, PMID:
12626495.
Ravikumar, B., Berger, Z., Vacher, C., O'Kane, C.J. & Rubinsztein, D.C. (2006). Rapamycin
pre-treatment protects against apoptosis. Hum Mol Genet, Vol. 15, No. 7, (April
2006), pp. 1209-1216, PMID: 16497721.
Ravikumar, B., Moreau, K., Jahreiss, L., Puri, C. & Rubinsztein, D.C. (2010). Plasma
membrane contributes to the formation of pre-autophagosomal structures. Nat Cell
Biol, Vol. 12, No. 8, (August 2010), pp. 747-757, PMID: 20639872.
Roberts, P., Moshitch-Moshkovitz, S., Kvam, E., O'Toole, E., Winey, M. & Goldfarb, D.S.
(2003). Piecemeal microautophagy of the nucleus in Saccharomyces cerevisiae, Mol
Biol Cell, Vol. 14, No. 1, (January 2003), pp. 129-141, PMID: 12529432.
Rosado, C.J., Mijaljica, D., Hatzinisiriou, I., Prescott, M. & Devenish, R.J. (2008). Rosella: a
fluorescent pH-biosensor for reporting vacuolar turnover of cytosol and organelles
in yeast. Autophagy, Vol. 4, No. 2, (February 2008), pp. 205-213, PMID: 18094608.
Rubinsztein, D.C. (2006). The roles of intracellular protein-degradation pathways in
neurodegeneration. Nature, Vol. 443, No. 7113, (October 2006), pp. 780-786, PMID:
17051204.
Rubinsztein, D.C., Cuervo, A.M., Ravikumar, B., Sarkar, S., Korolchuk, V., Kaushik, S. &
Klionsky, D.J. (2009). In search of an "autophagomometer". Autophagy, Vol. 5, No. 5,
(July 2009), pp. 585-589, PMID: 19411822.
Rusten, T.E., Lindmo, K., Juhász, G., Sass, M., Seglen, P.O., Brech, A. & Stenmark, H. (2004).
Programmed autophagy in the Drosophila fat body is induced by ecdysone
through regulation of the PI3K pathway. Dev Cell, Vol. 7, No. 2, (August 2004), pp.
179-192, PMID: 15296715.
Scott, R.C., Schuldiner, O. & Neufeld, T.P. (2004). Role and regulation of starvation-induced
autophagy in the Drosophila fat body. Dev Cell, Vol. 7, No. 2, (August 2004),
pp.167-178, PMID: 15296714.
Shpilka, T. & Elazar, Z. (2011). Shedding light on mammalian microautophagy. Dev Cell,
Vol. 20, No. 1, (January 2011), pp. 1-2, PMID: 21238917.
Shvets, E., Fass, E. & Elazar, Z. (2008). Utilizing flow cytometry to monitor autophagy in
living mammalian cells. Autophagy, Vol. 4, No. 5, (July 2008), pp. 621-628, PMID:
18376137.
Tanida, I. (2010). Autophagosome formation and molecular mechanism of autophagy.
Antioxid Redox Signal, (December 2010), Epub ahead of print, PMID: 20712405.
Tanida, I. (2011). Autophagy basics. Microbiol Immunol, Vol. 55, No. 1, (January 2011), pp. 1-
11, PMID: 21175768.
van der Vaart, A., Mari, M. & Reggiori, F. (2008). A picky eater: exploring the mechanisms of
selective autophagy in human pathologies. Traffic, Vol. 9, No. 3, (March 2008), pp.
281-289, PMID: 17988219.
Biosensors – Emerging Materials and Applications
400
Villalobos, V., Naik, S., Bruinsma, M., Dothager, R.S., Pan, M.H., Samrakandi. M., Moss, B.,
Elhammali, A. & Piwnica-Worms, D. (2010). Dual-color click beetle luciferase
heteroprotein fragment complementation assays. Chem Biol, Vol. 17, No. 9,
(September 2010), pp. 1018-1029, PMID: 20851351.
Xie, Z. & Klionsky, D.J. (2007). Autophagosome formation: core machinery and adaptations.
Nat Cell Biol, Vol. 9, No. 10, (October 2007), pp. 1102-1109, PMID: 17909521.
Xie, Z., Nair, U. & Klionsky, D.J. (2008). Atg8 controls phagophore expansion during
autophagosome formation. Mol Biol Cell, Vol. 19, No. 8, (August 2008), pp. 3290-
3298, PMID: 18508918.
Yang, Z. & Klionsky, D.J. (2010). Eaten alive: a history of macroautophagy. Nat Cell Biol, Vol.
12, No. 9, (September 2010), pp. 814-822, PMID: 20811353.
Yorimitsu, T. & Klionsky, D.J. (2005). Autophagy: molecular machinery for self-eating. Cell
Death Differ, Vol. 12, No. Suppl 2, (November 2005), pp. 1542-1552, PMID: 16247502.
Yoshimoto, K., Hanaoka, H., Sato, S., Kato, T., Tabata, S., Noda, T. & Ohsumi, Y. (2004).
Processing of ATG8s, ubiquitin-like proteins, and their deconjugation by ATG4s are
essential for plant autophagy. Plant Cell, Vol. 16, No. 11, (November 2004), pp.
2967-2983, PMID: 15494556.
Youle, R.J. & Narendra, D.P. (2011) Mechanisms of mitophagy. Nat Rev Mol Cell Biol, Vol. 12,
No. 1, (January 2011), pp. 9-14, PMID: 21179058.
20
Amperometric Biosensors for
Lactate, Alcohols and Glycerol
Assays in Clinical Diagnostics
Oleh Smutok
1
et al.
*
1
Institute of Cell Biology, NAS of Ukraine, Lviv,
Ukraine
1. Introduction
Biosensors are bioanalytical devices which transform a biorecognition response into a
measurable physical signal. Although biosensors are a novel achievement of bioanalytical
chemistry, they are not only a subject of intensive research, but also a real commercial
product (Kissinger, 2005). The estimated world analytical market is about $20 billion per
year of which 30 % is in the healthcare field. The biosensors market is expected to grow from
$6.72 billion in 2009 to $14.42 billion in 2016 (, Analytical
Review of World Biosensors Market).
Although up to now IUPAC has not accepted an official definition of the term biosensor, its
electrochemical representative is defined as “a self-contained integrated device, which is
capable of providing specifc quantitative or semi-quantitative analytical information using a
biological recognition element (biochemical receptor) which is retained in direct spatial
contact with an electrochemical transduction element’’ (Thevenot et al., 2001). Generally, the
biosensor is a hybrid device containing two functional parts: a bioelement (an immobilized
biologically active material) and a physical transducer. As bioelements pieces of tissue,
microbial cells, organelles, natural biomembranes or liposomes, receptors, enzymes,
antibodies and antigens, abzymes, nucleic acids and other biomolecules and even
biomimetics which imitate structural and functional features of the natural analogue can be
used. The bioelement is a recognition unit providing selective binding or
biochemical/metabolic conversion of the analyte that result in changes in physical or
physico-chemical characteristics of the transducer (Scheller et al., 1991; Schmidt & Karube,
1998; Gonchar et al., 2002; Nakamura & Karube, 2003; Sharma et al., 2003; Investigations on
Sensor Systems and Technologies, 2006). The bioelement in such constructions is usually
prepared in immobilized form and often covered with an outer membrane (or placed
between two membranes in a sandwich manner), which either prevents the penetration of
*
Galina Gayda
1
, Kostyantyn Dmytruk
1
, Halyna Klepach
1
, Marina Nisnevitch
3
, Andriy Sibirny
1,2
,
Czesław Puchalski
2
, Daniel Broda
2
, Wolfgang Schuhmann
4
, Mykhailo Gonchar
1,2
and Vladimir Sibirny
2
2 University of Rzeszow, Rzeszow-Kolbuszowa, Poland
3 Ariel University Center of Samaria, Ariel, Israel
4 Ruhr-Universität Bochum, Bochum, Germany
Biosensors – Emerging Materials and Applications
402
interfering substances into a sensitive bioselective layer and the transducer surface, or
creates a diffusion barrier for the analyte. Such membrane structures increase the stability of
the biorecognition element, enhance its selectivity and provide the diffusion limitations for
biochemical reactions. Electrochemical, optical, piezoelectric, thermoelectric, transistor,
acoustic and other elements are used as transducers in biosensor systems. Electrochemical
(amperometric, potentiometric, conductometric) and optical (surface plasmon resonance)
devices are the most exploited transducers in commercially available biosensors
(Commercial Biosensors, 1998).
Basically, biosensors can be regarded as information transducers in which the energy of
biospecific interactions is transformed into information about the nature and concentration
of an analyte in the sample. The most essential advantages of biosensors are excellent
chemical selectivity and high sensitivity, possibility of miniaturization and compatibility
with computers. Their drawbacks are limited stability and a rather complicated procedure
for preparation of the biologically active material.
Enzyme biosensors are the most widespread devices (Zhao & Jiang, 2010); many of them are
produced commercially. Enzyme biosensors are characterized by their high selectivity. They
also provide fast output due to high activity and high local enzyme concentration in a
sensitive layer. The drawbacks of enzyme biosensors are insufficient stability and the high
price of purified enzymes. Cell sensors, especially microbial ones, have been actively
developed only in recent years (Shimomura-Shimizu & Karube, 2010a, 2010b; Su et al.,
2011). Cell biosensors have a range of considerable advantages when compared to their
enzyme analogues: availability of cells, low price and simple procedure of cell isolation,
possibility to use long metabolic chains, avoiding purification of enzymes and coenzymes,
advanced opportunity for metabolic engineering, integrity of the cell response (important in
assaying total toxicity and mutagenic action of environmental pollutants), possibility to
retain viability of sensoring cells and even to provide their propagation, and, in some cases,
higher stability of cell elements compared to enzyme ones. The main drawbacks of microbial
biosensors are a rather low signal rate due to a lower concentration of enzymes involved in
cellular response, as well as low selectivity of cell output (e.g. in the case of microbial O
2
electrode sensors due to a broad substrate specificity of cellular respiration).
These drawbacks are not absolute, taking into account recent progress in genetic
engineering and the possibility to over-express the key analytical enzyme in the cell
(Gonchar et al., 2002).
Most biosensors have been created for clinical diagnostics (D’Orazio, 2003; Song et al., 2006;
Belluzo et al., 2008). They exploit enzymes as biocatalytic recognition elements and
immunoreagents and DNA fragments as affinity tools for biorecognition of the target
analytes (metabolites, antigens, antibodies, nucleic acids) coupled to electrochemical and
optical modes of transduction. For simultaneous detection of multiple analytes, microarray
techniques are developed for automated clinical diagnostics (Seidel & Niessner, 2008). For
continuous monitoring of living processes, reagentless implantable biosensors have been
developed (Wilson & Ammam, 2007).
Biosensors are regarded as very promising tools for clinical cancer testing (Rasooly &
Jacobson, 2006; Wang, 2006). New genomic and proteomic approaches are being used for
revealing cancer biomarkers related with genetic features, changes in gene expression,
protein profiles and post-translational modifications of proteins.
Recent progress in nanobiotechnology allows using nanomolecular approaches for clinical
diagnostic procedures (Salata, 2004; Jain, 2007). The most important applications are
Amperometric Biosensors for Lactate, Alcohols and Glycerol Assays in Clinical Diagnostics
403
foreseen in the areas of biomarker monitoring, cancer diagnosis, and detection of infectious
microorganisms. Analytical nanobiotechnology uses different nanoscaled materials (gold
and magnetic nanoparticles, nanoprobes, quantum dots as labels, DNA nanotags) for
molecular detection (Baptista et al., 2008; Medintz et al., 2008; Sekhon & Kamboj, 2010). The
use of nanomaterials in biosensors has allowed the introduction of many new signal
transduction technologies into biosensorics and the improvement of bioanalytical
parameters of the nanosensors - selectivity, response time, miniaturization of the
biorecognition unit (Jianrong et al., 2004; Murphy, 2006).
2. Development of L-lactate-selective biosensors based on L-lactate-selective
enzymes
Lactate, a key metabolite of the anaerobic glycolytic pathway, plays an important role in
medicine, in the nutritional sector, as well as in food quality control. Amperometric
biosensors offer a sensitive and selective means to monitor organic analytes like lactate.
Here, different aspects of amperometric lactate biosensor construction are described:
electrode materials, biorecognition elements, immobilization methods, mediators and
cofactors as well as fields of application.
Biosensors for the detection of L-lactate are often based on either NAD
+
-dependent lactate
dehydrogenase (LDH) from mammalian muscles or heart (EC 1.1.1.27) (Arvinte et al., 2006;
Hong et al., 2002), bacterial lactate oxidase (LOX) (EC 1.13.12.4) (Hirano et al., 2002; Iwuoha et
al., 1999) or bi-enzyme systems combining peroxidase (HRP) and LOX (Herrero et al., 2004;
Zaydan et al., 2004; Serra et al., 1999). Some approaches let to commercially available L-lactate
sensors (Luong et al., 1997;
However, due to the non-
advantageous equilibrium constant of the LDH-catalysed reaction and the need to add free
diffusing NAD
+
as well as problems arising from the generally high working potentials of
LOX-based amperometric biosensors, there is still a need to develop alternative sensor
concepts for the determination of L-lactate. To decrease the impact of interfering
compounds, related sensor’s electrodes were, for example, covered with an additional
permselective membrane (Madaras et al., 1996). Despite the more complex sensor
preparation, this pathway is unsuitable for the development of L-lactate sensors due to the
fact that negatively-charged L-lactate is simultaneously prevented from reaching the
electrode surface through negatively charged membranes.
Besides LDH and LOX, another enzyme is known for participating in the lactic acid
metabolism in yeasts, namely
L-lactate-cytochrome c oxidoreductase (EC 1.1.2.3;
flavocytochrome b
2
, FC b
2
) (Brooks, 2002), which catalyses the electron transfer from L-lactate
to cytochrome c in yeast mitochondria. The protein can be isolated from Saccharomyces
cerevisiae and Hansenula anomala (Labeyrie et al., 1978; Haumont et al., 1987; Silvestrini et al.,
1993) as a tetramer with four identical subunits, each consisting of FMN- and heme-binding
domains. FC b
2
has absolute specificity for L-lactate, moreover, it functions in vitro without
regard to the nature of electron acceptors which makes this enzyme very promising for
analytical biotechnology. However, until now application of FC b
2
from baker’s yeast in
bioanalytical devices was hampered by its instability and difficulties in purification of the
enzyme (Labeyrie et al., 1978). Here, we describe the use of a purified FC b
2,
isolated from
the wild-type and recombinant thermotolerant Hansenula polymorpha yeast cells that
overproduce this enzyme as a biological recognition element in amperometric biosensors.
Biosensors – Emerging Materials and Applications
404
2.1 Construction of biosensors using purified FC b
2
from the wild type Hansenula
polymorpha 356
Prior to the electrochemical investigations, we have performed considerable microbiological,
biochemical and analytical investigations. We have screened 16 yeast species as possible
sources of the stable form of FC b
2
. The thermostability test was performed at different
temperatures and time periods. The study of enzyme activity by two procedures, including
our own method for FC b
2
activity visualization in PAA-gels (Gaida et al., 2003), has shown
that only FC b
2
from H. polymorpha 356 remained as a native tetramer during a 10 min-
incubation of cell-free extract at 60
°
C or 3 min at 70
°
C (Smutok et al., 2006a). For preparative
purification of FC b
2
from the cells of H. polymorpha 356, we modified a scheme that was
developed for this enzyme from the yeast H. anomala (Labeyrie et al., 1978). The scheme of
purification includes lysis of the cell’s pellet by n-butanol followed by extraction of cell’s
debris with 1% Triton X-100; ion-exchange chromatography on DЕАЕ–Toyopearl 650M
(ТSK-GEL, Japan). The enzyme yield after chromatographic purification was near 80 %
(Smutok et al., 2006c). The highest specific FC b
2
activity in some fractions was 20 μmol·min
-
1
·mg
-1
protein (U·mg
-1
). After ammonium sulfate was added up to 70% saturation, the
specific activity was increased to 30 U·mg
-1
. FC b
2
preparations have been used to develop
L-lactate-sensitive biosensors (Smutok et al., 2006a).
Amperometric FC b
2
-based biosensors were evaluated using constant-potential amperometry
in a three-electrode configuration with a Ag/AgCl/KCl (3 M) reference electrode and a Pt-
wire counter electrode. Amperometric measurements were carried out with a bipotentiostat
(EP 30, Biometra, Göttingen, Germany) or a potentiostat PGSTAT302 (Autolab, Netherlands).
As working electrodes, graphite rods (type RW001, 3.05 mm diameter, Ringsdorff Werke,
Bonn, Germany) were applied, which were sealed in a glass tube using epoxy, thus forming
disk electrodes. Before sensor preparation, the graphite electrodes were polished on emery
paper and on a polishing cloth using decreasing sizes of alumina paste (Leco, Germany). The
polished electrodes were rinsed with water in an ultrasonic bath.
Although FC b
2
provides very specific electron transfer from L-lactate to cytochrome c in the
respiratory chain of native yeast cells, theoretically, it could be supposed in vitro a direct
electrochemical communication between the reduced heme-binding domain and the
electrode surface. This hypothesis has been approved by using cyclic voltammetry (Fig. 1).
The obtained cyclic voltammogram (Fig. 1A) shows a small peak at a potential of +250 mV
versus Ag/AgCl in the presence of L-lactate which can be attributed to the accessibility of
the heme site of the enzyme for direct electron exchange reactions with the electrode surface.
Obviously, the first monolayer of the enzyme is able to directly exchange electrons with the
electrode surface, providing a favorable orientation with the accessible heme site towards
the electrode.
The related hydrodynamic voltammograms at increasing L-lactate concentrations (0.5, 1 and
4 mM) are shown in Fig. 1B. The peak current is highest at a potential of about +300 mV
versus Ag/AgCl; hence, all the experiments concerning direct electron transfer were
performed at this working potential.
In yeast cells, mitochondrial FC b
2
catalyses the dehydrogenation of L-lactate to pyruvate,
transferring the electrons from L-lactate via FMN as the primary electron acceptor, to the
heme site of the enzyme and finally to cytochrome c as the terminal electron sink. No
detectable direct electron transfer is possible from the reduced FMNH
2
inside the intact en-
zyme to cytochrome c, avoiding the intermediate storage of the electrons in the heme site
(Ogura & Nakamura, 1966). However, it is known that a number of free-diffusing redox
Amperometric Biosensors for Lactate, Alcohols and Glycerol Assays in Clinical Diagnostics
405
0.00.10.20.30.40.5
-0.04
0.00
0.04
0.08
0.12
0.16
0.20
(A)
E, mV
a
b
I, μA
100 200 300 400 500
1
2
3
4
5
6
7
8
9
(B)
c
b
a
I, nA
E, mV
Fig. 1. (A) Cyclic voltammogram at a graphite electrode modified with adsorbed FC b
2
(a) in
the absence and (b) in the presence of 20 mM L-lactate (0 to +500 mV at a scan rate of 5
mV/s in 20 mM phosphate buffer, pH 7.2). (B) Hydrodynamic voltammograms obtained
from a graphite electrode modified with adsorbed FC b
2
in the presence of (a) 0.5 mM; (b) 1
mM; (c) 4 mM L-lactate in the absence of any electron-transfer mediator.
mediators can be used to transfer electrons from FC b
2
to electrodes, while direct electron
transfer was not yet approved experimentally. Hence, we investigated the
L-lactate-
dependent current response of FC b
2
-modified electrodes in the absence and presence of
various electron-transfer mediators (Figs. 2 and 3).
0 2 4 6 8 10 12 14 16
0
2
4
6
8
10
12
14
16
Chi
2
/DoF = 0.02323
R
2
= 0.99923
I
Max
= 14.7 ± 0.11 nA
K
M
FC b
2
= 0.52 ± 0.02 mM
b
a
[L-lactate], мM
I, nA
Fig. 2. Lactate calibration curve of a graphite electrode modified with adsorbed FC b
2
at a
potential of +300 mV and pH 7.2 in the absence of any redox mediator (b). Control
experiment with a bare graphite electrode (a).
In the absence of any free-diffusing redox mediator, direct electron transfer is only possible
from those enzyme molecules which are located in a monolayer in direct contact with the
electrode surface, while being orientated to allow the heme site to be situated at a
productive electron-transfer distance. Although the efficiency of the direct electron transfer
reaction is comparatively low, the response clearly exceeds the noise signal of the control
electrode without immobilized enzyme (Fig. 2). These limitations lead to a maximum
current of 14 nA at L-lactate saturation. In contrast, in the presence of the most effective free-
diffusing redox mediator (phenazine ethosulfate) the response is enhanced 28 times,
reaching a maximum value of 390 nA at substrate saturation.
Biosensors – Emerging Materials and Applications
406
012345678
0
50
100
150
200
250
300
350
400
[L-lactate], мM
I, nA
potassium hexacianoferrate (III)
phenazine ethosulfate
methylane blue
ferrocene
1,1'-dimethyl ferocene
0
50
100
150
200
250
300
350
400
Fig. 3. Lactate calibration curves obtained with a graphite electrode modified with adsorbed
FC b
2
in the presence of different free-diffusing electron-transfer mediators (+ 300 mV, pH 7.2).
As demonstrated in Fig. 3, all free-diffusing and adsorbed redox mediators used in the study
accelerated the investigated oxidation of L-lactate catalyzed in the FC b
2
reaction. Phenazine
ethosulfate exceeds the efficiency of the other mediators by up to 2.7–3.6 times. Hence,
phenazine ethosulfate was used for all further experiments as a free-diffusing redox mediator.
A variety of different immobilization techniques were applied for the preparation of the
enzyme electrodes, with the aim to achieve optimal stability, the highest possible sensitivity
and selectivity, and a low detection limit. FC b
2
was immobilized on graphite surfaces using
some different strategies: physical adsorption; electrodeposition by anodic paint Resydrol
AY; entrapment in a polymer layer of a precipitated cathodic paint GY 83-0270 00054; cross-
linking by glutardialdehyde vapour (Smutok et al., 2005); electrodeposition by osmium-
modified anodic paint (AP-Os); entrapment in a layer of cathodic paint (CP-Os) (Fig. 4).
012345678
0
100
200
300
400
0
100
200
300
400
(A)
a
b
c
d
[L-lactate], mM
I, nA
0.00.51.01.52.02.53.03.54.0
0
200
400
600
800
1000
0
200
400
600
800
1000
(B)
a
b
І, nA
[L-lactate], mM
Fig. 4. (A) Lactate calibration curves obtained with graphite electrodes modified with FC b
2
using different enzyme immobilization methods in the presence of 1 mM phenazine
ethosulfate as free-diffusing electron-transfer mediator (+300 mV, pH 7.6). (a) Entrapment in
the anodic electrodeposition paint “Resydrol AY”; (b) entrapment in the cathodic
electrodeposition paint “GY 83-0270 00054”; (c) cross-linking of the adsorbed enzyme in
glutardialdehyde vapour; (d) physical adsorption. (B) electrodeposition of FC b
2
with an
osmium-modified anodic paint (AP-Os-FC b
2
) (a); entrapment of FC b
2
in a layer of a
cathodic paint (CP-Os-FC b
2
) (b).
Amperometric Biosensors for Lactate, Alcohols and Glycerol Assays in Clinical Diagnostics
407
All obtained biosensors were investigated concerning their substrate-dependent current
response. As shown in Fig. 4A, the maximal responses of the different enzyme electrodes
were 439 ± 3.2, 263 ± 3.1, and 237 ± 1.1 nA for physical adsorption, glutardialdehyde
immobilization and cathodic paint precipitation, respectively. In the case of the anodic paint
Resydrol AY the maximal current value was much lower (20 nA). The use of the
electrodeposited osmium-complex modified anodic paint performed two functions: electron
transfer and film immobilization. Therefore, this variant of enzyme immobilization looks
most promising, especially since its signal value was 600 nA (Fig. 4B). However, we have
shown that the activity of FC b
2
strongly depends on the process of electro-deposition in the
presence of anodic paint. High voltage impulses of electrodeposition (+2200 mV) resulted in
the inactivation of FC b
2
, probably due to the very fast generation of protons and a decrease
of pH values (Fig. 5A).
Fig. 5. (A) Dependence of sensor’s output on cycles of anodic (A) and cathodic (B) schemes
of electrodeposition of FC b
2
(+ 300 mV, pH 7.2 in the presence of 1 mM phenazine
ethosulfate).
On the other hand, FC b
2
should have been more resistant at higher pH values according to
its enzymological properties in solution (Smutok et al., 2006a). Therefore, in subsequent
experiments, a cathodic paint was used as a matrix for the entrapment of FC b
2
. No
remarkable negative influence on the FC b
2
activity was observed at potentiostatic pulses to
potentials as low as –1200 mV. Hence, this potential was used for the cathodic paint
precipitation (Fig. 5B).
The sensor with CP-Os-FC b
2
architecture gave the highest output; 1000 nA (Fig. 4B).
Therefore, in the subsequent experiments this structure was used in conjunction with free-
diffusing mediators, to cross-link immobilized FC b
2
by glutaraldehyde vapour. In the case
of covalently-bound mediator, the electroinduced immobilization by CP-Os-FC b
2
technique
has been selected as the best.
Bioanalytical characteristics of the developed FC b
2
-based biosensor in conjunction with free-
diffusing mediators have been investigated. The calculated value for the apparent
Michaelis-Menten constant K
M
app
as derived from the calibration graphs in the presence of 1
mM phenazine ethosulfate for FC b
2
was about 1.0±0.02 mM. The response time was rather
fast: 50 % of the signal value is achieved after 3 sec and 90 % after 6 sec (Fig. 6A).
The level of selectivity was estimated in relative units (%), as a ratio to the value of L-lactate
response. No interference by L-malate, pyruvate, L,D-isocitrate or acetate on FC b
2
-modified
Biosensors – Emerging Materials and Applications
408
01234567891011
100
120
140
160
180
200
(A)
100 % of responce
Time, s
І, nА
+ 0,5 mM L-lactate
×àñ, ñ
I, nA
L-
l
a
c
t
a
t
e
D
-
l
a
c
t
a
t
e
L-
M
a
l
a
t
e
P
y
r
uv
a
t
e
L-
D
-
I
s
oc
y
t
r
a
t
e
A
c
e
t
a
t
e
0
1
2
3
4
60
80
100
Analyte
(B)
Selectivity, % of L-lactate response
Fig. 6. (A) Development of the sensor’s response with time upon addition of 5 mM L-lactate
(potential +300 mV vs Ag/AgCl/3M KCl) in phosphate buffer, pH 7.2 in the presence of 1
mM phenazine ethosulfate (a). (B) Selectivity of FC b
2
-modified electrodes (response to 4
mM analyte).
electrodes was observed, but the sensor did show a low signal to D-Lactate (1.8 ± 0.3 %).
This fact can be explained by the incomplete purity of the FC b
2
sample, and its possible
contamination with D-lactate cytochrome c-oxidoreductase. In spite of this fact, the
developed sensor was highly selective to L-lactate (Fig. 6B).
The temperature and pH-dependence of the obtained biosensors were evaluated and the
optimal temperature of 35-38
0
C at the optimal pH-value of 7.5-7.8 was derived (Fig. 7).
These values are governed by the properties of the enzyme itself and are not significantly
altered by the used immobilization procedure.
20 25 30 35 40 45 50
100
150
200
250
300
100
150
200
250
300
(A)
c
b
а
p
H 7.6
I, nA
Temperature,
0
C
6.4 6.8 7.2 7.6 8.0 8.4
0
15
30
45
60
75
90
105
120
135
150
0
15
30
45
60
75
90
105
120
135
150
(B)
c
b
a
I, nA
pH of phosphate buffer
Fig. 7. Temperature- (A) and pH-dependence (B) of the biosensor’s response to L-lactate: 0.5
mM (a); 2 mM (b) and 8 mM (c). Experimental conditions: +300 mV vs Ag/AgCl/3 M KCl,
pH 7.6, 1 mM phenazine ethosulfate.
Simultaneous with the investigation of the sensor architecture comprising free-diffusing
mediators, the main characteristics of the sensor formed by electrodeposition paint were
determined. The maximal detected signal values were 1100 nA for the sensor architecture
CP-Os-FC b
2
and 650 nA for AP59-Os-FC b
2
-modified electrodes (Fig. 8).
The apparent Michaelis-Menten constants (K
M
app
) for L-lactate calculated from the
calibration curves were 0.141±0.001 mM and 0.135±0.003 mM, respectively. The sensor
response time, selectivity, optimal temperature and pH values were the same as for the
biosensor based on free-diffusing redox mediators.
Amperometric Biosensors for Lactate, Alcohols and Glycerol Assays in Clinical Diagnostics
409
0 100 200 300 400 500 600
0
150
300
450
600
750
900
1050
0
150
300
450
600
750
900
1050
+ 2 mM
+ 1 mM
+ 0,5 mМ
+ 0,5 mM
b
a
I, nА
Time, s
+ 2 mM
+ 1 mM
+ 0,5 mM
Fig. 8. Chronamperometric current response upon subsequent additions of L-lactate aliquots
for sensors with FC b
2
entrapped in a layer of osmium-complex modified anodic paint (AP-
Os-FC b
2
) (a) and an osmium-complex containing cathodic paint (CP-Os-FC b
2
) (b).
The operation and storage stabilities of the developed sensors have been evaluated. The
electrodes prepared at optimal conditions were tested at 24
0
C with respect to their stability.
Solutions of 1 mM L-lactate (for experiments of operational stability) and 4 mM L-lactate
(for the storage stability) were used in these experiments. The operational stability of the
obtained microbial sensors was evaluated using a previously described automatic
sequential-injection analyzer (“OLGA”) system (Schuhmann et al., 1995) and 15
measurements per hour were done (Fig. 9A).
(A) (B)
0
50
100
150
200
250
300
350
400
0 0.5 1 1.5 2 2.5 3 3.5 4 4.5 5 5.5 6
Time, h
I, nA
Fig. 9. Flow injection “OLGA“ analyzer system with integrated bioelectrodes (A) and
operation stability of the sensor obtained by “OLGA” (1 mM L-Lactate, flow-rate 5 ml min
-1
,
24 ºC and detection of results every 4 min) (B).
Two variants of the working electrodes showed some differences in the initial response
values to L-lactate. There were also some differences in the kinetics of sensor inactivation.
The initial sensor output for the CP-Os-FC b
2
variant of the working electrode was near 350
nA and decreased after 5.5 hours (82 measurements) to 175 nA (half-life). The AP-Os-FC b
2
variant of the sensor showed a lower initial output (250 nA) and after 5.5 hours of work
revealed a lower signal (75 nA) as compared to the first sensor.
The storage stability of the constructed CP-Os-FC b
2
biosensor was found to be satisfactory
over more than 7 days and a half-life activity of the sensor was observed at the 5
th
day of
storage (Fig. 10).
Biosensors – Emerging Materials and Applications
410
01234567
0
100
200
300
400
500
600
0
100
200
300
400
500
600
Time, days
I, nA
Fig. 10. Storage stability of the CP-Os-FC b
2
sensor architecture (4 mM L-Lactate, 24
0
C).
2.2 Development of microbial amperometric biosensors based on the cells of
flavocytochrome b
2
over-producing recombinant yeast H. polymorpha
Currently, four different enzymes are known as biological recognition element for L-lactate
detection: lactate oxidase (LOD) (Karube et al., 1980), lactate monooxygenase (LMO)
(Mascini et al., 1984), lactate dehydrogenase (LDH) (Wang & Chen, 1994) and
flavocytochrome b
2
(Staskeviciene et al., 1991). However, microorganisms provide an ideal
alternative to enzymes, providing certain advantages in comparison with enzyme-based
biosensors: for example, avoiding isolation and purification steps for enzyme preparation;
prolonged shelf-life of the sensor due to improved stability of the biorecognition element in
the intact biological environment. Previous bacterial biosensors for L-lactate were
successfully constructed using the whole cells of Paracoccus denitrificans (Kalab & Skladal,
1994), Acetobacter pasteurianus (Luong et al., 1989), Alcaligenes eutrophus (Plegge et al., 2000)
and Escherichia coli (Adamowicz & Burstein, 1987). Physical robustness of yeasts in
comparison to bacteria and superior tolerances to pH, temperature and osmolarity/ionic
strength make them the preferred microorganisms, with the potential to be used as
biological recognition elements for cell-based biosensors (Baronian, 2004). The application of
the yeast H. anomala to oxidise L-lactate was investigated earlier by Racek et al. using a
platinum electrode, polarised to the potential of +350 mV vs. Ag/AgCl using potassium
ferricyanide as a soluble mediator (Racek & Musil, 1987a, 1987b), and later by Kulys et al.
using carbon paste electrodes and different mediators (potassium ferricyanide, phenazine
methosulfate, organic salt of TMPD/TCNQ, methylene green, Mendola’s blue) at potentials
of +50-300 mV vs. SCE (Kulys et al., 1992). Garjonyte implemented S. cerevisiae yeast cells for
the construction of the biosensor for L-lactate using carbon paste electrodes and potassium
ferricyanide, phenozine methosulfate, 2,6-dichlorophenolindophenol sodium salt hydrate,
1,2-naphthoquinone-4-sulfonic acid salt or p-benzoquinone as free-diffusing mediators at
potentials of 0-+300 mV vs. Ag/AgCl (Garjonyte et al., 2006; Garjonyte et al., 2008).
In the meantime, the genomes of some yeast species (S. cerevisiae, H. polymorpha) were
completely sequenced and gene engineering methods allowed for the tailoring of these
microorganisms to enhance the activity of specific enzymes (Walmsley & Keenan, 2000).
Genetically modified yeast cells of S. cerevisiae were successfully used for the construction of
genotoxicity biosensors (Walmsley et al., 1997; Billinton et al., 1998), or biosensors for
estrogen (Tucker & Fields, 2001), dibenzo-p-dioxins (Sakaki et al., 2002) and copper
(Lehmann et al., 2000) detection. H. polymorpha mutants were implemented for the
Amperometric Biosensors for Lactate, Alcohols and Glycerol Assays in Clinical Diagnostics
411
development of biosensors for formaldehyde (Korpan et al., 1993) and ethanol/methanol
(Gonchar et al., 1998).
Alteration of the target enzymatic pathway may cause other additional metabolic changes in
the cell metabolism. Thus, cells have the ability to adjust their metabolism in order to adapt
to changing conditions and to survive the imposed stress. A good example of yeast cells
exhibiting such adaptation behavior was observed in genetically modified yeast cells of H.
polymorpha, used for the detection of ethanol/methanol (Gonchar et al., 1998). A defect in the
gene responsible for catalase synthesis, forced the cells to develop the mechanism of
hydrogen peroxide depletion through its extrusion from the cell. Thus, the excreted
hydrogen peroxide, which is a product of catalytic oxidation of alcohol in the yeast cell, was
used as an analytical signal for methanol detection.
In the present study, genetically-modified yeast cells of H. polymorpha, over-expressing the
enzyme L-lactate:cytochrome c-oxidoreductase (FC b
2
) were used for the construction of a
mediator-free biosensor for L-lactate. The recombinant cells were previously used for the
construction of amperometric biosensor with improved sensitivity to L-lactate. The
developed biosensor was using permeabilised cells, and the free-diffusing mediator
phenazine methosulfate was used for the electrical communication between FC b
2
and the
electrode surface (Smutok et al., 2007). Simultaneously we report the detection of L-lactate
based on the monitoring of L-lactate-dependent respiration of intact genetically-modified
cells of H. polymorpha with an increased content of FC b
2
within the cells of the recombinant
strain (Shkil et. al., 2009).
2.2.1 Construction of free-diffusing microbial amperometric sensor using
permeabilized cells of flavocytochrome b
2
over-producing recombinant yeast H.
polymorpha
Construction of the recombinant H. polymorpha strain over-producing FC b
2
included several
stages. The recombinant plasmid pGLG61_CYB2, which is based on the plasmid pGLG61 for
multicopy integration (Fig. 11A, b), was transformed to the recipient strain H. polymorpha С-
105 (gcr1 catХ) avoiding glucose repression and catalase activity. The transformants were
grown on YPD medium in the presence of increasing concentrations of geneticin G418. The
highest concentration of G418 which allows the transformants to grow was 1 mg ml
-1
. The
transformants were stabilized by cultivation in non-selective media for ten to twelve
generations with further shifting to the selective media with G418. The presence of the
expression cassette in the stable transformants was examined by PCR using corresponding
primers and genomic DNA of stable transformants as a template. Fragments of predictable
size (~ 3.3 kb) were obtained (data not shown).
The level of FC b
2
activity in cell-free extracts of the recombinant strain “tr1” was compared
with the recipient strain H. polymorpha С-105. As shown in Fig. 11B, the FC b
2
activity in the
cell-free extracts of the transformed strain “tr1” was about 3.2 U mg
-1
protein, while the
recipient strain H. polymorpha С-105 under the same growth conditions had a much lower
enzyme activity of only 0.6 U mg
-1
protein. The transformant showed 5.2 fold higher FC b
2
activity as compared to the recipient strain. After permeabilization the cells of this FC b
2
-
over-producing strain were used as biorecognition element for the construction of a
microbial L-lactate-selective amperometric biosensor.
In order to evaluate the developed L-lactate biosensor based on permeabilized cells,
phenazine methosulphate (PMS) was used as a free-diffusing redox mediator for
establishing the electron transfer between FC b
2
located at the mitochondria membrane and
Biosensors – Emerging Materials and Applications
412
LEU2 Hp
APH
TEL188
pr
GAP
H
prAOX_Hp trCYB2_Hp
B
ORFCYB2_Hp
B
AmpR
LEU2 ScEmR
prAOX_Hp trCYB2_Hp
B K
ORFCYB2_Hp
H
pGLG61_CYB2 (9.2 kb)
pHIPX2_CYB2 (7.5 kb)
a.
b.
LEU2 Hp
APH
TEL188
pr
GAP
H
prAOX_Hp trCYB2_Hp
B
ORFCYB2_Hp
B
AmpR
LEU2 ScEmR
prAOX_Hp trCYB2_Hp
B K
ORFCYB2_Hp
H
pGLG61_CYB2 (9.2 kb)
pHIPX2_CYB2 (7.5 kb)
a.
b.
0.0
0.3
0.6
0.9
1.2
1.5
1.8
2.1
2.4
2.7
3.0
Strains of H.
p
ol
y
mor
p
ha
Activity of FC b
2
, U mg
-1
C-105 tr1
(A) (B)
Fig. 11. (A) Circular schemes of the plasmids (a) pHIPX2_CYB2 (7.5 kb) and (b)
pGLG61_CYB2 (9.2 kb). The HpAOX promoter and CYB2 ORF with the terminator region
are shown as open boxes. The LEU2 genes of S. cerevisiae or H. polymorpha are shown as
hatched boxes. Genes EmR and AmpR conferring resistance to erythromycin and ampicillin
are shown as chequered boxes. The H. polymorpha truncated glyceraldehyde-3-phosphate
dehydrogenase (GAP) promoter and the geneticin resistance gene (APH) are shown as grey
boxes, the tellomeric region (TEL188) as black box. Restriction sites: H - HindIII; B - BamHI; K
- KpnI. (B) Comparison of FC b
2
activity in cell-free extracts of H. polymorpha С-105 (recipient
strain) and of the recombinant strain “tr1”.
0 200 400 600 800 1000 1200
0
500
1000
1500
2000
2500
3000
3500
b
a
Time, s
I, nA
Fig. 12. Chronamperometric current response upon subsequent additions of L-lactate aliquots
obtained with microbial sensors based on permeabilized cells of the recombinant strain of H.
polymorpha (“tr1”). (a) Immobilization of cells by means of physical entrapment behind a
dialysis membrane. (b) Entrapment of cells within a layer of a cathodic electrodeposition
polymer CP9. (3.05 mm diameter graphite disk electrode; 0 mV vs. Ag/AgCl).
the electrode surface. It was supposed that PMS can easily diffuse into the permeabilized
cell and back to the electrode. 3.05 mm graphite rod electrodes at a potential of 0.0 mV were
chosen for PMS oxidation (Garjonyte et al., 2006). Since it has been shown previously that
isolated FC b
2
exhibits only a limited stability (Smutok et al., 2005), it was suggested that the
application of intact cells with the inherent ability to keep the enzyme protected in a
membrane-bound state would significantly improve the properties of the sensors.
Amperometric Biosensors for Lactate, Alcohols and Glycerol Assays in Clinical Diagnostics
413
Two different immobilisation methods were evaluated, namely, the physical fixation of
permeabilized cells behind a dialysis membrane and the entrapment of the cells within an
electrodeposition paint layer which is formed in the presence of the cells. A typical sensor
response for both sensor architectures is shown in Fig. 12. The output of the sensor prepared
by electrochemically induced precipitation of the cathodic electrodeposition polymer CP9
under simultaneous entrapment of the permeabilized cells within the hydrogel layer
exhibits a higher current response upon addition of L-lactate. In addition, due to the
favourable diffusion of the substrate and the mediator to the polymer entrapped cells these
sensors showed a faster response time. The rate of the sensors’ response to 0.1 mM L-lactate
is about 190 nA·min
-1
for the polymer entrapment system and 60 nA·min
-1
for the system
with a dialysis membrane, respectively.
To evaluate the impact of the genetic modifications performed on the bioanalytical
characteristics of the cells, L-lactate sensors based on either permeabilized cells of the
recombinant strain “tr1” or cells of the recipient strain “C-105” entrapped within the
cathodic electrodeposition paint were compared. Since the difference between both strains is
determined mainly by the FC b
2
content, it was expected that the current response of the
sensor based on the genetically engineered cells was significantly enhanced.
0123456
0
500
1000
1500
2000
2500
3000
3500
(A)
b
a
I, nA
[L-lactate], mM
Chi^2/DoF = 698.98687
R^2 = 0.999
I
max
=
5260
±
280 nA
K
M
=
8.1
±
0.7 mM
Chi^2/DoF = 8856.554
R^2 = 0.994
Imax = 6050
±
670 nA
K
M
= 6.0
±
1.1 mM
0123456
0
10
20
30
40
50
60
70
80
(B)
I, nA
[L-lactate], mM
Chi^2/DoF = 48.04213
R^2 = 0.956
I
max
=
83.1
±
5.7
nA
K
M
=
0.33
±
0.09
mM
Fig. 13. (A) L-lactate calibration graphs for two types of sensors modified by genetically
engineered H. polymorpha “tr1” cells (a - physical entrapment behind a dialysis membrane; b
- electrochemically induced entrapment within a cathodic electrodeposition polymer CP9);
(B) L-lactate calibration graph for sensor modified by H. polymorpha “C-105” cells by
physical entrapment behind a dialysis membrane.
As clearly shown in Figure 13, a significantly increased current response is observed upon
L-lactate addition for the sensors based on the genetically engineered cells “tr1” as
compared with the wild-type strain “C-105”. The maximal current I
max
at substrate
saturation for the “C-105” cells-based sensor was 83.1 ± 5.7 nA, while the “tr1” cell-based
electrode showed an I
max
of 5260 ± 280 nA under the same conditions. These results indicate
that the maximum contribution of other L-lactate oxidizing enzymes within the cells, which
should be similarly present in both the “tr1” and “C105” cells, does not exceed 80 nA at
substrate saturation. This value represents only about 1.5 % of the maximum sensor output
of 5260 nA. It could be hence concluded that most of the contribution to the sensor current
originates from the added FC b
2
activity of the recombinant strain.
Biosensors – Emerging Materials and Applications
414
In addition, sensors based on genetically engineered “tr1” cells exhibit a 20 to 25 times
higher K
M
value irrespective of the immobilization method. The calculated values for K
M
app
derived from the calibration plots are 0.33±0.09 mM for sensors based on “C-105” cells and
8.0±0.66 mM for “tr1”cells. To investigate whether the K
M
values of the cell-based sensors
depend on the differences in properties of FC b
2
itself or are dominated by the significantly
higher enzyme loading in the case of the “tr1” cells, a L-lactate sensor based on FC b
2
isolated from “tr1” cells was prepared using physical entrapment of the enzyme behind a
dialysis membrane for enzyme immobilization (Fig. 14).
0123456
0
200
400
600
800
1000
1200
1400
0 200 400 600 800 1000
0
200
400
600
800
1000
1200
1400
I, nA
Time, s
[L-lactate], mM
I, nA
Chi^2/DoF = 563.84475
R^2 = 0.998
Imax 1980
± 76 nA
K
M
3.02
± 0.25 mM
Fig. 14. L-lactate calibration curve and chronoamperogram (insert) of a biosensor based on
isolated FC b
2
isolated from recombinant “tr1”cells.
The K
M
app
of FC b
2
purified from recombinant “tr1” cells was determined from the
calibration graph as 3.02 ± 0.25 mM (toward L-lactate) which is about 10 times higher than
the K
M
app
value of the sensor using permeabilized “C-105” cells. Obviously, restriction of the
diffusion mass transfer through the permeabilized cells cannot be the reason for the
observed increase in the K
M
app
value. Hence, the structure of FC b
2
produced by the
recombinant cells must be modulated, leading to a significantly decreased affinity of the
active site of the enzyme for complementary binding of L-lactate. This may be due to errors
caused by the Taq DNA-polymerase in vitro, which may lead to minor changes in the
primary structure of the PCR product and consequently may result in amino acid
substitutions in the FC b
2
molecule. The observed increased K
M
app
value for recombinant
cells and the enzyme isolated from these cells had a positive impact on the biosensor
properties due to the increase of the linear range for L-lactate determination, up to 1.6 mM.
The increased linear detection range is better adapted to the typical concentration range of
L-lactate in real samples, thus avoiding dilution steps. The detection limit of the sensor is
low (about 6 μM L-lactate). The optimal pH-value for the developed L-lactate biosensor
based on the recombinant cells is in the range of 7.5 to 8.2, with an optimal temperature
between 36 and 42
0
C.
For the application of the L-lactate biosensor in real samples, the selectivity with respect to
potential substrates/interferents such as D-lactate, pyruvate, succinate, L-malate, citrate, α-
ketoglutarate, urate, D-glucose and ethanol is of great importance. Hence, the amperometric
current response of the cell-based L-lactate sensor was evaluated with respect to the above
mentioned compounds (Fig. 15).
Amperometric Biosensors for Lactate, Alcohols and Glycerol Assays in Clinical Diagnostics
415
L
-
l
ac
t
a
t
e
D
-
l
act
at
e
p
y
r
u
v
a
t
e
su
cc
i
n
at
e
L
-
m
al
a
t
e
c
i
t
r
a
t
e
ket
o
g
l
u
t
ar
at
e
u
r
e
at
e
D
-
g
l
u
c
o
s
e
E
t
O
H
0
5
10
15
20
25
30
35
200
400
600
800
1000
0
5
10
15
20
25
30
35
200
400
600
800
1000
Output
analytes
I
max
, nA
%, to L-lactate output as 100 %
Fig. 15. Selectivity of the L-lactate biosensor (863 nA; 100 %) based on electrochemically
immobilized H. polymorpha “tr1” cells. The current and the relative response of 1 mM
solutions of D-lactate (0.92 nA; 0.1 %), pyruvate (0.0 nA; 0 %), succinate (17.7 nA; 2 %), L-
malate (1.88 nA; 0.22 %), citrate (0.0 nA; 0 %), α-ketoglutarate (1.9 nA; 0.22 %), urate (3.07
nA; 0.36 %), D-glucose (6.29 nA; 0.73 %), and ethanol (11.1 nA; 1.29 %) are displayed.
The cell-based biosensor exhibits minor cross-sensitivity to most of the tested compounds.
With the exception of succinate, D-glucose and ethanol the relative cross-sensitivity is below
1 %. Thus, the impact of these compounds will be insignificant for the determination of L-
lactate in the real samples where the above mentioned components may be present.
The operational and storage stabilities of the L-lactate sensor were investigated. Biosensors
were prepared following the optimal preparation protocol for both immobilization
techniques of the permeabilized “tr1” cells. The stability tests were performed at a constant
temperature of 24
0
C using 1 mM solutions of L-lactate in 50 mM phosphate buffer, pH 7.8,
for the investigation of the operational stability, and a 3 mM L-lactate solution - for the
evaluation of the storage stability. The operational stability was evaluated using an
automatic sequential injection analyzer (W. Schuhmann et al., 1995). The sensors were
integrated into a flow-through electrochemical cell, and 15 injections of 500 µl of a 1 mM L-
lactate standard solution per hour were performed automatically. Fig. 16 shows the peak
currents of the different L-lactate sensors upon sample injection over a period of about 24
hours (approximately 360 individual measurements).
Both types of cell-based sensors demonstrated a linear decay of the current response during
continuous operation over 24 hours (360 injections of 1 mM L-lactate solutions). In another
experiment the peak currents decayed to 50 % of the initial sensor output after about 26-30
hours of continuous operation. Despite the continuous decrease of the sensor output the
developed biosensors exhibited satisfactory operational stability for L-lactate determination
in model samples, especially when integrated in the sequential injection analyser that allows
for a repetitive recalibration.
Next, the storage stability of the different sensor configurations was tested. For this, the
sensors were stored between amperometric L-lactate determinations at + 4°C (Table 1). The
measurements were performed at room temperature in 50 mM phosphate buffer, pH 7.8,