Photodiodes Communications Bio Sensings Measurements and High Energy Part 11 docx
Bạn đang xem bản rút gọn của tài liệu. Xem và tải ngay bản đầy đủ của tài liệu tại đây (2.36 MB, 20 trang )
UV Photodiodes Response to
Non-Normal, Non-Colimated and Diffusive Sources of Irradiance
191
(which is in this case blocked). By doing this we evaluate the unfiltered contribution of a
direct beam, i.e. the direct beam photons that reach and excite the sensing dice avoiding the
nominal FOV and thus avoiding the filter. The photodiode base was glued again to the can.
Notice that after this manipulation the TO5 cage is filled in by ambient air instead of the
original nitrogen encapsulation.
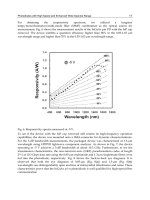
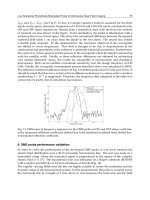
Fig. 5. Zenithal angle dependence of the responsivity to an inclined collimated beam for the
SiC unfiltered photodiode (ABC) and 5 filtered photodiodes (A, B, C, D and E). Comparison
of the angle dependence between cosine-like decay and a polynomial fit of the measured
data with angle. Notice that for a collimated source the photodiodes show significant
responsivity beyond the nominal FOV of ± 30º.
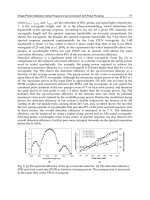
In Figure 6 we show the spectral response of this open-blocked photodiode and compare it
with the one of a normal C photodiode. Be aware that the filter partially transmits, partially
reflects, and partially absorbs. Each specific filter has a different behaviour with respect to
transmission and absorption, tuned to select the transmissions properties only. When
photons are trapped below the filter, bouncing back and forth until they hit the dice, the
filter may also absorb a spectral part of the irradiance. In this specific example a relevant
part of the signal of the UVA range seems to be partially blocked, but most of the UVB range
radiation is hitting the SiC dice through secondary wall reflections creating a current leak.
Thus we may expect different responses for blocked photodiodes of different filters. As we
will see later this is indeed observed.
2.3 Characterization of the angular response of the non-filtered contribution with a
divergent beam
To qualitatively evaluate under laboratory conditions the angular response of the unfiltered
contribution, a new photodiode was manipulated to separate, in the total current signal, the
Photodiodes – Communications, Bio-Sensings, Measurements and High-Energy Physics
192
contribution from the filtered signal and the unfiltered contribution. This time a D type
photodiode was opened and blocked.
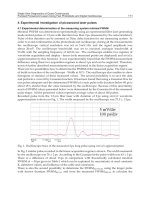
Fig. 6. Spectral response of the open-blocked C photodiode and comparison with original
nominal spectral response. The open-blocked responsivity shows the spectral signature of
the non-filtered contribution in a C photodiode and extends beyond the nominal UVC
range.
A xenon (Xe) light source was placed at a distance of 24 cm to the photodiode (such that the
cone of collimated light diverges) and its inclination angle with respect to the diode was
varied, see Figure 7. This setup was hard to control but the results give significant
qualitative information. The maximal unfiltered response is at normal incidence, when the
divergent beam hits the photodiode from above. A fraction of the divergent light beam
intersects the housing walls; the light in these rays is internally reflected and reaches the
dice. As the source goes to lower azimuthal positions, i.e. greater zenithal angle, the signal is
reduced up to an angle of roughly 15-20º where it has a minimum. At this point the light
beam is half-way to the nominal field of view limit (30º) which is given by the mechanical
obstruction of the upper edge in the housing wall. From this point on most of the direct rays
hit the side walls. They are then scattered and reflected and reach the dice avoiding the
filter. The signal increases then up to roughly 40º-45º. Beyond this point there is a rapid
decay and light is partially reflected back at the crystal interface because of the critical angle
limit, see Figures 7 and 8. In view of this, we conclude that for field campaign observations,
when the Sun direct light beam has a zenithal angle close to 40º-45º (or equivalently an
altitude angle between 50º-45º), the measurements of photodiodes where the unfiltered
contribution may be comparable to the filtered one shall be discarded.
UV Photodiodes Response to
Non-Normal, Non-Colimated and Diffusive Sources of Irradiance
193
Fig. 7. Schematic representation of the laboratory setup. The beam of the Xe lamp was
inclined with respect to the norm to the photodiode. The D photodiode was open, its filter
was blocked, and the sensor housing was glued again, to quantify the angular dependence
of the non-filtered contribution.
Fig. 8. Non-filtered photodiode's zenithal angle response with an inclined divergent light
source exciting a blocked D type photodiode. There is a maximum in the induced current at
normal incidence, when a fraction of the cone of the divergent beam hits the inner walls of
the caging. As the beam is inclined there is a secondary maximum at 40º-45º, when the
centre of the direct divergent beam hits the walls, and is reflected downwards to the sensing
dice (avoiding the blocked filter).
Through these experiments we have illustrated the existence of internal reflections for direct
beam sources. We therefore redefine a REMS-UV operational strategy that discards
observations when the Sun direct beam is in the vicinity of 40-45º w.r.t. the norm. We will
Photodiodes – Communications, Bio-Sensings, Measurements and High-Energy Physics
194
evaluate how relevant this internal reflection contribution is for the unavoidable and
continuous background of diffusive irradiance.
3. Response characterization under representative operation conditions
To investigate the response to an extended distant source such as the Sun with a background
source of diffuse irradiance a special implementation was prepared to operate outdoors in a
clear sky day, see Figure 9. For Terrestrial atmospheric measurements, we expect channels C
and D to be especially sensitive to the non-filtered contribution because their filters are centred
on the ozone absorption band and therefore on Earth the signal in these channels shall be
negligible. Any extra signal must be due to an unfiltered contribution.
Fig. 9. Engineering model for field campaign measurements. The direct beam (Sun) angle of
incidence can be varied by adjusting the platform inclination.
Three different photodiodes types were used per channel: a flight model unit, this one shall
be here named fm, and two engineering photodiodes that are manipulated. In these last two
photodiodes, because of the manipulation (loss of encapsulated nitrogen, mechanical
distortion and misalignment after cutting and gluing the housing) we may expect a
variation in the response with respect to the flight model units. One of these photodiodes,
which is simply opened and glued again, is used as control reference to discard the
influence of the manipulation alone (namely loss of the encapsulated gas), this one is from
here on named op. The other one is opened, its filter is blocked, and then it is glued again,
this one shall be named ob.
3.1 Angular characterization of the unfiltered diffuse radiation
The photodiode platform was placed horizontally, facing the sky. During this day the
maximal Solar Zenithal Angle (SZA) was at 57.5º, and therefore the trajectory was very low
UV Photodiodes Response to
Non-Normal, Non-Colimated and Diffusive Sources of Irradiance
195
with respect to the FOV of the photodiodes. The recorded signal was thus the response to
the sky diffuse irradiance contained within the solid angle of view of the photodiode. This
includes both the diffuse irradiance within the nominal FOV (filtered contribution) and the
rest, up to the critical angle FOV (unfiltered contribution). The measured current varies
smoothly as the SZA changes along the day. For photodiode C, in the vicinity of the
maximal SZA, the diffuse unfiltered contribution (ob) is about 30% of the total signal in the
control photodiode (op) whereas for big SZA the unfiltered signal is about 50% of the total
one, see Figure 10. This is a smooth function and may be easily interpolated. The fm
response is shown for reference.
Fig. 10. Comparison of the evolution of the three C photodiodes: flight-model (fm), open-
blocked (ob) and C open (op) measurement along the day, as the Sun traverses the sky. For
this configuration the sun transit avoids both the nominal FOV and the critical angle FOV.
Thus the measured current is produced in response to the diffuse irradiance alone.
In Figure 11 we compare this measurement for different ob channels. Since their filters are
blocked their response is basically associated to the response of the SiC dice. When the filter
is blocked, the order of magnitude of the signal of different blocked photodiodes is similar
but there are differences of the order of up to 30% among them (which may be due to
geometrical factors after manipulation or to differences in the coating of the lower part of
filters). The averaged intensity of this current is about 50 times less the one of the unfiltered
photodiode ABC, see Figure 11.
Photodiodes – Communications, Bio-Sensings, Measurements and High-Energy Physics
196
Fig. 11. Comparison of the unfiltered response of all photodiodes, averaged unfiltered
response and rescaled (by 50) current of the total ABC photodiode in a configuration where
only diffuse irradiance reaches the photodiode.
This suggests that, for this kind of photodiode, a fraction of the UV sky diffuse irradiance
avoids the central filter of the photodiode and hits the bottom SiC diode directly producing
a leakage signal of the order of about 2% of the total UV (ABC channel) induced current. If
the channel of observation expects a very small signal for its nominal spectral range, this
current leakage can be comparable or even greater than the one of interest. In particular, as
shown above for the C channel, this represents almost 30% of the total measured current of
the nominal channel, or even 50% for big SZA.
3.2 Angular characterization of the unfiltered direct beam contribution
For the next experimental setup the sensors are again facing the sky, pointing upwards. If
the Sun during its trajectory is never within the nominal FOV of the photodiode but passes
within the critical angle FOV there are two observable maxima at 45º that can be seen in the
measurements of all photodiodes (both manipulated and original). See Figure 12 for an
example of the response of the C photodiode when the solar transit never enters its nominal
FOV. The two maxima at 45º correspond to direct beam wall reflections and thus appear
also as unfiltered contribution in the ob photodiode. In this setup the photodiodes collect
both the inner wall reflection of the direct beam rays (from the Sun) and the diffuse
radiation rays (from the sky). The direct beam induced maxima are at about 45º. Beyond this
point, when the Sun leaves the critical angle FOV, we should be able to obtain information
about the envelope of the diffuse signal as in the example above. Indeed beyond 50º there is
a change in the shape of the angle dependent response, at this moment the direct beam is
fully reflected because of critical angle issues and the current is induced only by the
UV Photodiodes Response to
Non-Normal, Non-Colimated and Diffusive Sources of Irradiance
197
background sky diffuse irradiance (the one studied above). Also in this case we observe that
for big SZA the nonfiltered signal is about 50% of the total one.
Fig. 12. Comparison of the evolution of the three C photodiodes: flight-model (fm), open-
blocked (ob) and C open (op) measurement along the day, as the Sun traverses the sky. For
this configuration the sun trajectory never enters the nominal FOV. However it is reflected
in the inner photodiode walls and two maxima are observed at roughly 45º.
3.3 Angular characterization of the direct beam: filtered contribution and sunglint
On the next experiment the platform was inclined and pointing to the maximal solar altitude
at 40.2º. Figure 13 shows the current evolution for an fm photodiode when the sensor platform
is oriented towards the Sun maximal altitude position. When the angle of incidence falls
between ± 30º with respect to the norm the direct beam is filtered. As was foreseen from
laboratory measurements and from the field campaign measurements described in the
previous sections, there are two additional maxima at about ± 40º-45º angle of incidence. This
represents again secondary reflections of the direct Sun beam within the inner housing walls
that manage to avoid the filter and produce a current leak. This unfiltered contribution is so
big for the C photodiode that at this stage the total induced current is even bigger than at
normal incidence. Beyond that point the signal decays rapidly due to critical angle reflection
and the current is induced only by the background sky diffuse irradiance.
In Figure 14 we show for comparison the currents induced in two manipulated C
photodiodes. This graph shows that the total irradiance contribution reaching the C sensing
dice is partially filtered and partially non-filtered. We observe that for this channel the non-
Photodiodes – Communications, Bio-Sensings, Measurements and High-Energy Physics
198
filtered contribution is about 50% of the total measured signal. Two maxima can be
distinguished at ±45º with respect to the norm. These last two measurements, with the
manipulated photodiodes, show an extra non-filtered maximum when the Sun in just above
the norm to the sensors which happens when the solar altitude is at 40.2º. In this inclined
configuration, this artefact is due to the Sun glint contribution. The direct beam is reflected
on the ground and hits the photodiode with an incidence angle of 40.2º, see Figure 15. In the
case of manipulated photodiodes (those that were opened, filled in by normal air, and glued
again) this sunglint contribution passes giving a spurious signal. This sunglint contribution
seems to be more efficiently rejected in the flight model unit probably due to critical angle
issues. The sunglint is not important for REMS application, where the photodiodes will be
facing the sky, but may be relevant for other applications with partial view of the ground.
Fig. 13. Evolution of the C fm photodiode measurement along the day, as the Sun traverses
the sky crossing the normal to the sensor. The platform was pointing to the maximal altitude
position. There are to local maxima at zenithal angles of about 40º-45º.
4. Overall experimental verification and definition of mitigation strategy
Next we show a summary of this field site verification with all channels measuring
simultaneously with an inclined platform configuration, pointing towards the Sun maximal
altitude position at 47.9º. In this configuration when the opened photodiodes have been
filled in by normal air, the signal shows again an enhanced unfiltered signal due to sunglint.
This unfiltered sunglint contribution is clearly distinguished as a central extra peak in
channels expecting weak signals (namely C and D).
UV Photodiodes Response to
Non-Normal, Non-Colimated and Diffusive Sources of Irradiance
199
Fig. 14. Evolution of the response of manipulated C photodiodes. Comparison of the open-
blocked (ob) and C open (op) measurement along the day, as the Sun traverses the sky. The
open-blocked (ob) induced current is the signal induced by unfiltered reflected radiation
only whereas the open (op) induced current is the sum of the currents induced on the SiC
dice by the unfiltered and filtered radiation.
Fig. 15. Sunglint unfiltered contribution for inclined configurations.
For channels A and E the leakage is negligible compared to the nominal signal, see Figure
16. The induced current is smooth and follows the Sun trajectory. The red curve represents
the unfiltered contribution (both diffuse and reflected direct irradiance) which in this case is
almost negligible. The envelope of these graphs is the sum of the envelope of the
background sky diffuse irradiance and, within ± 45º , the envelope of direct irradiance.
For channel B there is a significant, and almost constant, background of unfiltered
contribution that creates a constant current leakage of about 10% of the maximal signal, see
Photodiodes – Communications, Bio-Sensings, Measurements and High-Energy Physics
200
Figure 17. Again, the envelope of these graphs shows one shape for the background sky
diffuse irradiance and, within +/- 45º, another envelope for the diffuse plus direct response.
The constant background of unfiltered contribution is due to the unfiltered diffuse
irradiance of the sky.
Fig. 16. Diurnal evolution of the measured current for an inclined configuration pointing to
the maximal SZA. (Above) Channel A (Below) Channel E.
UV Photodiodes Response to
Non-Normal, Non-Colimated and Diffusive Sources of Irradiance
201
Fig. 17. Diurnal evolution of the B measured current for an inclined configuration pointing
to the maximal SZA.
For the C and D manipulated photodiodes, the induced current shows an enhanced,
unfiltered response, at SZA of 0 w.r.t to the norm because of sunglint unfiltered reflections,
see Figure 17. The flight model units do not show this sun glint contribution. In these ones
the two side peaks of direct beam reflections at about 45º are better seen. Notice that beyond
the FOV (beyond 45º roughly) all the photodiodes show the same response as the ob one, which
means that beyond this point the induced current in both C and D photodiodes is pure unfiltered
contribution of the background sky diffusive irradiance.
The central enhanced peaks are seen in manipulated photodiodes with weak expected
currents, namely C and D channels. And are not seen in the ABC opened, A ob, E ob and B
ob. This confirms that is a current leakage of unfiltered contribution of the sunglint
contribution of the ground.
Finally by comparing the average response of all photodiodes in the tails (namely beyond
45º) of the ABC signal, we conclude again that there is a continuous background unfiltered
contribution which is of the order of 2-4% of the total (ABC channel) incident UV solar diffuse
irradiance, see Figure 19. This 2-4% introduces a systematic error of current leakage due to
diffuse irradiance in all filtered photodiode signals which should be treated as system
background error to be subtracted.
In summary, with these observations we can adapt the REMS-UV operational scenario.
Namely 1) measure the response of the ABC photodiode when the Sun is out of the FOV
(roughly beyond ± 45º) which is the response to the sky diffuse irradiance alone, and fit its
dependence with angle of incidence. 2) Discard those filtered channels whose measurement is
comparable with the 2% of the current induced by diffuse radiation in the ABC channel. 3)
Subtract this offset contribution to those channels with greater currents, namely, on Earth, A, B
and E. 4) Discard measurements performed when the Sun is close to ± 45º with respect to the
norm as they may produce unfiltered direct beam contributions due to inner wall reflections.
These measurements should be neglected for absolute radiometric measurements (however
they could be used for relative comparisons of day to day relative atmospheric changes).
Photodiodes – Communications, Bio-Sensings, Measurements and High-Energy Physics
202
Fig. 18. Diurnal evolution of the measured current for an inclined configuration pointing to
the maximal SZA. (Above) Channel D. (Below) Channel C.
Finally regarding REMS measuring strategy during operations on Mars we suggest to define
a conservative measuring strategy using the recalibrated currents of photodiodes ABC, A, B
and E; and use C and D corrected measurements as check points for interpolating
algorithms [Zorzano et al. 2009] It must be clarified that on Mars channels C and D are
expected to have much greater currents than on Earth since the UVC radiation is not
blocked by the atmospheric ozone as on Earth. These measurements have not been
performed to date on the Martian surface and thus if during the mission C and D currents
UV Photodiodes Response to
Non-Normal, Non-Colimated and Diffusive Sources of Irradiance
203
are much greater than the 2% of the ABC diffuse signal these two measurements may be
also included as inputs for the interpolating algorithms.
Fig. 19. Evolution along the day of the diffuse unfiltered contribution in filtered channels
compared to the total diffuse signal of the total ABC channel.
5. Conclusions
Photodiode sensors are calibrated under controlled laboratory conditions, with collimated,
plane light beams at normal incidence with respect to the sensing device. For any other
implementation the photodiode needs to be calibrated under representative operation
conditions. It is hard to simulate the UV diffuse radiation environment of an atmosphere
under laboratory calibration setups. It is also hard to simulate sunglint or secondary
reflections induced by reflecting surfaces with small lamps in calibration setups. Dedicated
campaigns such as the ones described here should be implemented for this purpose.
In summary, through laboratory and field campaign measurements we have illustrated that:
The response of the photodiode to a pure, direct, collimated light beam does not decay
simply as a cosine law with a cut-off edge at the end of the FOV.
The sensing dice is also excited by direct beams with angles beyond the nominal FOV
that are reflected in the inner housing walls. A second maximal response may be
expected for incident angles close to 45º, when the direct beam is reflected on the inner
housing walls.
For certain configurations, also sunglint contributions (or in general reflections of the
direct beam source on nearby surfaces) may create unwanted reflected contributions
that should taken into account.
Photodiodes – Communications, Bio-Sensings, Measurements and High-Energy Physics
204
Equivalently, also the rays of diffuse irradiance with angles greater than the nominal
FOV can hit the inner housing walls and reach the sensing dice.
For the photodiodes used in this test, photon rays with incident angle beyond the
nominal FOV, that are reflected in the inner walls of the housing (both the direct and
diffuse beam contribution) may avoid the filter action.
The fraction of radiance that gets to the dice avoiding the filter generates an unexpected
unfiltered contribution to the photodiode current. This spurious current leak may be
comparable to the nominal contribution, in narrow filtered channels or in spectral
ranges where little incident radiation is expected. A mitigation strategy should be
implemented to cope with this.
This problem may be common to other sensors used in radiometry or remote sensing
applications. Under realistic operation conditions, the radiance comes from multiple paths and
it is furthermore not isotropic and also non-normal. Some examples of this situations are:
If part of the incident radiation hits a surface, a fraction of it may be reflected in an
almost specular way and another fraction be scattered away. These other components
of irradiance may reach the detector through secondary pathways (example satellite
observation of ground reflectance contaminated with sun glint and diffused
contribution from lambertian surfaces with different angle of incidence).
If the medium between the source and detector include scattering agents (such as
molecules or aerosols) the diffuse component of the radiation may become significant
and therefore reach the sensor from other incident angles.
Finally even in the case when the direct source beam points to the sensor from angles of
incidence beyond its nominal FOV, secondary reflections within the detector housing
may allow this radiation to reach the sensing device.
An alternative approach to the use of filters is the use of new tailor-made substrates where
the band gap of the photo absorption layer is tuned to select the desired specific range of UV
radiation. In particular, recently there is great interest in the development of the so-called
solar-blind detectors for applications on Earth. As mentioned above, bellow 280 nm the UV
radiation is absorbed by the terrestrial atmosphere and thus the highest-energy UV light
photons from the sun cannot reach the surface. As a result, this region of the solar
electromagnetic spectrum constitutes a ‘black background’ that can be used to detect and
control artificial UVC-emitting sources such as flames (and thus detect for instance fires, or
missiles). These measurements require detectors that are ‘solar blind,’ i.e., insensitive to light
above 280nm, and that focus their spectral responsivity in the range of UVC. Current
research on solar-blind photodetectors substrates include the development of new
substrates such as nano-wires [Delaunay, 2011 and references herein] or
Al
x
Ga
1-x
N-based substrates [Razeghi, 2002]. This alternative is generally very costful -since it
requires development and testing of new materials-, and is not always possible for any
arbitrary spectral range. Furthermore the use of new sensing substrates may not be
convenient for space applications where all the materials must be qualified for space and the
maturity of the technology needs to be well proven.
6. Acknowledgements
We thank the support from the REMS team and MSL mission to Mars. This project is funded
by the Industry Ministry (CDTI), Science and Innovation Ministry (project ESP2007-65862)
UV Photodiodes Response to
Non-Normal, Non-Colimated and Diffusive Sources of Irradiance
205
and Defence Ministry of Spain. We also acknowledge the work of J. Barbero from ALTER
Technology Group Spain, Roser Urquí from REMS project, and the National Physical
Laboratory (UK) who have contributed to the calibration process.
7. References
Cockell, C.S., Catling, D.C., Davis, W.L., Snook, K., Kepner, R.L., Lee, P., McKay, C.P., 2000.
The ultraviolet environment of Mars: biological implications. Past, present, and
future. Icarus 146, 343.
Córdoba-Jabonero, C., Lara, L.M., Mancho, A. M., Marquez, A., Rodrigo, R., (2003).
Solar Ultraviolet transfer in Martian atmosphere: biological and geological
implications Planet. Space Sci. 51, 399-410.
Cordoba-Jabonero, C., Zorzano, M P., Selsis, F., Patel, M.R., Cockell, C.S., (2005).
Radiative habitable zones in Martian polar environments. Icarus 175, 360-371.
Delaunay J-J, Li, Y., Tokizono, T., Liao, M., Koide, Y. (2011). Wide-bandgap nanowires for
UV-light detection. Optoelectronics & Communications. SPIE.
10.1117/2.1201102.003466
Gómez-Elvira, J., and REMS Team, Environmental monitoring station for Mars Science
Laboratory, Proceedings of LPI Contributions, 1447, p. 9052. (2008).
Holland, H. D., 1978. The Chemistry of the Atmosphere and Oceans. Wiley lnterscience, New
York.
Kinch, K.M., Merrison, J.P., Gunnlaugsson, H.P., Bertelsen, P., Madsen, M. B., Nørnberg, P.
(2006). Preliminary analysis of the MER magnetic properties experiment using a
computational fluid dynamics model. Planet. Space. Sci. 54, 28-44.
Mateshvili, N., Fussen, D., Vanhellemont, F., Bingen, C., Dodion, J., Muller, C., Depiesse, C.,
Perrier, S., Bertaux, J.L., Dimarellis, E. 2006. Martian clouds distribution obtained
from SPICAM nadir UV measurements: preliminary results. Second workshop on
Mars atmosphere modelling and observations, held February 27 - March 3, 2006
Granada, Spain. Edited by F. Forget, M.A. Lopez-Valverde, M.C. Desjean, J.P. Huot,
F. Lefevre, S. Lebonnois, S.R. Lewis, E. Millour, P.L. Read and R.J. Wilson.
Publisher : LMD, IAA, AOPP, CNES, ESA.
Montmessin, F., Quemerais,E., Bertaux,J. L. , Korablev,O. , Rannou,P. And Lebonnois,S.
(2006). Stellar occultations at UV wavelengths by the SPICAM instrument: Retrieval
and analysis of Martian haze profiles, J. Geophys. Res., 111,No. E12, E12S06
Mukhin, L.M., Koscheev, A.P., Dikov, Y.P., Hurth, J., WRanke, H., (1996). Experimental
simulations of the photodecomposition of carbonates and sulphates on Mars.
Nature 379, 141.
Patel, M.R.; Zarnecki, J.C. and Catling, D.C. (2002). Ultraviolet radiation on the surface of
Mars and the Beagle 2 UV sensor. Planetary and Space Science, 50(9), pp. 915–927.
Patel, M.R., Bérces,A., Kolb, C., Rettberg, P., Zarnecki, J. C. and Selsis, F., (2003). Seasonal
and Diurnal Variations in Martian Surface UV Irradiation: Biological and Chemical
Implications for the Martian Regolith. International Journal of Astrobiology, 2 (1), pp
21-34.Quin, R.C., Zent, A.P., McKay, C.P., (2001). Photodecomposition of
carbonates on Mars. Lunar Planet. Sci. Conf. XXXII, 1463.
Photodiodes – Communications, Bio-Sensings, Measurements and High-Energy Physics
206
Patel, M.R., Bérces, A., Kerkgyrt, T., Ront, G., Lammer, H. and Zarnecki, J.C., 2004. Annual
Solar UV Exposure and Biologically Effective Dose Rates on the Martian Surface.
Advances in Space Research, 33 (8), pp 1247-1252.
Razeghi, M. Short-wavelength solar-blind detectors-status, prospects, and markets. Proceedings of
the IEEE, Jun 2002, vol 90., 6, pp. 1006-1014.
Rodrigo, R., Garcia-Alvarez, E., Lopez-Gonzalez, M. J., Lopez-Moreno, J., (1990). A
nonsteady one-dimensional theoretical model of Mars' neutral atmospheric
composition between 30 and 200 KM. Journal of Geophysical Research (ISSN 0148-
0227), vol. 95, Aug. 30 p. 14795-14810.
Vazquez L, Zorzano MP, Jimenez S. (2007). Spectral information retrieval from integrated
broadband photodiode Martian ultraviolet measurements. Optic Letters 32(17) 2596-
2598.
Zorzano, M.P., Vázquez, L., Jiménez, S. (2009). Retrieval of ultraviolet spectral irradiance
from filtered photodiode measurements. Inverse Problems, vol. 25 pp.115023-115032
(2009).
Zorzano, M P., Mancho, A M., Vazquez, L. (2005). Numerical integration of the discrete-
ordinate radiative transfer equation in strongly non homogeneous media. Applied
Mathematical and Computation, 164, 263-274.
Zorzano M P., Cordoba-Jabonero C (2007). Influence of aerosol multiple scattering of
ultraviolet radiation on Martian atmospheric sensing. Icarus 2007, vol. 190, no2, pp.
492-503.
11
Detection of VUV Light
with Avalanche Photodiodes
Cristina M. B. Monteiro, Luís M. P. Fernandes
and Joaquim M. F. dos Santos
Instrumentation Centre (CI), Physics Department, University of Coimbra
Portugal
1. Introduction
Silicon avalanche photodiodes are alternative devices to photomultiplier tubes in photon
detection applications, presenting advantages that include compact structure, capability to
sustain high pressure, low power consumption, wide dynamic range and high quantum
efficiency, covering a wider spectral range. Therefore, they provide a more efficient
conversion of the scintillation light into charge carriers. Major drawbacks are lower gains, of
few hundreds, higher detection limits and non-uniformities in the percent range.
Windowless APDs with spectral sensitivity extended downto the VUV region (~120 nm)
have been developed by API [1], RMD [2] and Hamamatsu [3]. They have been used as
photosensors for scintillation light produced in noble gases [4-6] and liquids [7-10] for X-
and γ-ray spectroscopy applications. Up to now, the main application of APDs as VUV
detectors is aimed for a neutrinoless double beta decay experiment using high pressure
xenon [6].
Wide band-gap semiconductor photodiodes such as GaN and SiC are also alternative to
photomultiplier tubes in UV detection. However, compared to Si-APDs, they present
smaller active area of the order of the mm
2
, with higher wafer non-uniformities, lower
quantum efficiency and reduced spectral sensitivity in the VUV region (usually useful above
200 nm). On the other hand, they present some advantages, namely the lower biasing
voltages, higher gains with lower leak currents, the solar blind capability. Recent reviews on
these APDs can be found in [11-17] and references therein.
Through the last decade, we have investigated the response characteristics of a large area
APD from API to the scintillation VUV light produced in gaseous argon and xenon at room
temperature [4,5]. The emission spectra for argon and xenon electroluminescence is a
narrow continuum peaking at about 128 and 172 nm, respectively, with 10 nm FWHM for
both cases [18], and corresponds to the lower limit of the APD spectral response. For the 128
and 172 nm VUV light from argon and xenon scintillation, the effective quantum efficiency,
here defined as the average number of free electrons produced in the APD per incident VUV
photon is 0.5 and 1.1, respectively, corresponding to a spectral sensitivity of about 50 and
150 mA/W [4,19].
In this chapter, we review and summarize the results of our investigation, namely the gain
non-linearity between the detection of X-rays and VUV light [20], the gain dependence on
Photodiodes – Communications, Bio-Sensings, Measurements and High-Energy Physics
208
temperature [21,22], the behaviour under intense magnetic fields [23], the minimum
detection limit, i.e. the minimum number of photons detectable above the noise level, and
the statistical fluctuations in VUV photon detection [24].
2. APD operation principle
Figure 1 shows the structure of an APD, as well as the electric field profile inside its volume.
When a high voltage is applied across the APD, only a small region of the p-layer, near the
photodiode surface, remains undepleted - the drift region (1). This region has a residual
electric field of some tens of V/cm [19]. In the depleted p-region (2), the electric field
increases with depth until a maximum is reached, around 10
5
V/cm [19], near the p-n
junction and decreases in the depleted n-region. VUV photons are absorbed in (1) and
converted into electron-hole pairs. The resulting primary electrons are driven to the p-n
junction by the electric field. Around the junction, they obtain a sufficient amount of energy
to produce new electron-hole pairs by impact ionisation, leading to an avalanche process in
the multiplication region (3). Charge gains of a few hundred are typical. Gain increases
exponentially with the applied voltage, resulting in a significant improvement of the signal-
to-noise ratio. Detailed operation principles of the APD have been presented in the literature
[25-28].
Fig. 1. Schematic of an avalanche photodiode and electric field (E) profile inside its volume.
The active region of the APD can be divided in three different parts: the drift region (1), the
depleted p-region (2) and the multiplication region (3), where the electric field is higher than
the ionisation threshold by electron impact, E
0
.
When a voltage is applied to a photodiode in order to bias the p-n junction, a low-intensity
current, typically a fraction of µA, is observed. This dark current has its origin in the
detector volume and surface. The volumetric dark current results from the continuous
generation of charge carriers - minority carriers - on both sides of the junction, which are
conducted through that junction, and from the thermal generation of electron-hole pairs in
the depletion region, which increases with volume and decreases by cooling. The surface
dark current is generated in the p-n junction edges due to high voltage gradients in its
vicinity. Since dark current is a noise source and increases considerably with temperature,
the electronic noise level can be reduced by cooling the APD, reducing the statistical
fluctuations and the minimum detection limit of VUV photons [21,22].
Detection of VUV Light with Avalanche Photodiodes
209
Different studies have proven the APD response characteristics for VUV light to be different
from those for visible light, which has been originally used to determine most of the
characteristics of photodiodes [20-23]. This is due to the difference in the average interaction
depth of the photons, which is approximately 1 μm for 520-nm photons and approximately
5 nm for 172-nm photons [29]. VUV photons interact mainly within the first atomic layers of
the wafer, where the electric field is weaker. This results in higher diffusion of the charge
carriers, which can be lost to the surface boundary and to impurities.
3. APD noise and statistical fluctuations
The energy resolution associated to radiation detection in avalanche photodiodes is
determined by several factors, namely statistical fluctuations associated to the number of
electron-hole pairs produced in silicon and the avalanche process (N); gain non-uniformity
in the APD detection volume; detector noise, resulting from dark current, and electronic
system noise. The total broadening in the energy distributions of APD pulses, E, is the
quadratic addition of those three contributions.
The output signal variance, in number of primary electrons, associated to the statistical
fluctuations is given by [30]:
22
(1)
Nn
NF
(1)
N being the number of primary electrons,
2
n
its variance and F the excess noise factor. F is
related to the variance of the electron avalanche gain,
2
A
, according to:
22
1/
A
FG
(2)
Due to the discrete nature of the multiplication process, as a result of electron avalanche
fluctuations
F is higher than 1 and varies with gain, G.
The relationship between
F and G has been derived from the McIntyre model considering
that photoelectrons are injected close to the p-zone surface [31]:
1
21
e
f
e
f
FGk k
G
(3)
k
ef
being the effective ratio between the ionisation coefficients for holes and electrons. For
lower gains,
k
ef
<< 1 and 21/FG .
For the useful gain range (G > 30), the variation of
k
ef
with voltage is very low and
considering
k
ef
constant is a good assumption. As a result, the dependence of F on G should
be approximately linear, e.g. see [32].
There is a clear difference between light and X-ray detection. In particular, the non-
uniformity contribution is negligible in light detection if the whole APD area is irradiated,
since the final pulse results from the average response to the entire number of photons
interacting in the silicon.
For light pulse detection, the variance of the number of primary electrons is described by
Poisson statistics,
2
n
N
. The statistical error, in number of primary electrons is, then:
2
N
NF
(4)
Photodiodes – Communications, Bio-Sensings, Measurements and High-Energy Physics
210
The noise contribution to the energy resolution results from two different sources, namely
the detector dark current and the electronic system. Dark current presents two different
components. One of them (IDS) does not depend on gain and corresponds to the surface
current and to a small fraction of the volumetric current resulting from thermal generation
of electron-hole pairs in the n-region, thus non-amplified. The other component (IDV) is
amplified by the gain and corresponds to the volumetric current resulting from the
production of electron-hole pairs in the p-region. The total current at the APD output is:
0DS DV
II GI GI
(5)
where
G is the APD gain and I
0
the non-amplified signal current, corresponding to electron-
hole pairs produced by the absorbed radiation.
The noise associated to the electronic system is mainly originated in the FET (field effect
transistor) at the preamplifier input. Fluctuations in the FET channel current are similar to
the thermal noise and can be represented by a noise equivalent resistance (
R
eq
) in series with
the preamplifier input [33].
A detailed noise analysis in avalanche photodiodes has been already presented in the
literature [34,35]. If the preamplifier is connected to a linear amplifier with equal
differentiation and integration constants,
τ, the electronic noise contribution to the peak
broadening in units of energy is:
2
222
2.36 ( )
24
Beq
NTDSDV
kTR
q
e
ECIIGF
qG
(6)
q being the electron charge, e 2.718 the number of Nepper, k
B
the Boltzmann constant
(1.3810
-23
J/K) and T the temperature (in Kelvin); C
T
is the total capacitance at the
preamplifier input, including detector and FET input capacitances.
The first term in (6) describes the electronic system noise associated to the detector and the
second term corresponds to the dark current contribution. Both terms depend on the
shaping time constants used in the linear amplifier. The noise contribution also depends on
the gain and the excess noise factor.
4. VUV-light measurements
A Gas Proportional Scintillation Counter (GPSC) was used to provide VUV-light pulses,
with a known number of photons, to the APD. The operation principle of the GPSC is
described in detail in [36] and a schematic of the counter is depicted in Fig.2. X-rays interact
in the absorption region producing a known number of primary electrons. The primary
electron clouds are driven to the scintillation region where the electric field is kept below or
around the gas ionisation threshold. Therefore, upon traversing the scintillation region, the
primary electrons gain enough energy from the electric field to excite a large number of
noble gas atoms, leading to a VUV-light pulse as a result of the de-excitation processes of
the atoms. Following the incidence of VUV photons on the APD, charge multiplication takes
place within the APD volume, originating the final charge pulse at its output. The
operational characteristics of the GPSC with APD are described in [4] and [5] for xenon and
argon fill gas, respectively.