Photodiodes Communications Bio Sensings Measurements and High Energy Part 12 potx
Bạn đang xem bản rút gọn của tài liệu. Xem và tải ngay bản đầy đủ của tài liệu tại đây (711.83 KB, 20 trang )
Detection of VUV Light with Avalanche Photodiodes
211
Fig. 2. Schematic of the Gas Proportional Scintillation Counter instrumented with an APD as
the VUV photosensor.
The geometry of the GPSC was chosen to allow some of the X-ray photons to reach the APD
without being absorbed in the gas, which allows direct X-ray interactions in the APD
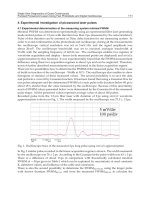
concomitant with X-ray interactions in the gas. A typical pulse-height distribution is
presented in Fig.3 for a GPSC with argon filling, irradiated with 5.9-keV X-rays. The main
features of the pulse-height distributions include the scintillation peaks resulting from the
full absorption of X-rays in the gas and from events with subsequent argon fluorescence
escape from the active volume, the so-called escape peaks, as well as the electronic noise tail.
An additional peak resulting from direct absorption of the 5.9-keV X-rays in the APD is also
present in the pulse-height distributions. This latter peak is easy to identify, since its
amplitude depends only on the APD biasing and not on the GPSC biasing, being present
even when the gas proportional scintillation counter biasing is switched off.
Knowing the w-value - i.e. the average energy to produce an electron/hole pair - of silicon
for X-rays (w
Si
= 3.6 eV), the peak resulting from the direct interaction of 5.9-keV X-rays in
the APD can be used to determine the number of charge carriers produced by the VUV-light
pulse. In the case of Fig.3, the amount of energy deposited in silicon by the argon
scintillation pulse is similar to what would be deposited by 30-keV X-rays directly absorbed
in the APD. This feature allowed the absolute determination of the argon and the xenon
scintillation yields, given the quantum efficiency of the APD and the solid angle subtended
by the APD relative to the region where the scintillation occurred [37-40].
The performance characteristics of the APD in VUV light detection has been investigated as
a function of voltage applied to the APD, using the information of the successive pulse-
height distributions obtained for each voltage. The relative positions of the VUV-light and
the direct X-ray interaction peaks provide the information on the non-linear response of the
APD to X-rays, important issue for the correct determination of the number of scintillation
Photodiodes – Communications, Bio-Sensings, Measurements and High-Energy Physics
212
photons detected by the APD. Knowing the number of photons hitting the photodiode, the
minimum number of photons above the noise that can be detected by the APD can be
determined by the relative position of the noise tail. The width of the scintillation peak can
be used to determine the statistical fluctuations resulting from the detection and signal
amplification processes in the APD, provided that the statistical fluctuations associated with
the X-ray interaction in the gas, i.e. in the number of primary electrons produced, and with
the gas scintillation processes are known.
0
50
100
150
200
250
300
350
0 100 200 300 400 500 600 700
Counts/Channel
Channel Number
direct 128-nm VUV pulse in
APD
(from 5.9-keV x-rays in Ar)
Ar K, escape
peaks
direct 5.9-keV
x-rays in APD
low-energy
limit
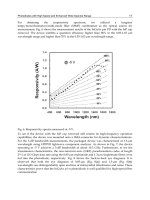
Fig. 3. Typical pulse-height distribution in APDs, resulting from both direct absorption of
5.9-keV X-rays in the APD and 128-nm scintillation absorption in the APD, resulting from
the interaction 5.9-keV X-rays in argon.
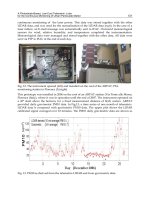
The APD gain was obtained by normalizing the scintillation pulse amplitude to the
manufacturer specification – a gain of 13.8 at 1577 V. The APD gain was also determined for
the direct interaction of 5.9-keV X-rays. Typical APD gain variation with voltage applied to
the photodiode is presented in Fig.4 for both 5.9-keV X-rays and 128-nm scintillation pulse
interactions in the APD.
Figure 4 demonstrates the non-linear effects that are present in X-ray detection. While for
light detection the VUV-photon interactions and, consequently, the charge carriers and
subsequent electron avalanche are distributed through the whole APD, the point-like nature
of the X-ray interaction results in the production of a charge carrier cloud and subsequent
electron avalanche that is concentrated in a very small volume of the APD. Therefore, non-
linear effects in X-ray detection are attributed to space-charge effects, reducing the local
electric field, and to heating in the avalanche region [20,30]. This is confirmed by the non-
linearity observed in the APD gain response between X-rays of different energies. When
using higher energy X-rays, significantly higher gain reductions were measured, e.g. [41]. In
addition, non-linear effects increase with increasing avalanche gain, i.e. with increasing
voltage applied to the APD.
Detection of VUV Light with Avalanche Photodiodes
213
0
100
200
300
1500 1600 1700 1800
Gain
LAAPD biasing (V)
128-nm VUV scintillation
5.9-keV X-rays
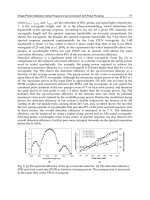
Fig. 4. APD gain for both direct 5.9-keV X-ray absorption in the APD and 128-nm
scintillation absorption in the APD as a function of the APD biasing voltage.
5. APD characteristics for xenon scintillation detection (~172 nm)
For the present measurements the number of xenon VUV photons that irradiate the APD is
about 2.4 x 10
4
photons per light pulse.
As mentioned above, significant non-linearity in APD gain response between X-rays and
visible light was observed in different types of APDs, being the APDs from API those which
present the lowest effects [28], reaching a reduction of 3% in X-ray gain response when
compared to visible light. In Fig.5 we present the X-ray-to-xenon-scintillation amplitude
ratio as a function of APD biasing. Non-linear effects are less than 3.5% and 7% for gains
below 100 and 200, respectively, when considering 5.9-keV X-rays. These non-linearities are
higher than those observed for visible-light detection [28,30] but are, nevertheless, smaller
than those observed with other types of APDs.
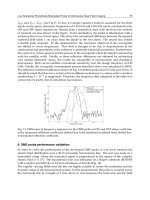
Figure 6 presents the Minimum number of Detectable Photons (MDP) for xenon
electroluminescence, defined as the number of photons that would deposit, in the APD, an
amount of energy equivalent to the onset of the electronic noise tail. The MDP is
approximately constant being, for the present conditions, about 600 photons for 172-nm
VUV-light pulses and for gain values above 40, increasing significantly as the gain drops
below that value and the signal approaches the noise level.
The obtained MDP can decrease if further efforts are made towards the reduction of the noise
level achieved in the present setup. Nevertheless, the MDP can be reduced up to a factor of
two by cooling the temperature of the photodiode to values below 0 ºC, see section 7.
The results obtained with this APD for MDP at 172 nm are lower than those obtained with
the peltier-cooled APD in [21] (~10
3
photons). The difference may be attributed to the
differences in the APD dark currents, which limit the electronic noise and, thus, the MDP. It
Photodiodes – Communications, Bio-Sensings, Measurements and High-Energy Physics
214
can also be attributed to the noise level present in both setups. Since the peltier-cooled APD
has a different enclosure, with more wiring, it is more prone to electronic noise.
0.80
0.85
0.90
0.95
1.00
1400 1450 1500 1550 1600 1650 1700 1750 1800 1850 1900
X-Rays / Xe-scintillation Gain
APD Biasing (V)
G 50
G 200G 100
5.9 keV
22.1 keV
Fig. 5. X-ray to 172-nm scintillation pulse amplitude ratio as a function of APD biasing
voltage, for 5.9- and 22.1-keV X-rays.
0.3
0.5
0.7
0.9
1.1
1.3
1.5
1.7
1.9
2.1
2.3
0 50 100 150 200 250 30
0
LAAPD gain
MDP (x 10
3
)
Xenon Electroluminescence
Fig. 6. Minimum number of detectable 172-nm VUV-photons as a function of APD gain. The
line serves only to guide the eyes.
Detection of VUV Light with Avalanche Photodiodes
215
1.5
2.0
2.5
3.0
3.5
0 50 100 150 200 250
LAAPD Gain
Relative statistical fluctuations (%)
Xenon Electroluminescence
Fig. 7. Relative statistical fluctuations associated to the VUV detection of 2.4 × 10
4
photons of
~172 nm VUV-light pulses as a function of APD gain. The line serves only to guide the eyes.
The statistical fluctuations associated to the detection of VUV-light in the APD may be
estimated from the energy resolution of the pulse-height distributions of 5.9-keV X-ray full
absorption in the gas. The energy resolution of a conventional GPSC is determined by the
statistical fluctuations occurring in the primary ionisation processes in the gas, in the
production of the VUV scintillation photons and in the photosensor. Since the statistical
fluctuations associated to the scintillation processes are negligible when compared to those
associated to the primary electron cloud formation in the gas and to those associated to the
scintillation detection in the photosensor, the energy resolution, R, of the GPSC, for an X-ray
energy E
x
, is given by [36]
22
2.355 2.355
ex
FE FwE
R
NE E E
(7)
where N
e
is the average number of primary electrons produced in the gas by the X-rays, F is
the Fano factor, w is the average energy to create a primary electron in the gas and E is the
energy deposited by the VUV-radiation in the photosensor.
The statistical fluctuations associated to the VUV-photon detection can be, thus, obtained by
2
UV
UV
F
2.355
x
N
ER w
NE E
(8)
In the present case, E
x
= 5.9-keV, w = 22.4 eV and F = 0.17 for xenon. The relative statistical
fluctuations associated to the detection of 2.4 × 10
4
VUV photons for ~172 nm VUV-light
Photodiodes – Communications, Bio-Sensings, Measurements and High-Energy Physics
216
pulses, as a function of gain, are depicted in Fig.7. The APD relative uncertainty decreases
rapidly with the onset of gain, stabilizing for gains above approximately 30 and reaching
values of 2.2%. This value can be reduced by cooling the photodiode operating temperature
to values around 0 ºC [22].
Figures 6 and 7 show that, for the detection of the light-levels of 172-nm photons presented
in this study, best performance characteristics are achieved for gains around 40. However,
gains as low as 20 are sufficient to achieve a nearly optimum performance, i.e. without
presenting significant degradation of MDP and energy resolution. For lower light levels,
higher gains may be needed to pull the signal of the light-pulse out of the noise and achieve
the best possible performance.
6. APD characteristics for Argon scintillation detection (~128 nm)
For the present measurements the number of xenon VUV photons that irradiate the APD is
about 1.4 x 10
4
photons per light pulse. As can be seen from Fig.4, the argon scintillation
pulse deposits in the APD an amount of energy similar to what would be deposited by the
interaction of ~30-keV X-rays in the photodiode.
In Fig.8 we present the X-ray-to-argon-scintillation amplitude ratio as a function of APD
biasing. The non-linearity is higher than that found for xenon scintillation, being about 4.5%
and 10% for gains about 100 and 200, respectively, when considering 5.9-keV X-rays.
0.85
0.90
0.95
1.00
1500 1550 1600 1650 1700 1750 1800 1850 1900
X-rays /Ar-scintillation Gain
APD Biasing(V)
G 50
G 200
G 100
Fig. 8. X-ray to 128 nm pulse amplitude ratio as a function of APD biasing voltage, for 5.9-
keV X-rays.
Figure 9 presents the minimum number of detectable photons (MDP) for argon
electroluminescence, as defined for the xenon case. The MDP shows a similar trend as for
xenon; it is approximately constant, being about 1300 photons for 128-nm VUV-light pulses
for gains above 60, increasing significantly as the gain drops below this value.
Detection of VUV Light with Avalanche Photodiodes
217
As for the xenon case, the obtained MDP can decrease if further efforts are made to reduce
the noise level of the present setup and can be reduced down to a factor of two by cooling
the photodiode to temperatures below 0 ºC, see section 7.
As for xenon, the statistical fluctuations associated to the detection of VUV light in the APD
may be estimated from the measured energy resolution of the pulse-height distributions of
5.9-keV full absorption in the gas. The statistical fluctuations associated to the VUV-photon
detection can, thus, be obtained from (8) where, for argon, w = 26.4 eV and F = 0.30. The
relative statistical fluctuations associated to the VUV detection of 1.4×10
4
photons of ~128
nm photons VUV-light pulses, as a function of gain, are depicted in Fig.10. The APD relative
uncertainty decreases rapidly with the onset of gain, stabilizing for gains above ~30 and
reaching values of 3.9%.
Figures 9 and 10 show that, for the detection of the light-levels of 128-nm photons presented
in this study, best performance characteristics are achieved for gains above 60. For gains
lower than 60, the MDP increases significantly, while the statistical fluctuations remain
constant down-to gains of 20.
1.0
1.2
1.4
1.6
1.8
2.0
2.2
2.4
0 50 100 150 200 250 300
LAAPD gain
MDP (x 10
3
)
Argon Electroluminescence
Fig. 9. Minimum number of detectable 128-nm VUV-photons as a function of APD gain. The
line serves only to guide the eyes.
7. Temperature dependence
The APD response depends significantly on the operation temperature [22], in particular the
gain and the dark current are two parameters that reflect significant dependence on
temperature. Therefore, temperature control and stabilization during the measurements
may be required, which is a drawback in many applications. In alternative, the knowledge
of the gain variation with temperature may lead to corrections that take into account
temperature variations during measurements.
Photodiodes – Communications, Bio-Sensings, Measurements and High-Energy Physics
218
3
4
5
6
7
8
0 50 100 150 200 250
LAAPD Gain
Relative statistical fluctuations (%)
Argon Electroluminescence
Fig. 10. Relative statistical fluctuations associated to VUV detection of 1.4 × 10
4
photons of
~128-nm VUV-light pulses as a function of APD gain. The line serves only to guide the eyes.
We have investigated the effect of temperature on gain, dark current, minimum number of
detectable photons and statistical fluctuations using an APD with an integrated peltier cell
capable of providing minimum operation temperatures of -5ºC [21]. Figure 11 depicts the
APD gain for VUV photons from xenon and for different operation temperatures. As
expected, the gain increases with reducing temperature due to the increase of the silicon
resistivity. The maximum gain increases from 300 to 700 as the temperature decreases from
25 to -5ºC, respectively.
We can organize the data of Fig.11 and depict the gain as a function of temperature, for
different biasing voltages, Fig.12. The gain decreases exponentially with increasing
temperature. For each voltage, the relative gain variation is almost constant and increases
from -2.7% to -5.6% per ºC as the voltage increases from 1633 to 1826 V. The relative gain
variation for high biasing voltages is almost a factor of 2 higher than the 3% reported by the
manufacturer for visible light detection [19].
The increase in resistivity of the silicon wafer with decreasing temperature has impact on
the APD dark current and, therefore, on the electronic noise. Figure 13 depicts the dark
current as a function of gain for different operation temperatures. The dark current is
reduced by about one order of magnitude as the temperature decreases from 25ºC to -5ºC.
This reduction has a positive impact on the minimum number of detectable photons and on
the statistical fluctuations in the APD, as shown in Figs. 14 and 15. The minimum detectable
number of photons is reduced from 1300 to 500 as the temperature decreases from 25ºC to -
5ºC.
Detection of VUV Light with Avalanche Photodiodes
219
1
10
100
1000
1000 1200 1400 1600 1800 2000
Gain
APD Biasing (V)
-5 ºC
5 ºC
15 ºC
25 ºC
Fig. 11. APD gain for VUV scintillation as a function of APD biasing for different operation
temperatures.
y = 450 e
-0.054x
y = 183 e
-0.040x
y = 105 e
-0.034x
y = 339 e
-0.047x
y = 50 e
-0.027x
10
100
1000
-10 0 10 20 30 40
Gain
Temperature (ºC)
1799 V
1780 V
1740 V
1700 V
1633 V
Fig. 12. APD gain for VUV scintillation as a function of APD temperature for different bias
voltages.
Photodiodes – Communications, Bio-Sensings, Measurements and High-Energy Physics
220
10
100
1000
0 100 200 300 400
Dark Current (nA)
Gain
25ºC
15ºC
5ºC
-5 ºC
Fig. 13. APD dark current as a function of its gain for different operation temperatures.
0.0
0.5
1.0
1.5
2.0
0 100 200 300 400 500
Minimum number of photons (×10
3
)
Gain
25 ºC
-5 ºC
Fig. 14. Minimum number of detectable 172-nm VUV-photons as a function of APD gain for
operation temperatures of 25ºC and -5ºC. The lines serve only to guide the eyes.
Detection of VUV Light with Avalanche Photodiodes
221
4.5
5.0
5.5
6.0
1.9
2.1
2.3
2.5
0 100 200 300 400
Energy Resolution (%)
Relative Standard Deviation (%)
Gain
25 ºC
-5 ºC
Fig. 15. Relative statistical fluctuations associated to the detection of 2.7 × 10
4
VUV photons
of ~172 nm light pulses as a function of APD gain for operation temperatures of 25ºC and
-5ºC. The lines serve only to guide the eyes.
8. Behaviour under intense magnetic fields
The insensitivity of the APD response to magnetic fields in X-ray and visible-light detection
is well documented [23, 25, 42]. In opposition to visible light and X-ray detection, where the
APD response is insensitive to magnetic fields, VUV detection with APDs is sensitive to
magnetic fields. Figure 16 presents the pulse-height distribution obtained for VUV xenon-
scintillation pulses for magnetic fields of 0 and 5 T, at room temperature. As can be seen,
there is a significant reduction in the APD gain at high magnetic fields.
Figure 17 shows the APD relative pulse amplitude and energy resolution as a function of
magnetic field for the xenon scintillation peak. As shown, for VUV-light the relative
amplitude decreases gradually as the magnetic field is applied, reaching a 24% reduction at
5 T. The energy resolution increases from 13% to 15%. Since VUV photons interact within
the first few atomic layers of silicon, where the electric field is weak, the magnetic field
influences drift and diffusion of the produced photoelectrons, leading to partial charge loss
to the dead layer at the APD entrance.
Photodiodes – Communications, Bio-Sensings, Measurements and High-Energy Physics
222
0
2
4
6
0 250 500 750 1000
Counts / channel (×10
3
)
Channel number
5 Tesla
0 Tesla
Xe VUV-light
Fig. 16. APD pulse-height distributions for xenon scintillation light resulting from 5.9-keV X-
rays absorbed in a xenon GPSC operating under magnetic field intensities of 0 T and 5 T.
12
14
16
18
0.5
0.6
0.7
0.8
0.9
1.0
1.1
012345
Energy Resolution (%)
Relative amplitude
Magnetic field (T)
Amplitude
Resolution
Poly. (Amplitude)
Poly. (Resolution)
Fig. 17. Relative pulse amplitude and energy resolution as a function of magnetic field
intensity for xenon VUV scintillation detection.
Detection of VUV Light with Avalanche Photodiodes
223
9. Conclusions
The APD is a suitable device for the detection of VUV light pulses of photons down to about
120 nm. PMTs present a sensitivity range down to 115 nm- with MgF
2
windows -, gains
above 10
7
, dark currents below a few nA instead of a few hundred nA for APDs, and are
suitable for single photon detection. However, the photodiode compactness, reduced power
consumption, simple operation and straightforward photon calibration are significant
advantages over PMTs.
Figures 6 and 9 present the results for the Minimum number of Detectable Photons (MDP),
defined as the number of VUV photons that would produce a signal in the APD with an
amplitude equivalent to the onset of the electronic noise tail. The minimum number of photons
that can be detected with the APD, for this experimental setup, are about 1300 and 600 for 128-
and 172 nm, respectively, almost three orders of magnitude higher than is the case for PMTs.
Therefore, the APD is not suitable for single photon detection and VUV-photon spectrometry.
Nevertheless, it can be applied to synchrotron radiation in VUV-photon detection and to other
areas of optics, where the light levels are adequate for its use.
The MDP for 172-nm photons is about half of that for 128 nm photons, achieving the lowest
values for lower gains. This difference reflects the higher spectral sensitivity of these APDs
for 172 nm, which is approximately 150 mA/W, corresponding to an average number of 1.1
free electrons produced in the APD per incident VUV-photon, when compared to 50 mA/W
that corresponds to an average number of 0.55 free electrons produced in the photodiode
per incident VUV-photon for 128 nm [19]. In fact, it is the number of primary charge carriers
that defines the corresponding signal amplitude and the signal-to-noise ratio.
Figures 7 and 10 depict also the results of the relative statistical fluctuations associated to the
VUV detection of 2.4×10
4
photons of 172-nm VUV-light pulses and 1.4x10
4
photons of 128-
nm, respectively. These values are 3.9% and 2.2%, respectively. This difference is consistent
with the dependence of the APD resolution on the inverse of the square root of the number
of the charge carries produced in the photodiode [30] and it reflects not only the difference
in the number of photons involved in each case, but also the difference in the respective
quantum efficiency. The numbers of charge carriers produced in the APD are
2.4 × 10
4
× 1.1 = 2.64 × 10
4
free electrons for xenon
and
1.4 × 10
4
× 0.55 = 7.7 × 10
3
free electrons for argon,
being
2.2 ×
26400
7700
3.9 .
This is also consistent with the results for visible (red) light from a LED obtained in [22],
with an energy resolution of 7% for 2600 free electrons produced in the APD.
For the present charge carrier quantities, APD gains as low as 30 to 60 are enough to obtain
best performances. However, gains as low as 20 and 30, respectively, are sufficient to
achieve a nearly optimum performance, i.e. without presenting significant degradation of
MDP and energy resolution. For lower light levels, higher gains will be needed to pull the
signal of the light-pulse out of the noise and achieve the best possible performance.
The experimental results presented in this chapter show that both MDP and statistical
fluctuations associated to light detection do not depend on photon wavelength, but rather
Photodiodes – Communications, Bio-Sensings, Measurements and High-Energy Physics
224
on the number of charge carriers produced by the light-pulse in the APD. This is at odds
with other effects like light-to-X-rays non-linearity and amplitude behaviour under intense
magnetic fields, where the photon interaction in the first atomic layers of the wafer has a
significant influence on these results.
In addition to space charge effects resulting from the point-like nature of X-ray interactions,
our results suggest a dependence of the non-linearity on the light wavelength. The X-ray to
light gain non-linearity for 128 nm VUV photons is higher than the one obtained for 172 nm
VUV photons and both are higher than that reported for visible light [30]. The non-linearity
must depend on the penetration depth in silicon of each type of light. For both VUV and
visible light, photons are absorbed in the drift region of the APD, where the electric field is
weak and the effect of capture of charges is more significant. Since the absorption is much
more superficial for VUV light (~5 nm), capture is greater in this case but decreases with
gain due to the electric field increase. Thus, the higher APD voltage results in a more
efficient collection of the primary electrons produced near the entrance surface for argon,
whereas this effect is smaller for xenon and most probably negligible for visible light since
the penetration depth increases. The shallow penetration of the VUV photons may also
explain the different behaviour of the APD response under intense magnetic fields for VUV
and visible light detection.
10. Acknowledgements
"Project carried out under QREN, funding from UE/FEDER and FCT-Portugal, through
program “COMPETE - Programa Operacional Factores de Competitividade”, projects
PTDC/FIS/102110/2008 and “Projecto Estrategico – Unidade 217/94”.
11. References
[1] Windowless Series large area APD, Advanced Photonics Inc., 1240 Avenida Acaso
Camarillo, CA 93012, USA.
[2]
VUV-sensitive large area APD, Radiation Monitoring Devices, Inc., 44 Hunt Street,
Watertown, MA 02472, USA.
[3]
S-8664-55-SPL large area APD, Hamamatsu Photonics K.K., 325-6, Sunayama-cho, Naka-
ku, Hamamatsu City, Shizuoka Pref., 430-8587, Japan.
[4]
J.A.M. Lopes, J.M.F. dos Santos, R.E. Morgado, C.A.N. Conde, “A xenon gas
proportional scintillation counter with a UV-sensitive large-area avalanche
photodiode”, IEEE Trans. Nucl. Sci. 48 (2001) 312-319.
[5]
C.M.B. Monteiro, J.A.M. Lopes, P.C.P.S. Simões, J.M.F. dos Santos, C.A.N. Conde, “An
argon gas proportional scintillation counter with UV avalanche photodiode
scintillation readout”, IEEE Trans. Nucl. Sci. 48 (2001) 1081-1086.
[6]
R. Neilson, _, F.LePort, A.Pocar, K.S.Kumar, A.Odian et al., “Characterization of large
area APDs for the EXO-200 detector”, Nucl. Instrum. Meth. A 608 (2009) 68–75.
[7]
V.N. Solovov, V. Chepel, M.I. Lopes, R. Ferreira Marques and A.J.P.L. Policarpo, “Study
of large area avalanche photodiodes for detecting liquid xenon scintillation”, IEEE
Trans. Nucl. Sci. 47 (2000) 1307-1310.
[8]
V.N. Solovov, A. Hitachi, V. Chepel, M.I. Lopes, R. Ferreira Marques, A.J.P.L. Policarpo,
“Detection of scintillation light of liquid xenon with a LAAPD”, Nucl. Instr. Meth.
A 488 (2002) 572-578.
Detection of VUV Light with Avalanche Photodiodes
225
[9] K. Ni, E. Aprile, D. Day, K.L. Giboni, J.A.M. Lopes, P. Majewski and M. Yamashita
“Performance of a large area avalanche photodiode in a liquid xenon ionization
and scintillation chamber”, Nucl. Instrum. Meth. A 551 (2005) 356.
[10]
P. Shagin, R. Gomez, U. Oberlack, P. Cushman, B. Sherwood, M. McClish and R.
Farrell, “Avalanche Photodiode for liquid xenon scintillation: Quantum Efficiency
and gain”, J. Inst. 4 (2009)P01005.
[11]
J. C. Campbell, S. Demiguel, F. Ma, A. Beck, X. Guo, S. Wang, X. Zheng, X. Li, J. D.
Beck, M. A. Kinch, A. Huntington, L. A. Coldren, J. Decobert, and N. Tscherptner,
“Recent Advances in Avalanche Photodiodes,” IEEE J. of Sel. Topics in Quantum
Electronics 10 (2004) 777.
[12]
Q. Wang, S. Savage, B. Noharet, I. Petermann, S. Persson, S. Almqvist, M. Bakowski,
J.Y. Andersson, “Analysis and comparison of UV photodetectors based on wide
bandgap semiconductors”, Proceedings of SPIE-The International Society for
Optical Engineering, Vol. 7602 (2010).
[13]
R. McClintock, E. Cicek, Z. Vashaei, C. Bayram, M. Razeghi, M.P. Ulmer, “III-Nitride
Based Avalanche Photo Detectors”, Proceedings of SPIE-The International Society
for Optical Engineering, Vol. 7780 (2010).
[14]
E. Cicek, Z. Vashaei, C. Bayram, R. McClintock, M. Razeghi, M.P. Ulmer, “Comparison
of ultraviolet APDs grown on free-standing GaN and sapphire substrates”,
Proceedings of SPIE-The International Society for Optical Engineering, Vol. 7780
(2010).
[15]
S.M. Savage, A. Schoner, I. Petermann, M. Bakowski, “Sensitive and stable SiC APD for
UV detection”, Proceedings of SPIE-The International Society for Optical
Engineering, Vol. 7726 (2010).
[16]
G.A. Shaw, A.M. Siegel, J. Model, A. Geboff, S. Soloviev, A. Vert, P. Sandvik, “Deep
UV Photon-Counting Detectors and Applications”, Proceedings of SPIE-The
International Society for Optical Engineering, Vol. 7320 (2009).
[17]
S. Soloviev, A. Vert, A. Bolotnikov, P. Sandvik, “UV SiC avalanche photodetectors for
photon counting”, IEEE SENSORS, VOLS 1-3 (2009) 1819.
[18]
T. Takahashi, S. Himi, M. Suzuki, J. Ruan, S. Kubota, “Emission spectra from Ar-Xe,
Ar-Kr, Ar-N2, Ar-CH4, Ar-CO2 and Xe-N2 gas scintillation proportional counters”,
Nucl. Instr. Meth. A 205 (1983) 591-596.
[19]
Advanced Photonix Inc. Application Notes: “Windowless large area APDs” (1999).
[20]
L.M.P. Fernandes, J.A.M. Lopes, C.M.B. Monteiro, J.M.F. dos Santos, R.E. Morgado,
“Non-linear behaviour of large-area avalanche photodiodes”, Nucl. Instr. Meth. A
478 (2002) 395-399.
[21]
J.A.M. Lopes, L.M.P. Fernandes, J.M.F. dos Santos, R.E. Morgado, C.A.N. Conde,
“VUV detection in large-area avalanche photodiodes as a function of temperature”,
Nucl. Instr. Meth. A 504 (2003) 331-334.
[22]
L.M.P. Fernandes, J.A.M. Lopes, J.M.F. dos Santos, P.E. Knowles, F. Mulhauser, L.
Ludhova, F: Kottmann, R. Pohl, D. Taqqu, “LAAPD low temperature performance
in x-ray and visible-light detection”, IEEE Trans. Nucl. Sci. 51 (2004) 1575-1580.
[23]
L.M.P. Fernandes, A. Antognini, M. Boucher, C.A.N. Conde, O. Huot, P.E. Knowles, F.
Kottmann, L. Ludhova, F. Mulhauser, R. Pohl, L.A. Schaller, J.M.F. dos Santos, D.
Taqqu, J.F.C.A. Veloso, “Behaviour of large-area avalanche photodiodes under
intense magnetic fields for VUV, visible and X-ray photon detection”, Nucl. Instr.
Meth. A 498 (2003) 362-368.
Photodiodes – Communications, Bio-Sensings, Measurements and High-Energy Physics
226
[24] C.M.B. Monteiro, L.M.P. Fernandes, J.A.M. Lopes, J.F.C.A. Veloso, J.M.F. dos Santos,
“Detection of VUV photons with large-area avalanche photodiodes”, Appl. Phys. B
81 (2005) 531-535.
[25]
A.Q.R. Baron and S.L. Ruby, “Time resolved detection of X-rays using large area
avalanche photodiodes”, Nucl. Instr. Meth. A 343 (1994) 517.
[26]
E.M. Gullikson, E. Gramsch, M. Szawlowski, “Large-area avalanche photodiodes for
the detection of soft X-rays”, Appl. Optics 34 (1995) 4662.
[27]
Pansart J P, Avalanche photodiodes for particle detection, Nucl. Instr. Meth. A 387
(1997) 186.
[28]
M. Moszynski, M. Kapusta, M. Balcerzyk, M. Szawlowski, D. Wolski, I. Wegrzecka, M.
Wegrzecki, “Comparative study of avalanche photodiodes with different structures
in scintillation detection”, IEEE Trans. Nucl. Sci. 48 (2001) 1205-1210.
[29]
T.W. Barnard, M.I. Crockett, J.C. Ivaldi, P.L. Lundberg, D.A. Yates, P.A. Levine, D.J.
Sauer, “Solid-state detector for ICP-OES”, Anal. Chem. 65 (1993) 1231-1239.
[30]
M. Moszynski, M. Szawlowski, M. Kapusta, M. Balcerzyk, “Large area avalanche
photodiodes in scintillation and X-rays detection”, Nucl. Instr. Meth. A 485 (2002) 504.
[31]
R.J. McIntyre, “The distribution of gains in uniformly multiplying avalanche
photodiodes: theory”, IEEE Trans. Electron Devices 19 (1972) 703.
[32]
L.M.P. Fernandes, J.A.M Lopes, J.M.F dos Santos, “Excess noise factor in large area
avalanche photodiodes for different temperatures”, Nucl. Instr. Meth. A 531 (2004) 566.
[33]
P.W. Nicholson, Nuclear Electronics, Wiley-Interscience Publication (1974), John Wiley
& Sons, London.
[34]
R.J. McIntyre, “Multiplication noise in uniform avalanche diodes”, IEEE Trans.
Electron Devices 13 (1966) 164.
[35]
P.P. Webb, R.J. McIntyre, “Large area reach-through avalanche diodes for X-ray
spectroscopy”, IEEE Trans. Nucl. Sci. 23 (1976) 138.
[36]
J.M.F. dos Santos, J.A.M. Lopes, J.F.C.A. Veloso, P.C.P.S. Simões, T.H.V.T. Dias, F.P.
Santos, P.J.B.M. Rachinhas, L.F.R. Ferreira, C.A.N. Conde, “Development of
portable gas proportional scintillation counters for X-ray spectrometry”, X-Ray
Spectrom. 30 (2001) 373.
[37]
C.M.B. Monteiro, L.M.P. Fernandes, J.A.M. Lopes, L.C.C. Coelho, J.F.C.A. Veloso,
J.M.F. dos Santos, K. Giboni, E. Aprile, "Secondary scintillation yield in pure
xenon", J. Inst. 2 (2007) P05001.
[38]
C.M.B. Monteiro, J.F.C.A. Veloso, J.A.M. Lopes, J.M.F. dos Santos, “Secondary
scintillation yield in pure argon”, Phys. Lett. B 668 (2008) 167.
[39]
C. M. B. Monteiro, A. S. Conceição, F. D. Amaro, J. M. Maia, A. C. S. S. M. Bento et al.,
“Secondary scintillation yield from gaseous micropattern electron multipliers in
direct Dark Matter detection”, Physics Letters B 677 (2009) 133.
[40]
E.D.C. Freitas, C.M.B. Monteiro, M. Ball, J. J. Gómez-Cadenas, J.A.M. Lopes,, T. Lux, F.
Sánchez, J.M.F. dos Santos, "Secondary Scintillation Yield in High-Pressure Xenon
Gas for neutrinoless double beta decay search", Physics Letters B 684 (2010) 205.
[41]
L.M.P. Fernandes, F.D. Amaro, A. Antognini, J.M.R. Cardoso, C.A.N. Conde, O. Huot,
P.E. Knowles, F. Kottmann, J.A.M. Lopes, L. Ludhova, C.M.B. Monteiro, F.
Mulhauser, R. Pohl, J.M.F. dos Santos, L.A. Schaller, D. Taqqu, J.F.C.A. Veloso,
"Characterization of large area avalanche photodiodes in X-ray and VUV-light
detection", J. Inst. 2 (2007) P08005.
[42]
A. Karar, Y. Musienko, J. Ch. Vanel, “Characterization of avalanche photodiodes for
calorimetry applications”, Nucl. Instr. Meth. A 428 (1999) 413-431.
Part 5
Photodiodes for High-Energy
Photon/Particle Detection
12
Quantitative Measurements of
X-Ray Intensity
Michael J. Haugh
1
and Marilyn Schneider
2
1
National Security Technologies, LLC,
2
Lawrence Livermore National Laboratory
USA
1. Introduction
This chapter describes the characterization of several X-ray sources and their use in calibrating
different types of X-ray cameras at National Security Technologies, LLC (NSTec). The cameras
are employed in experimental plasma studies at Lawrence Livermore National Laboratory
(LLNL), including the National Ignition Facility (NIF). The sources provide X-rays in the
energy range from several hundred eV to 110 keV. The key to this effort is measuring the X-ray
beam intensity accurately and traceable to international standards. This is accomplished using
photodiodes of several types that are calibrated using radioactive sources and a synchrotron
source using methods and materials that are traceable to the U.S. National Institute of
Standards and Technology (NIST). The accreditation procedures are described.
The chapter begins with an introduction to the fundamental concepts of X-ray physics. The
types of X-ray sources that are used for device calibration are described. The next section
describes the photodiode types that are used for measuring X-ray intensity: power
measuring photodiodes, energy dispersive photodiodes, and cameras comprising
photodiodes as pixel elements. Following their description, the methods used to calibrate
the primary detectors, the power measuring photodiodes and the energy dispersive
photodiodes, as well as the method used to get traceability to international standards are
described. The X-ray source beams can then be measured using the primary detectors. The
final section then describes the use of the calibrated X-ray beams to calibrate X-ray cameras.
Many of the references are web sites that provide databases, explanations of the data and
how it was generated, and data calculations for specific cases. Several general reference
books related to the major topics are included. Papers expanding some subjects are cited.
2. Brief introduction to X-rays: Characteristic spectral lines and
bremsstrahlung
2.1 Characteristic X-ray spectral lines from atoms
The electronic structure of an atom, using Ag as an example and shown in Fig. 1, is:
47
Ag: 1s
2
2s
2
2p
6
3s
2
3p
6
3d
10
4s
2
4p
6
4d
10
5s
1
Shown in Fig. 1 is the energy level diagram for the lowest four quantum numbers of the Ag
ion, i.e., one of the 1s electrons, has been removed. How the electron is removed is covered
in the next section.
Photodiodes – Communications, Bio-Sensings, Measurements and High-Energy Physics
230
Fig. 1. The energy level diagram for the lowest levels of the singly ionized Ag atom.
Column 1 is the principle quantum number, column 2 indicates an energy level, column 3 is
the IUPAC designation for the state, and column 4 is the state electronic structure.
We use the Russell-Saunders angular momentum coupling scheme (Herzberg, 1945) to
describe the electronic structure of each state. The notation is illustrated in Fig. 1. The
superscript “s” denotes 2s + 1 where “s” is the total spin of the state. In this case, it is a
doublet state since there is an unpaired electron (one electron has been removed). The upper
case letter indicates the orbital angular momentum (S means zero angular momentum; P
means one unit angular momentum; D means two units, etc.) The subscript indicates the
combination of orbital angular momentum and spin angular momentum. This description is
somewhat simplified but it gives insight into transition probabilities and what X-ray
transitions are expected along with their relative intensities.
When an electron has been removed from the lowest energy level, the 1
2
S
1/2
state, an
electron can drop from a higher level with the simultaneous emission of a photon. The
relative energies of these states can be obtained from the binding energies of the electrons in
each state, and these are given in Table 1. A good source for this information is the Center
for X-Ray Optics web site of the Lawrence Berkeley National Laboratory (CXRO reference).
The readily observed X-ray spectral lines to the electron deficient K level are shown in Fig. 1
column 4 and the energies and relative probabilities are given in Table 2.
Both the Siegbahn and the newer International Union of Pure and Applied Chemistry
(IUPAC) notations for the transitions are given. The IUPAC notation is a bit less obscure but
the Siegbahn notation is still more popular in current literature. In the IUPAC notation, the
number refers to the order of the energies in the shell as shown in Fig. 1, so that L1 refers to
the n=2 s
1/2
, L2 refers to the p
1/2
, and so on. Note that the spectral emission energy can be
estimated by taking the difference between the corresponding binding energy given in Table
1. This estimate is reasonably accurate for K transitions, but care should be taken when
using this estimate for higher energy level transitions. If the electron is removed from the
n=2 shell, the spectral emission is referred to as an L line. The set of easily observed
emission lines is given in Table 3.
2