Recent Advances in Vibrations Analysis Part 3 docx
Bạn đang xem bản rút gọn của tài liệu. Xem và tải ngay bản đầy đủ của tài liệu tại đây (632.79 KB, 20 trang )
Phase Diagram Analysis for Predicting Nonlinearities and Transient Responses
29
- Gaussian or non-Gaussian
For the nonlinear system identification techniques, there are two broad categories:
parametric and non-parametric methods.
Parametric methods assume that the system is represented by a mathematical model.
Identification consists on the estimation of the model parameters from the experimental
data. ( + +
=
(
)
ω and ζ are estimated). These methods also allow for the design
verification.
Nonparametric methods refer to techniques which lack of a mathematical model. They take
a “system” approach and fit the input-output relationship. (Examples: Auto-Regressive-
Moving-Average, Volterra Wiener-Kerner, etc.) Their limitations are the type of input
signals, they required many parameters to find a solution. The model could introduce errors
that are not related to the system, and noise measurements could be introduced into the
model parameters. This is the main source of uncertainty.
Masri (1994) developed a hybrid approach for the identification of nonlinear systems. He
applied a parametric approach for the identification of the linear terms and the well know
nonlinear terms, and a parametric approach for describing the unknown nonlinear terms.
The approximation is defined from the equation of motion as:
(
)
+
(
)
+
(
)
+
(
)
=
(
)
, (1)
where
() includes the nonlinear non-conservative forces
() =
(
)
−
(
)
−
(
)
−(). (2)
The right hand side can be determined from a parametric modeling and () is a well
known input function.
(
)
can be modeled as a combination of parametric and non-parametric term, this is what
Masri (1994) described as a hybrid model. He approximated the
(
)
as vector h were each
element ℎ
() is a function of the acceleration, velocity and position vectors associated with
each degree of freedom. Masri (1994) showed that the nonlinear terms can be visualized in
the phase diagram and they can be isolated by subtracting the linear components from the
measured data.
The development of the nonlinear dynamic theory brought new methods for recognition
and prediction of nonlinear dynamic response (Yang 2007).
The nonlinear dynamic and chaos theory can be used to describe the irregular, broadband
signals, which are generic in non-linear dynamical systems, and extracting some physically
interesting and useful features from such signals. Fractal dimension, such as the capacity
dimension, correlation dimension, and information dimension, developed by the Nonlinear
dynamic and chaos theory, is a promising new tool to interpret observations of physical
systems where the time trace of the measured quantities is irregular. The phase diagram and
Poincare maps of chaotic systems have a fractal structure. We can recognize, classify and
understand such maps of chaos by measuring the stability of the phase diagram.
Vela et al. (2010) applied a detrended fluctuation analysis (DFA), adapted for time–
frequency domain, to monitor the evolution nonlinear dynamics. The underlying idea
behind the application was to use the Hurst exponent, an index of the signal fractal
roughness, to detect dominance of unstable oscillatory components in the complex,
presumably stochastic, dynamics of machine acceleration. In early stages of machinery
faults the signal-noise ratio is very low due to relatively weak energy signals. Other authors
Recent Advances in Vibrations Analysis
30
have studied the effect of a weak periodic signal in the chaotic response of a nonlinear
oscillator (Li & Qu, 2007; Modarres et al. 2011). Liu (2005) developed a visualization method
for nonlinear chaotic systems.
One of the advantages of the display identification is the representation of the phase
diagram as a three-dimensional plot. In this way the phase diagram can be related to the
frequency and the dynamic identification of the system. According to Taken’s theorem, a
dynamic system can be obtained by reconstructing the phase diagram (Wang, G. et al. 2009;
Wang, Z., et al. 2011; Ghafari et al. 2010).
Karpenko et al., (2006) applied the phase diagram in the identification of nonlinear
behavior of rotors. They also demonstrated that rubbing is nonlinear and can be identified
as a chaotic system. Mevela &. Guyade (2008) developed a model for predicting bearing
failures.
In this chapter, the application of the phase space, or phase diagram, to the identification of
nonlinearities and transient function is presented. The theoretical background is discussed
in next section, and afterwards its application to the most relevant mechanical systems is
presented.
2. Phase diagram definition
The analysis and modeling of dynamic systems can be done from a Lagrangian approach
or from a Hamiltonian approach. The Lagrangian approach describes how position and
velocity change in time. The Hamiltonian approach describes how position and
momentum change in time. The position and momentum of a particle specifies a point in
a space called the “phase space”, “phase plane”, “phase diagram”, among others (Nichols,
2003).
A particle traces out a path in a space R
n
:ℛ → ℛ
(3)
where R represents time domain, R
n
represents the space domain and q represents the
position of a particle at an instant t.
From Newton’s law
(
)
=
(
)
=
(
()
)
, (4)
with the restriction that F(t) is a smooth function.
The potential energy of a multi-particle system will have the form
(
)
=
∑
(
)
−
()
(5)
where
=−
(
)
(6)
and f
ij
is the force acting between particle i and j.
Hamilton’s principle is defined as:
(
,
)
=
+
(
)
(7)
Phase Diagram Analysis for Predicting Nonlinearities and Transient Responses
31
and
(,)
=
(8)
(,)
=
()
. (9)
Thus
(
)
=
(
(
)
,()
)
(10)
(
)
=−
(
(
)
,()
)
,
where the dyad (q(t),p(t)) represents the phase space of a particle, and (,) ∈ ℛ
ℛ
.
If the phase space can be represented as a smooth function :ℛ
ℛ
→ℛ, then it represents
the system’s evolution in time. Thus, for a system with n particles
=
∑
+
. (11)
Using Hamilton’s equation
=
∑
−
(12)
For example, a simple harmonic is represented as
(
)
+
(
)
=0 (13)
with its well known solution
(
)
=
(
)
+
(
)
(14)
(
)
=(
(
)
−
(
)
) (15)
where
=
(
0
)
(16)
=
(0)
.
The Hamiltonian can be written as:
(
,
)
=
+
. (17)
The field vector operator is defined as:
=
−
(18)
and the flow field is found as:
=
(
)
,()
. (19)
Recent Advances in Vibrations Analysis
32
In this case
=
(
0
)
sin
(
)
+
()
cos
(
)
,
(
0
)
cos
(
)
−(0)sin
(
)
(20)
This flow field represents an ellipse at any time t.
The dynamic stability is determined from Liouville’s theorem, (the phase space volume
occupied by a collection of systems evolving according to Hamilton’s equations of motion
will be preserved in time):
=
+
∑
+
=0
(21)
It can be shown that
∑
−
=0
(22)
This conservation law states that a phase diagram volume will be preserved in time; this is
the statement of Liouville’s theorem.
3. Application to nonlinear mechanical systems
3.1 Gears
As a complete system a gear box contains gears or teeth wheels, shafts, bearings, rolling
bearings, lubrication pumps, tubes, valves and other devices such as heat exchangers.
Therefore, all these individual elements have gone through a development process by
themselves, but as an integrated system they have challenged engineers with highly
interesting problems. The one of particular interest is gear vibrations, which is always
undesirable, and also generates noise. The dominant cause of gear noise is the Transmission
Error; it is the deviation from a perfect motion between the driver and the driven gears.
And it is the combination of different gear variations, such as non perfect tooth profiles,
pitch errors, elastic deformations, backlash, etc. The simplest type of noise is a steady note
which may have a harmonic content at the gear mesh frequency. This frequency is normally
modulated by the rotating frequency. Modulated noise is often described as a buzzing
sound. In general, gears show a frequency modulated spectrum with a distinguishable mesh
frequency and side bands spaced at the shaft rotating frequency. Other noises are associated
with pitch errors. They are described as scrunching, grating, grouching, etc. They contain a
wide range of frequencies that are a lot higher than the rotating frequency. White noise can
also be present and it may be associated with loss of contact between the teeth. (Jauregui &
Gonzalez, 2009).
Gear box vibration is a typical nonlinear vibration phenomenon. Its nonlinear behavior
comes from the discontinuities in the stiffness of the system, which comes from the
combination of two teeth acting in conjunction. Thus, the stiffness of a gear pair varies with
the angular position, except in very specific gear designs. One of the main features of gear
pair stiffness is that it changes drastically as a function of the number of teeth in
simultaneous contact. Ideally, a pair of gears transmits motion at a constant speed.
In most gear pair systems, torsional motion is coupled by the gear pair stiffness; therefore a
two degree of freedom model will reflect accurately most practical applications. If it is
necessary to include other effects, increasing the degrees of freedom could accommodate
other compliances that are present in the system.
Phase Diagram Analysis for Predicting Nonlinearities and Transient Responses
33
Many researchers and engineers have developed a significant number of gear dynamic
models. Most of them have been developed for the prediction of noise and vibrations, and
they have demonstrated that gear vibrations are highly nonlinear. In this chapter we present
one of the most commonly used model that is widely accepted. It was demonstrated that a
simplified lumped-mass model is adequate for small transmissions. (Chang 2010).
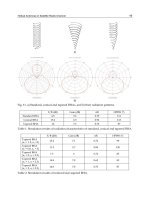
Fig. 1. Phase diagram of a pair of gears under free vibration.
Fig. 2. Phase diagram of a pair of gears with an external excitation of 0.4 of the linear natural
frequency
-0.8 -0.6 -0.4 -0.2 0 0.2 0.4 0.6 0.8
-1
-0.8
-0.6
-0.4
-0.2
0
0.2
0.4
0.6
0.8
1
displacement
velocity
-0.15 -0.1 -0.05 0 0.05 0.1
-0.08
-0.06
-0.04
-0.02
0
0.02
0.04
0.06
0.08
displacement
velocity
Recent Advances in Vibrations Analysis
34
In this case, it is important to identify the effect of the nonlinear gear action in a phase
diagram. From a simple lumped mass model, it is sufficient to identify the nonlinear
response of a transmission. Fig 1 represents the phase diagram of the free vibration
response. In this case, a small damping coefficient was included in the model. It is noticeable
how the nonlinear stiffness deforms the phase space pattern, and instead of producing an
ellipse, it forms a lemon shape. For practical purposes, this pattern is stable at any time.
Fig. 2, represents the forced vibration response with an external excitation at 0.4
. It is
clear to see how the stable pattern disappears, and two attracting poles are formed around
the origin of the phase space. This behavior is similar to a nonlinear Duffing oscillator. Fig. 3
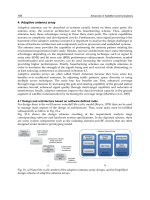
shows the same system but with an external excitation beyond its first linear natural
frequency. In this case, the instability is larger and number of attracting poles increases and
the velocity amplitude almost doubles the other two cases.
Gears have a characteristic phase diagram; it changes from a stable non-elliptical pattern to a
chaotic phase space. This drastic change is quite significant and, with an appropriate
monitoring system, it can detect early faults in the gear teeth, or damaging effects caused by
changes in the operating conditions.
3.2 Discontinuous stiffness
Stiffness discontinuities are present in many mechanical systems. It is one reason why gears
have a nonlinear dynamic behavior. Another type of stiffness discontinuity is found in
cracked structures. Andreaus & Baragatti (2011) demonstrated that a cracked beam behaves
as a discontinuous stiffness system. This discontinuity is a function of the beam’s
displacement, thus the stiffness is lower when the beam’s movement opens the crack and
the stiffness increases when the movement closes the crack. Also large deformations can
produce a similar pattern as a system with stiffness discontinuities, (Machado et al. 2009),
(Mazzillia et al.,2008).
Fig. 3. Phase diagram of a pair of gears with an external excitation of 1.6 of the linear natural
frequency
-0.1 -0.08 -0.06 -0.04 -0.02 0 0.02 0.04 0.06 0.08 0.1
-0.2
-0.15
-0.1
-0.05
0
0.05
0.1
0.15
displacement
velocity
Phase Diagram Analysis for Predicting Nonlinearities and Transient Responses
35
A typical pattern of a beam under large deformations can be seen in Fig. 5 (Jauregui &
Gonzalez, 2009b). The elliptic shape evolves into a rectangular shape with two attracting
poles.
This behavior is found in very large and thin structures such as wind turbine blades or
helicopter blades. The stability of these structures depends entirely on internal damping
capabilities.
3.3 Bearings
Most of the dynamic models of rolling bearings consider that their stiffness is a function of
the frequency and the displacement. This characteristic makes its dynamic behavior
different from other mechanical elements. And, as was stated in the introduction, it is quite
complicated to establish a single nonlinear mode of vibration. Thus, in a bearing system,
strange motions appear due to the nature of the stiffness function. To describe these strange
motions, tools specific to chaotic dynamics have to be introduced. Fourier spectra are
convenient for detecting sub- or super-harmonics of a component, also in the case of
complete chaotic behavior, but the quasi-periodic motion is impossible to detect except for
the ideal case of two components. Some recent studies have used phase diagrams and
Poincare´ sections. An extremely efficient technique is then to sample the phase diagram
points using a convenient clock frequency, in order to obtain a limited number of points.
The resulting shape is an excellent tool to characterize sub-harmonic, quasi-periodic or
chaotic motions.
Fig. 5. Phase diagram of a beam under large deformations
A typical ball-bearing system consists of five contact parts: the shaft, the inner ring, the
rolling elements, outer ring and the housing. The deformation of each part will influence the
Recent Advances in Vibrations Analysis
36
load distribution and, in turn, the service life of the bearing. It is well known that classical
calculation methods cannot predict accurately load distributions inside the bearing. Ball
bearings (Fig 6) are very stiff compared with sliding bearings; their stiffness can be
approximating as a set of individual springs; where the number of springs supporting the
shaft varies with the angular position of the shaft. This variation depends upon the
kinematics of the ball roller as it moves around the shaft. Thus, the ratio of rotation of the
ball as a function of shaft’s rotation is determined as
(24)
The fundamental principle of a rolling bearing is that the ball or roller translates around the
shaft, eliminating must of the friction; then the ball’s angular translation is found as (D is the
pitch diameter and d is the roller diameter)
(25)
The number of balls, or rolls in contact are determined from Fig. 7. The nonlinear
characteristic of the rolling bearing is the ball-track deformation. The ball-track stiffness is
calculated with the Hertz equation. Since the balls translate around the shaft, the number of
balls supporting the load varies with the angular position of the shaft; this translation effect
modifies the overall stiffness of the bearing. Although this variation may be small, it creates
a nonlinear vibration, which turns out to be relatively difficult to identify in field problems.
Fig. 6. Schematic representation of a roller bearing
d
D
s
b
)cos(
2
)cos(
d
D
td
b
Phase Diagram Analysis for Predicting Nonlinearities and Transient Responses
37
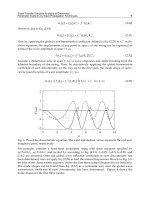
Fig. 7. Radial displacement of a shaft mounted on ball bearings
Rolling bearings generate transient vibrations due to stiffness nonlinearities and structural
defects. There are four external sources of vibration; two of them are associated with the
angular velocity of the ball
b
and their angular translation
. The other two frequencies are
related to structural defects on the inner and outer tracks. These external frequencies excite the
nonlinear terms. The stiffness of the ball as a function of the deformation is almost constant:
i
i
H
Dd
PE
Dd
3
()
(26)
The nonlinear effect comes from the combination of balls deformation as they roll around
the shaft. The rolling bearing can be modeled as a mass-spring system.
(27)
The spring stiffness is determined from Fig. 8. Similarly as the gear mesh stiffness, rolling
bearings exhibits a periodic function, thus it can be expanded as a Taylor series:
x
kaa a a
23
01 2 3
(28)
Coefficients a
i
are function of the number of balls under load, and
represents roller
translation angle.
The solution of the dynamic model requires the definition of the transmitted force. Ideally, it
should be constant, and equal to the radial force. But, it is not the case; first of all, the radial
force varies according to every application, and the rolling bearing itself produces a specific
type of excitation forces. These forces are associated with physical defects on the bearing,
and there are basically four types of excitation.
One of the challenges of a monitoring system is the identification of early faults in rolling
bearings. Failures in bearings start at surface level; thus, they generate a relatively small
N
i
i
i
)1(2
2
cos
max
Recent Advances in Vibrations Analysis
38
energy vibration compared to other sources, and its identification is very cumbersome. With
the application of phase diagram plots, early failures can be predicted in real time. The
process is as follows:
Fig. 8. Bearing stiffness function
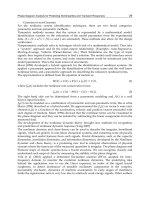
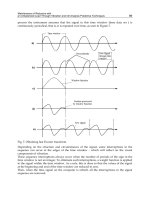
Vibrations are measured with a transducer, preferably an accelerometer. Then, the signal is
analogically integrated in real time, and the phase diagram is plotted. When the bearing is
new, the first diagram (Fig. 9) corresponds to the healthy reference. Since we know that
bearings have a nonlinear response, and that this response is the result of its stiffness
dependency on frequency, we can monitor the phase diagram in order to “see” the instant
when instabilities occur. In this way, if we permanently monitor the “shape” of the phase
diagram, and we detect the appearance of instabilities, then we will be able to detect early
faults. Fig.9 shows a phase diagram of a healthy bearing. In this figure, we can see four
major loops, they correspond to the main frequencies, the unbalance load produces the
external loop, and the other three are the mayor bearing frequencies. This diagram shows
similar shapes at different time steps.
Fig. 10 shows the phase diagram of a damage bearing. Comparing both diagrams, it is
clearly seen that bearing looses stability when there is a defect. This stability change can be
detected with an appropriate electronic monitoring system.
3.4 Friction
Dry friction is an important source of mechanical damping in many physical systems. The
viscous-like damping property suggest that many mechanical designs can be improved by
configuring frictional interfaces in ways that allow normal forces to vary with displacement.
The system is positively damped at all times and is clearly stable (Anderson & Ferri 1990)
(Oden & Martins, 1985).
Distinctions between coefficients of static and kinetic friction have been mentioned in the
friction literature for centuries. Euler developed a mechanical model to explain the origins of
2.5
2.6
2.7
2.8
2.9
3
3.1
3.2
3.3
3.4
3.5
0 36 72 108
Translation angle
Bearing Stiffness Factor
Phase Diagram Analysis for Predicting Nonlinearities and Transient Responses
39
frictional resistance. He arrived at the conclusion that friction during sliding motion should
be smaller. The experiment proposed by Euler involved the sliding of a body down an
inclined plane at slopes close to the critical slope at which sliding initiates. This, of course,
would mean that, as soon as sliding initiates, a drop of friction force occurs, the difference
between static and kinetic friction forces being responsible for the acceleration of the body
down the inclined plane (stick-slip in sliding systems).
Fig. 9. Phase diagram of a healthy bearing
The distinction between static and kinetic friction was also a major topic of Coulomb’s
detailed experimental study. Coulomb’s work is the first major reference dealing with the
increase of the coefficient of static friction with increasing times of repose (stationary contact
before the initiation of sliding). Coulomb observed a dependence of the kinetic friction on
the sliding velocity and a dependence of the static friction on the time of repose. However,
for dry metal-to-metal interfaces all those distinctions or variations were absent or
negligible.
In general, the coefficient of kinetic friction would be small and increasing with sliding
velocity at low velocities. Then, at some velocity, it would achieve a maximum value after
which it would decrease with the increase of speed. The sliding process is not a continuous
one; the motion proceeds by jerks. The metallic surfaces “stick” together until, as a result of
the gradually increasing pull, there is a sudden break with a consequent very rapid “slip”.
The surfaces stick again and the process is repeated indefinitely. When the surfaces are of
-0.025 -0.02 -0.015 -0.01 -0.005 0 0.005 0.01 0.015 0.02
-8
-6
-4
-2
0
2
4
6
8
dis
p
lacement
velocity
Phase Diagram, Experimental Data
Recent Advances in Vibrations Analysis
40
the same metal, the behavior is somewhat different. Large fluctuations in the friction still
occur but they are comparatively slow and very irregular. The average value of the frictional
force is considerably higher than that found for dissimilar metals and a well-marked and
characteristic track is formed during the sliding.
Fig. 10. Phase diagram of a damaged bearing.
It has also been observed that the frequency of the stick-slip motion increases with the
increase of the driving velocity and that the maximum value of this frequency approaches
the undamped natural frequency of the system, although in some cases the oscillation stops
at a level well below that of the natural frequency.
The Martin model (Oden &Martins 1985) considers a two-degree-of-freedom system, where
the normal force between the sliding block is its weight, and it is free to separate from the
sliding surface upwards
=
(
)
( −) . (29)
The dynamic behavior of a single-degree-of-freedom system with amplitude and rate
dependant friction forces is presented. A system with amplitude-dependant friction is more
likely to experience intermittent sticking. If the system sticks a significant amount of time,
the energy dissipation capability may be degraded. Hence, special care is taken in this
analysis to examine sticking conditions (in the case of gear teeth action sticky occurs only for
very high contact stresses). In general sticking can occur only when the sliding velocity is
zero.
-0.03 -0.02 -0.01 0 0.01 0.02 0.03
-15
-10
-5
0
5
10
15
dis
p
lacement
velocity
Phase Diagram, Rolling Bearing
Phase Diagram Analysis for Predicting Nonlinearities and Transient Responses
41
The extended friction law is (Anderson &Ferri 1990):
=
(
+
|
|
+
|
|)
() (30)
where x represents the sliding displacement, represents the sliding velocity,
is the
normal force,
is the friction interface amplitude,
is the friction interface velocity and µ
is the coefficient of friction (in general is the equivalent to the static coefficient of friction).
Fig. 11. Phase diagram for a single degree freedom model. Free vibration
The dynamic model for a single-degree-of-freedom system is represented as:
+ ++
=
cos(). (31)
The system is positively damped at all times and it is clearly stable in the sense of
Lyapunov. However the system is not asymptotically stable for
≠0. This condition is
identified from the phase diagram when
=0 and the initial x=0.1.
The friction force has a particular behavior; it can be observed in Fig. 12.
3.5 Rubbing
One of the most interesting and practically important dynamic responses of rotor systems
are caused by bearing clearances, which are mainly due to piecewise nature of stiffness
characteristics. It is well known that dynamic interactions in such systems can lead to much
more complex nonlinear behavior than in systems with smooth nonlinearities, including
existence of grazing bifurcations and untypical routes to chaos such as blowout. In rotor
-0.015 -0.01 -0.005 0 0.005 0.01 0.015
-0.8
-0.6
-0.4
-0.2
0
0.2
0.4
0.6
0.8
displacement
velocity
Recent Advances in Vibrations Analysis
42
Fig. 12. Friction force produced by the general friction law
systems, such phenomena are caused by intermittent contacts between the components of
the rotor system, which can lead to catastrophic failures. Therefore, it is vastly important to
conduct experimental verifications in order establish credible mathematical models
predicting complex dynamic responses of rotor systems.
There is a big difference between friction and rubbing. Whereas friction has a smooth phase
diagram, rubbing develops a chaotic behavior. This chaotic behavior is associated with a
sever stiffness discontinuity (Jauregui & Gonzalez 2009a; Rubio & Jauregui 2011). Pure
friction acts as a damper and stabilizes the system, whereas, rubbing modifies the stiffness
of the system. The stability pattern will depend on the hardness of the surface. If a rotor rubs
a hard surface, the phase diagram will show a pattern similar to Fig. 13. If the rotor rubs a
soft surface, the phase diagram will have a different pattern (Fig. 14).
0 0.05 0.1 0.15 0.2 0.25 0.3 0.35 0.4 0.45 0.5
-40
-30
-20
-10
0
10
20
30
40
time
acceleration
Phase Diagram Analysis for Predicting Nonlinearities and Transient Responses
43
Fig. 13. Phase diagram for a rotor rubbing a hard surface
Fig. 14. Phase diagram for a rotor rubbing a soft surface
-0.05 -0.04 -0.03 -0.02 -0.01 0 0.01 0.02 0.03 0.04 0.05
-1
-0.8
-0.6
-0.4
-0.2
0
0.2
0.4
0.6
0.8
1
displacement
velocity
-4 -3 -2 -1 0 1 2 3 4
x 10
-3
-0.15
-0.1
-0.05
0
0.05
0.1
0.15
displacement
velocity
Recent Advances in Vibrations Analysis
44
4. Conclusions
The phase diagram or phase space is a geometric representation of the Hamiltonian function
of a dynamic system. It represents the relationship between the potential and kinetic
energies at any time. Since the dynamic instability of a system will modify the trajectory of
the phase space, the phase diagram will reflect any significant change in the Hamiltonian
function. Thus, the phase diagram is a useful tool for predicting and monitoring nonlinear
systems, and also it can identify transient responses. Linear systems have stable, well
defined elliptical functions.
The phase diagram can be implemented into an electronic device, and it is possible to
construct it in real time. The difficulty arises from its interpretation. Therefore, it is
important to understand the phase diagrams of each system. It is known that there is no
single model that can describe a nonlinear system. Some mechanical elements can be
represented with certain models, but their dynamic response will depend not only on the
model, but also in the system’s sensibility to the nonlinear terms.
The phase diagram can be used to determine the system response and it can identify when a
dynamic system becomes instable. For most nonlinear systems, the phase space changes
from a smooth simple geometry, to a completely different pattern. Even more, under stable
conditions, the phase space repeats its shape periodically, whereas under an unstable
condition, the pattern changes as a function of time.
5. References
Kerschen, G., Worden, K., Vakakis, A. & Golinvala, J. (2006). Past, present and future of
nonlinear system identification in structural dynamics, Mechanical Systems and
Signal Processing, Vol. 20, pp 505–592
Masri, S., (1994). A hybrid parametric/nonparametric approach for the identification of
nonlinear systems, Probabilistic Engineering Mechanics, Vol. 9, pp 47-57
Wiercigroch, M. & Pavlovskaia, E., (2008) Non-linear dynamics of engineering systems,
International Journal of Non-Linear Mechanics, Vol. 43 pp 459 -461
Pai, F., (2007) Nonlinear vibration characterization by signal decomposition, Journal of Sound
and Vibration, Vol. 307 pp 527–544
Yang, J., Zhang, Y. & Zhu, Y. (2007). Intelligent fault diagnosis of rolling element bearing
based on SVMs and fractal dimension, Mechanical Systems and Signal Processing Vol.
21 pp 2012–2024
Li, C. & Qu, L. (2007) Applications of chaotic oscillator in machinery fault diagnosis,
Mechanical Systems and Signal Processing Vol. 21 pp 257–269
Rüdinger, F. & Krenk, S., Non-parametric system identification from non-linear stochastic
response, Probabilistic Engineering Mechanics, Vol. 16 pp 233-243
Schuëller, G. (1997) A State-of-the-Art Report on Computational Stochastic Mechanics,
Probabilistic Engineering Mechanics, Vol. 12, No. 4, pp. 197-321
Vela, L., Jauregui, J., Rodriguez, E., & Alvarez, J. (2010) Using detrended fluctuation analysis
to monitor chattering in cutter tool machines, International Journal of Machine Tools
& Manufacture Vol. 50 pp 651–657
Phase Diagram Analysis for Predicting Nonlinearities and Transient Responses
45
Modarres,Y., Chasparis,F., Triantafyllou, M., Tognarelli ,M. & Beynet, P. (2011) Chaotic
response is a generic feature of vortex-induced vibrations of flexible risers, Journal
of Sound and Vibrations, Article in press.
Liu, B., (2005) Selection of wavelet packet basis for rotating machinery fault diagnosis,
Journal of Sound and Vibration Vol. 284 pp 567–582
Wang, G., Li, Y., & Luo, Z., (2009) Fault classification of rolling bearing based on
reconstructed phase space and Gaussian mixture model, Journal of Sound and
Vibration Vol.323 pp 1077–1089
Wang, Z., Akhtar, I., Borggaard, J., & Iliescu, T., (2011) Two-level discretizations of
nonlinear closure models for proper orthogonal decomposition, Journal of
Computational Physics Vol.230 pp 126–146
Ghafari, S., Abdel, E., Golnaraghi, F. & Ismail, F., (2010) Vibrations of balanced fault-free ball
bearings, Journal of Sound and Vibration Vol. 329 pp 1332–1347
Karpenko, E., Wiercigroch, M., Pavlovskaia, E. & Neilson, R., (2006). Experimental
verification of Jeffcott rotor model with preloaded snubber ring, Journal of Sound
and Vibration Vol. 298 pp 907–917
Mevela,B. & Guyaderb, J. (2008) Experiments on routes to chaos in ball bearings, Journal of
Sound and Vibration Vol. 318 pp 549–564
Nichols, J. (2003), Structural health monitoring of offshore structures using ambient
excitation, Applied Ocean Research Vol. 25 pp 101–114
Jauregui, J. & Gonzalez, O., (2009a), Mechanical Vibrations of Discontinuous Systems (1
st
edition), Nova Science Publishers, ISBN: 978-1-60876-126-5, New York
Jauregui, J. & Gonzalez, O., (2009b),Non-linear vibrations of slender elements, In: Mechanical
Vibrations measurements, effects and control, Sapri, R., pp 557-588, Nova Science
Publishers, ISBN: 978-1-60692-036-7, New York
Chang, C., Strong nonlinearity analysis for gear-bearing system under nonlinear suspension
-bifurcation and chaos, Nonlinear Analysis: Real World Applications Vol.11 pp 1760–
1774
Andreaus, U. & Baragatti, P., (2011) Cracked beam identification by numerically analysing
the nonlinear behaviour of the harmonically forced response, Journal of Sound and
Vibration Vol. 330 pp 721–742
Machado, L., Lagoudas, D. & Savi, M., (2009) Lyapunov exponents estimation for
hysteretic systems, International Journal of Solids and Structures Vol. 46 pp 1269–
1286
Mazzillia, C., Sanches, C., Netoa, B., Wiercigrochb, M. & Keber, M., Non-linear modal
analysis for beams subjected to axial loads: Analytical and finite-element solutions,
International Journal of Non-Linear Mechanics Vol. 43 pp 551 – 561
Anderson, J., &. Ferri, A., (1990) Behavior of a single-degree-of-freedom-system
with a generalized friction law, Journal of Sound and Vibration Vol. 140(2), pp
287-304
Oden, J., Martins, J., (1985) Models and computational methods for dynamic friction
phenomena, Computer methods in applied mechanics and engineering, Vol. 52, pp
527-634
Recent Advances in Vibrations Analysis
46
Rubio, E., Jauregui, J., (2011), Time-Frequency Analysis for Rotor-Rubbing Diagnosis,
Advances in Vibration Analysis Research, Ebrahimi, F., ISBN 978-953-307-209-8 ,
InTech Publishers
3
A Levy Type Solution for Free Vibration
Analysis of a Nano-Plate Considering
the Small Scale Effect
E. Jomehzadeh
1,2
and A. R. Saidi
1
1
Department of Mechanical Engineering,
Young Researchers Club, Kerman Branch, Islamic Azad University, Kerman
2
Shahid Bahonar University of Kerman, Young Researchers Society, Kerman,
Iran
1. Introduction
Experimental results show that as length scales of a material are reduced, the influences of
long-range interatomic and intermolecular cohesive forces on the mechanical properties
become prominent and cannot be neglected. It is well known that surfaces and interfaces in
nano structures behave differently from their bulk counterparts. For nanostructures with
size less than 100nm, the surface to volume ratio is significant and the effective properties
are altered by surface and nonlocal effects. Therefore, at nanolength scales, size effects often
become prominent, the causes of which need to be explicitly addressed especially with an
increasing interest in the general area of nanotechnology (Sharma et al., 2003).
Due to the vast computational expenses of nano-structures analyses when using atomic
lattice dynamics and molecular dynamic simulations, there is a great interest in applying
continuum mechanics for analysis of nano-structures. Classical continuum elasticity, which
is a scale free theory, cannot predict the size effects. Nonlocal continuum mechanics allows
one to account for the small length scale effect that becomes significant when dealing with
microstructures or nanostructures. It has been showed that it is possible to represent the
integral constitutive relations of nano-structures in an equivalent differential form (Eringen,
1983). Eringen presented a nonlocal elasticity theory to account for the small scale effect by
specifying the stress at a reference point is a functional of the strain field at every point in
the body. Since then, many studies have been carried out nonlocal theory of elasticity for
bending, buckling and vibration analyses of nano-structures.
Small scale effect on static deformation of micro- and nano-rods or tubes is revealed through
nonlocal Euler–Bernoulli and Timoshenko beam theories by Wang and Liew (2007). Li and
Wang (2009) investigated a theoretical treatment of Timoshenko beams, in which the
influences of shear deformation, rotary inertia, and scale coefficient are taken into account.
Murmu and Pradhan (2009a) studied vibration response of nano cantilever considering non-
uniformity in the cross sections using nonlocal elasticity theory.
Although graphite sheet has many superior properties, such as low electrical and thermal
conductivities normal to the sheet but high electrical and thermal conductivities in the plane
of the sheet, relatively little research have been reported in the literature for mechanical
analyses of graphene sheets.
Recent Advances in Vibrations Analysis
48
Kitipornchai et al. (2005) used the continuum plate model for mechanical analysis of
graphene sheets. He et al. (2005) investigated vibration analysis of multi-layered graphene
sheets in which the van der Waals interaction between layers is described by an explicit
formula. Behfar and Naghdabadi (2005) studied nano scale vibrational analysis of a multi-
layered graphene sheet embedded in an elastic medium based on the classical plate theory.
Lu et al. (2007) derived the basic equations of nonlocal Kirchhoff and Mindlin plate theories
for simply supported nano-plates. Axisymmetric bending of micro/nanoscale circular plates
was studied using a nonlocal plate theory by Duan and Wang (2007). Pradhan and Phadikar
(2009a) presented classical and first order shear deformation plate theories for vibration of
nano-plate. Their approach is based on the Navier solution and for a nano-plate with all
edges simply supported. Pradhan and Phadikar (2009b) carried out vibration analysis of
multilayered graphene sheets embedded in polymer matrix employing nonlocal continuum
mechanics.
In-plane vibration of nano-plates was investigated by Murmu and Pradhan (2009b)
employing nonlocal continuum mechanics and considering small scale effect.
Aghababaei and Reddy (2009) developed a higher order plate theory for buckling and
vibration analyses of a simply supported plate accounting the small scale effect. A nonlocal
plate model was developed to study the vibrational characteristics of multi-layered
graphene sheets with different boundary conditions embedded in an elastic medium using
finite element method (Ansari et al., 2010). Pradhan and Kumar (2010) investigated the small
scale effect on the vibration analysis of orthotropic single layered graphene sheets
embedded in an elastic medium. Jomehzadeh and Saidi (2011a) investigated the nonlocal
three dimensional elastodynamics theory to study the vibration of nano-plates. Recently,
they (2011b & 2011c) studied the nonlinear vibration of graphene sheets using classical plate
theory.
In this chapter, the vibration analysis of a nano-plate is presented by considering the small
scale effect. The three coupled governing equations of motion are obtained based on the
nonlocal continuum theory and are decoupled into two new equations. Solving these two
decoupled partial differential equations, the natural frequencies of the nano-plate with
arbitrary boundary conditions are determined. Finally, a detailed study is carried out to
understand the effects of boundary condition, nonlocal parameter, thickness to length and
aspect ratios on the vibration characteristics of nano-plates.
Results for natural frequencies of nano-plates with arbitrary boundary conditions are given
for the first time and these can serve as reference values for other numerical analysis.
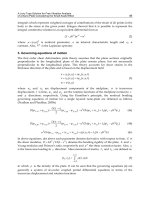
2. Constitutive relations
According to nonlocal elasticity theory, the stress at a reference point
X
is considered to be
a function of the strain field at every point
'X
in the body. The nonlocal stress tensor
nl
at
point
X
can be expressed as (Eringen, 1983)
(| ' |, ) ( ') '
nl l
KXX XdX
(1)
where
l
is the classical stress tensor and
(| ' |)KXX
is the Kernel function represents the
nonlocal modulus. While the constitutive equations of classical elasticity is an algebraic
relation between stress and strain tensors, that of nonlocal elasticity involves spatial